Why Are Young People Losing Close Friends? What the UK Data Actually Shows

- In 2023–25, 5% of 16–21-year-olds in England reported having no close friends at all. In 2014 it was 1%.
- The share with at least three close friends fell 12 percentage points over a decade, to 72%.
- Among 14–15-year-olds, positive perceptions of their friendships fell from 86% in 2010–12 to 76% in 2023–25.
- Those figures are IPPR’s analysis of Understanding Society, a long-running UK longitudinal survey — not a commissioned poll.
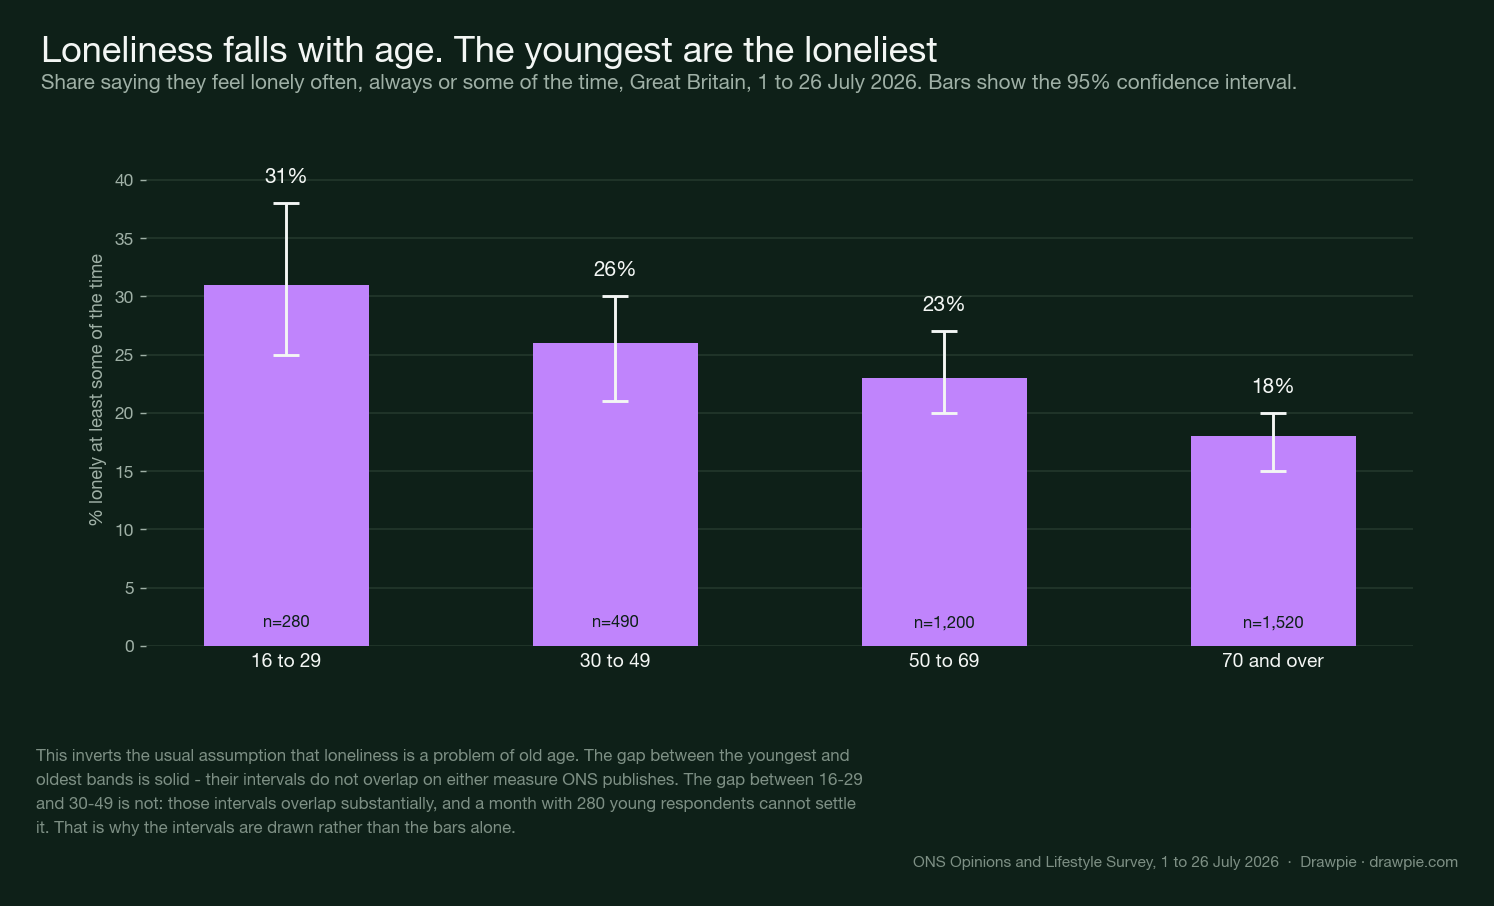
- ONS data points the same way independently: 31% of 16–29s feel lonely at least some of the time, against 18% of over-70s.
- That inverts the usual assumption. On this measure loneliness falls steadily with age.
- IPPR does not blame social media. It names austerity, Covid, economic insecurity and housing costs alongside it.
- Nothing we read separates social media from those other changes. The correlation is real; a measured effect is not.
In 2023–25, one in twenty 16–21-year-olds in England reported having no close friends at all. A decade earlier it was one in a hundred.
That number is real and properly sourced, which on this subject is worth saying up front. What is not established is the reason everyone reaches for.
The friendship numbers
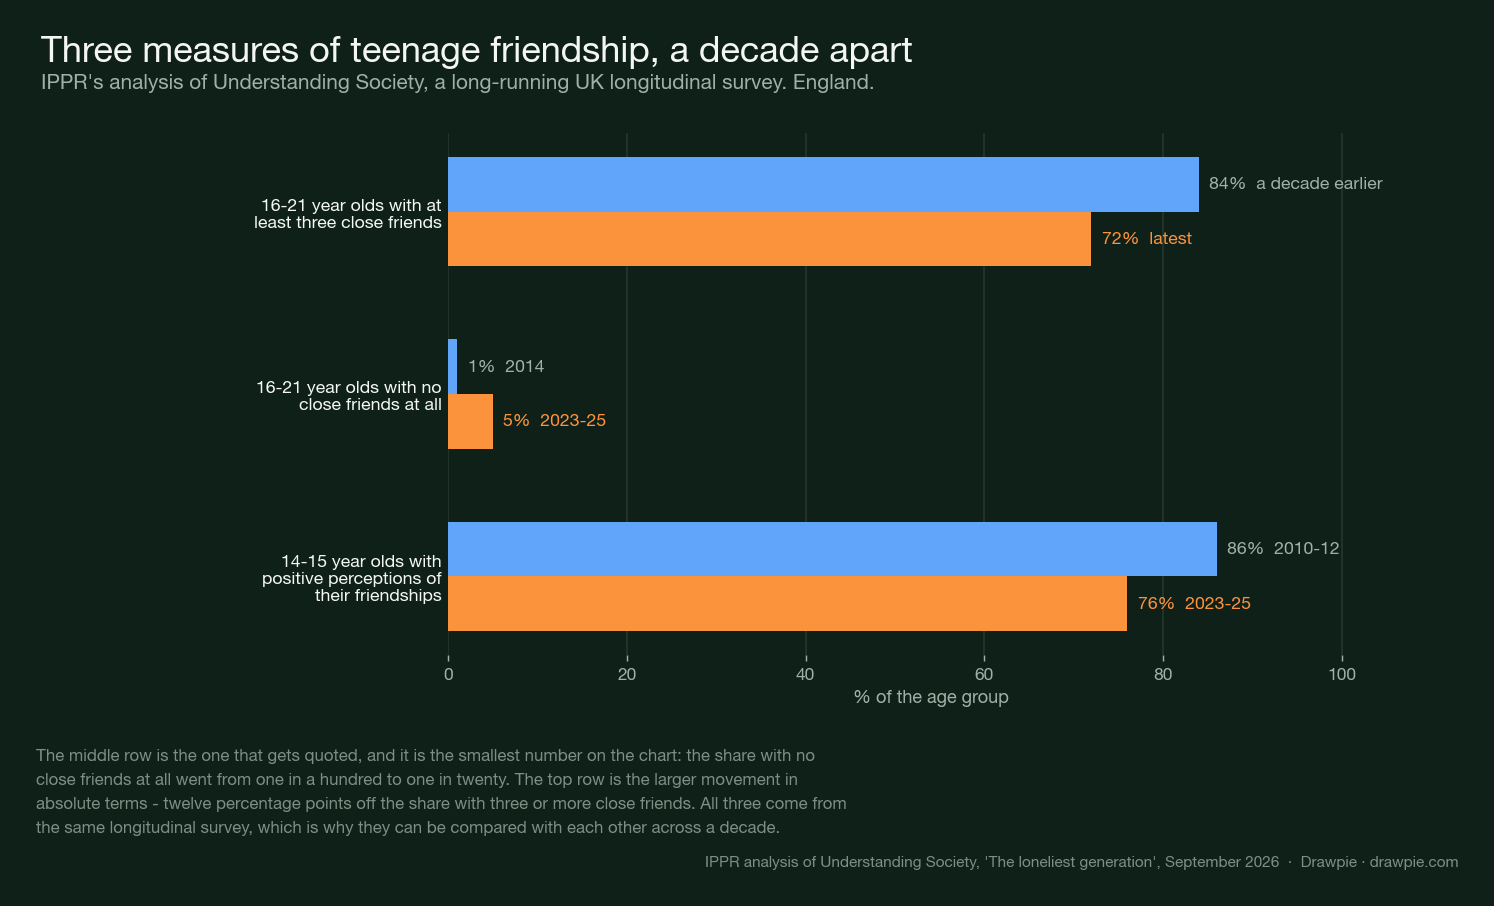
| Measure | Then | Now |
|---|---|---|
| 16–21s with at least three close friends | 84% (a decade earlier) | 72% |
| 16–21s with no close friends at all | 1% (2014) | 5% |
| 14–15s with positive perceptions of their friendships | 86% (2010–12) | 76% |
The middle row is the one that gets quoted, and it is the smallest number on the page. Going from one in a hundred to one in twenty is a fivefold rise, which sounds enormous — and it is a real change — but it describes 5% of the age group.
The top row is the bigger movement in absolute terms: twelve percentage points off the share with three or more close friends. That is not a story about a small isolated minority; it is the middle of the distribution shifting.
Where they come from
IPPR’s analysis of Understanding Society, published in its report The loneliest generation in September 2026.
That matters more than it might sound. Understanding Society is a long-running UK household longitudinal survey — it follows the same people over time, which is why a 2014-to-2025 comparison is possible at all. IPPR also analysed the Family Resources Survey and interviewed more than 150 young people across England.
This is the opposite of the usual situation with friendship statistics. When we looked at professional networking claims earlier this year, nearly every figure traced back to a company selling networking software. These trace to a named think tank’s analysis of a named longitudinal study, and the report says which datasets it used.
IPPR’s other findings from the same work, for context:
- 47% of young women aged 16–24 and 36% of young men now meet the threshold for psychological distress.
- In 2010–12, 4.1% of 16–24s said their mental health had meant they accomplished less over the previous month. IPPR puts it at 16.8% today.
Loneliness by age, and the stereotype it breaks
Separately, and from official statistics, the same direction shows up.
ONS asks how often people feel lonely. For 1 to 26 July 2026, the share saying often, always or some of the time:
| Age | Lonely at least some of the time | 95% interval | Sample |
|---|---|---|---|
| 16 to 29 | 31% | 25–38 | 280 |
| 30 to 49 | 26% | 21–30 | 490 |
| 50 to 69 | 23% | 20–27 | 1,200 |
| 70 and over | 18% | 15–20 | 1,520 |
Loneliness falls steadily with age, which inverts the assumption most people carry. The other side of the same table is starker still: 28% of 16–29s say they hardly ever or never feel lonely, against 62% of the over-70s.
What is solid and what is not. The gap between the youngest and oldest bands is clear — their confidence intervals do not overlap on either measure. The gap between 16–29 and 30–49 is not established by this month’s data: those intervals overlap substantially, and the youngest band has the smallest sample of any group. Anyone reporting a clean ranking of all four is over-reading a single month.
What about social media?
The honest answer is that nobody in the material we read has separated it out.
IPPR does not blame it. Its argument is that the trends “cannot be understood by treating young people as simply less resilient than previous generations”, and it names the context as a combination: austerity, Covid-19, rapidly growing social media use, economic insecurity, and difficult transitions into adult life such as expensive rents and unaffordable house prices.
Young people in the report do talk about phones, and the testimony is specific:
“You can’t escape it, your phone’s with you all the time, so if you and someone got in an argument at school, you’d go home and it could still carry on.”
But testimony and co-occurrence are not a measured effect. Social media use grew over exactly the decade in which the friendship numbers fell — and so did austerity, a pandemic, and a housing market that pushed young adults into later independence. Any of those could plausibly reduce the time and places in which close friendships form. Nothing we read isolates one from the others.
We also left out a number you may have seen. Some coverage attributes to this research a finding that 48% of UK 18–29s say social media makes them feel lonelier, against 30% who say it helps. It is not in IPPR’s release or its report, and we could not source it. So it is not here.
What is measured and what is not
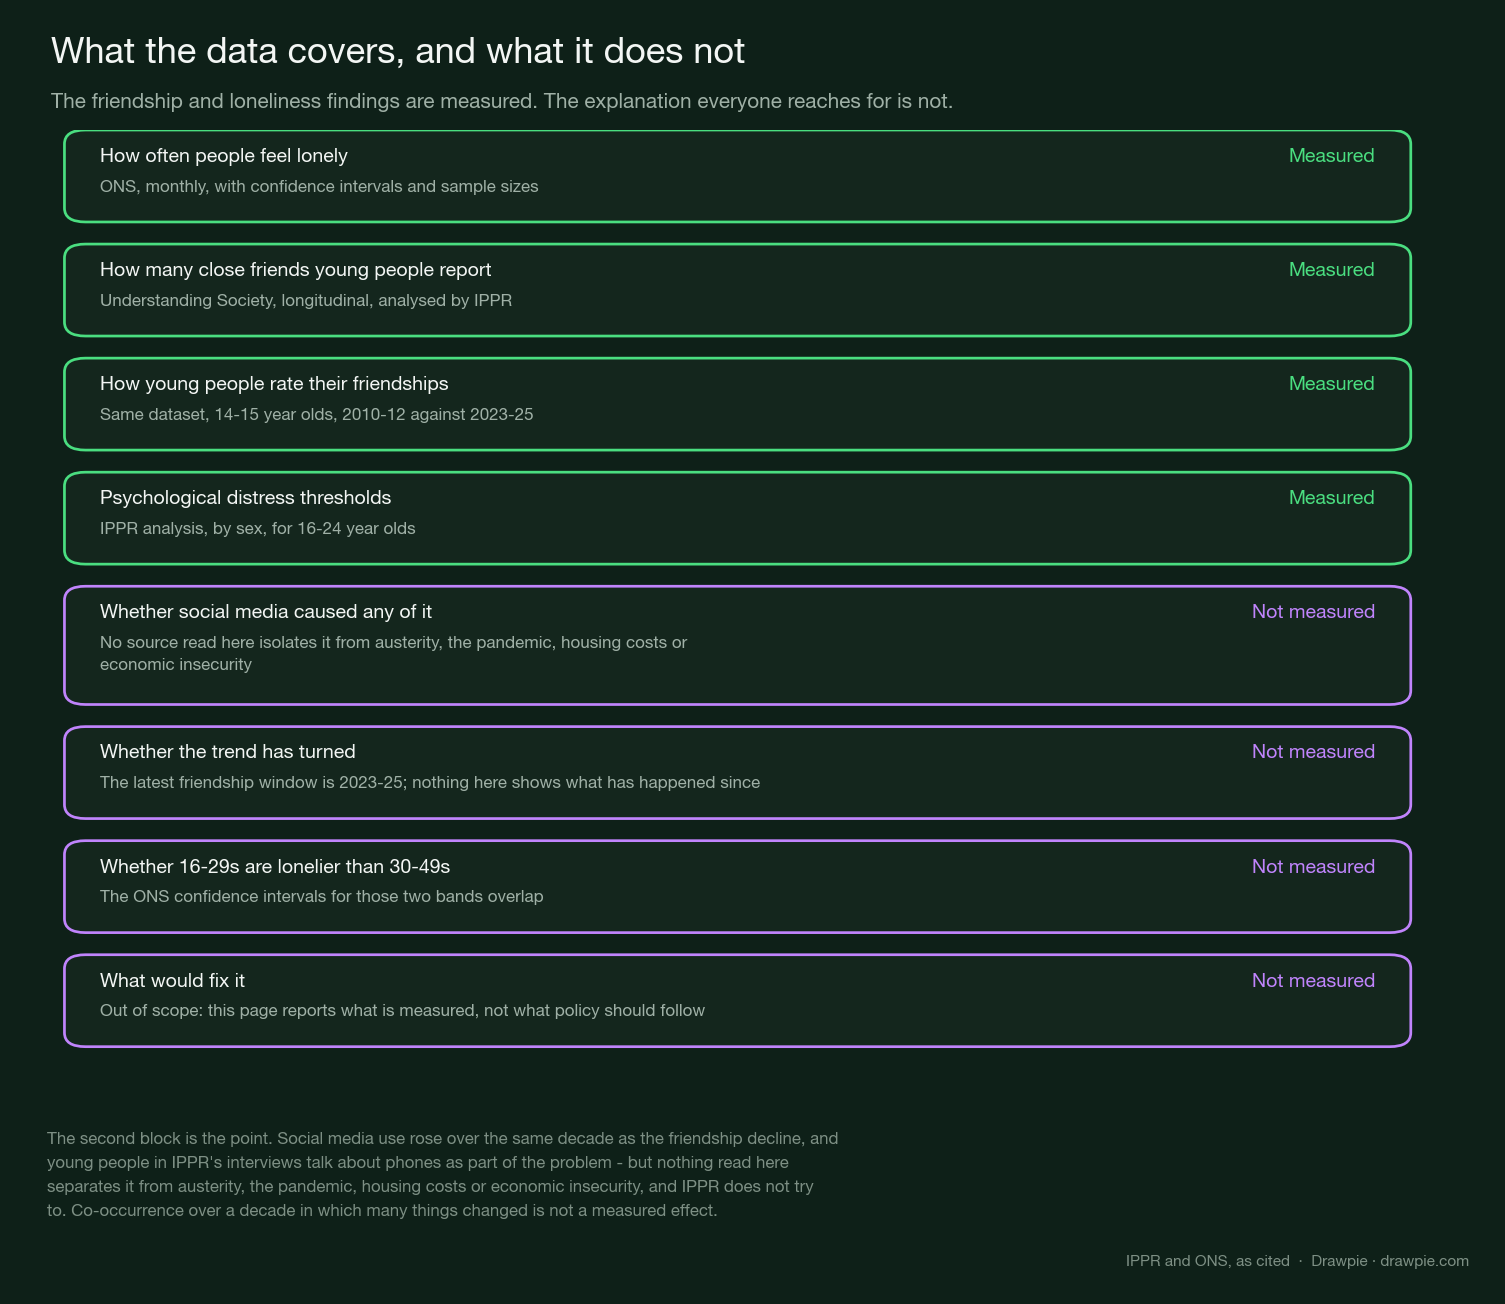
Measured:
- How often people feel lonely — ONS, monthly, with intervals and sample sizes.
- How many close friends young people report — Understanding Society, longitudinal.
- How young people rate their friendships — same dataset, 2010–12 against 2023–25.
- Psychological distress thresholds, by sex, for 16–24s.
Not measured, by anything read here:
- Whether social media caused any of it.
- Whether the trend has turned. The latest friendship window is 2023–25.
- Whether 16–29s are lonelier than 30–49s. The ONS intervals overlap.
- What would fix it. That is a policy question and this is not a policy page.
What would settle it
Three things, and none of them exists yet in what we read:
- A study that separates social media use from everything else that changed in the same decade, rather than observing that they happened together. That is hard to design and it is the reason the question stays open.
- More recent friendship data. The window ends in 2025.
- A bigger young sample in the ONS series. At 280 respondents, 16–29 carries the widest interval of any age group — the group everyone is writing about is the one measured least precisely.
The bottom line
Young people in England do have fewer close friends than they did a decade ago, and that is not a soft claim — it comes from a longitudinal survey and an independent official series points the same way.
What does not follow is the explanation. The most-quoted cause is the one with the least evidence behind it, and the organisation that produced the friendship numbers is careful not to claim it. If you take one thing from this page, take the gap between those two sentences.
Friendship figures from IPPR’s analysis of Understanding Society in The loneliest generation (September 2026). Loneliness figures from the ONS Opinions and Lifestyle Survey for 1 to 26 July 2026, read from the published spreadsheet.