Why Is Ethereum Going Up? ETH Price Rally Explained, August 2026

- Ether traded at about $2,389 at 14:54 UTC on 21 August 2026. The move that produced this rally happened on Thursday 20 August, which gained 17.69% — the single largest day in the past 365. The following day added 3.24%, which ranks 39th of 364.
- One of the four dated events inside the run is specific to Ethereum. Fidelity’s ether fund filed an amended registration statement on 19 August whose stated purpose is to add staking, and which says the sponsor will stake all of the trust’s ether.
- Ether is the most volatile of the three large crypto assets on this site. It moved more than 5% on 43 of the past 364 days — one every 8.5 days — against 33 for XRP and 13 for bitcoin.
- It is not a recovery. Ether is about 52% below its all-time high of $4,946.05, set on 24 August 2025 — a high whose first anniversary falls three days after this was written. Returning to it would take a further gain of about 107%.
Ether traded at about $2,389 at 14:54 UTC on 21 August 2026 — but the day that produced this rally was Thursday 20 August, not the day you are probably reading this.
That Thursday gained 17.69%, the largest single day ether has had in the past 365. The day after it added 3.24%, which ranks 39th out of 364.
This article does not forecast the ether price and does not carry anyone else’s price target. It reports what has already happened, and is explicit about what cannot be known.
How much is Ethereum up?
About $2,389, after a 24-hour session that ran between $2,273.45 and $2,447.99.
| Reading | Value | Source, timestamped |
|---|---|---|
| Spot price | $2,388.62 | Coinbase, 14:54 UTC 21 Aug |
| Spot price | $2,389.45 | Kraken, 14:54 UTC 21 Aug |
| Spot price | $2,390.94 | CoinGecko aggregate, 14:51 UTC 21 Aug |
| 24-hour high | $2,447.99 | Kraken |
| 24-hour low | $2,273.45 | Kraken |
| 24-hour open | $2,326.21 | Kraken |
| 24-hour change | +2.7% | Kraken, from the open above |
| 24-hour change | +5.0% | CoinGecko, its own window |
Two things are worth noticing before anything else.
The two most-quoted “24-hour” numbers for ether disagree by more than two percentage points, because they measure different windows across different venues. Neither is wrong. A page that gives you one of them without saying whose window it is has made a choice on your behalf.
And both of them are small. Ether has gained 23.4% over the past seven completed days — the move is real, and it is a weekly move being read as a daily one.
When did ether’s big move actually happen?
On Thursday 20 August 2026 — and it was ether’s largest single day of the past year.
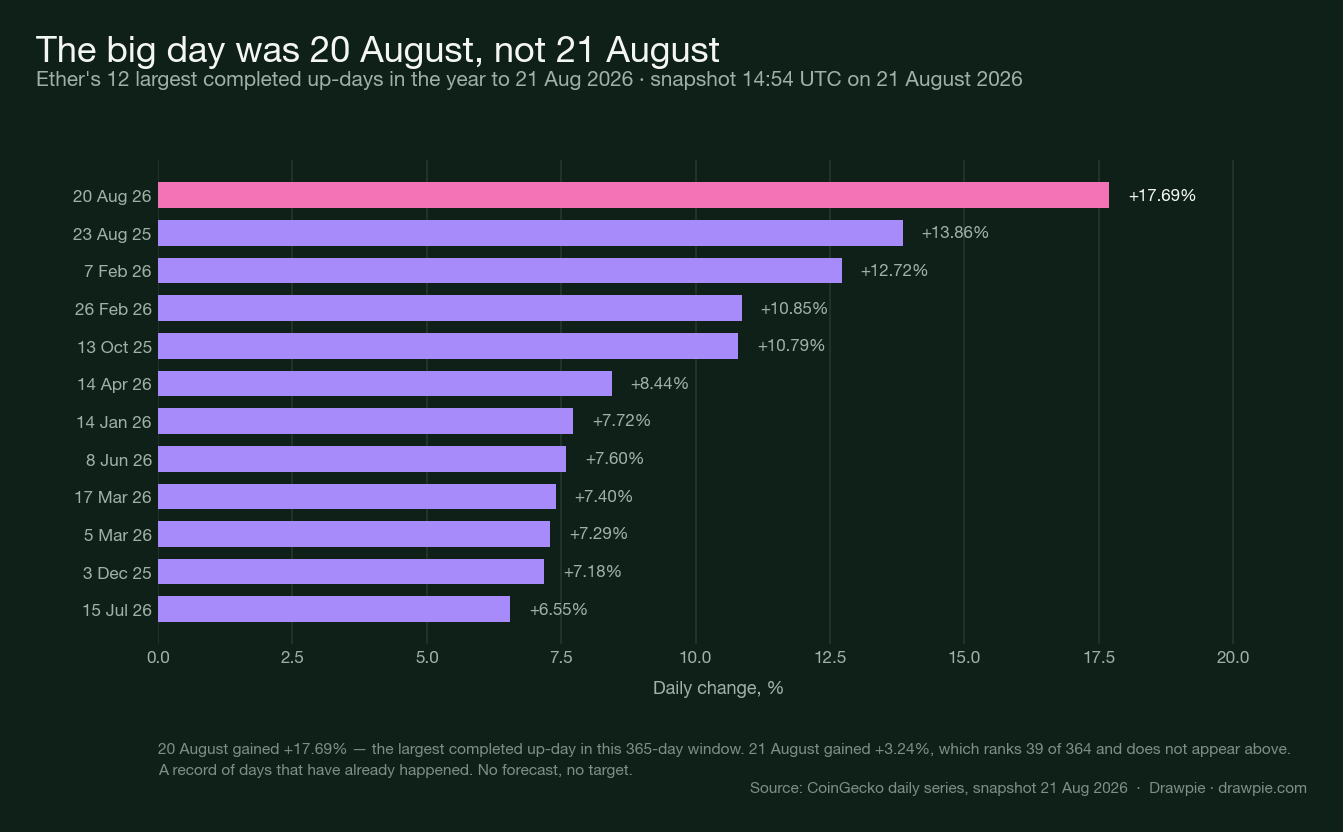
| Day | Change | Rank in the past 364 days |
|---|---|---|
| Thu 20 Aug 2026 | +17.69% | 1 |
| Sat 23 Aug 2025 | +13.86% | 2 |
| Sat 7 Feb 2026 | +12.72% | 3 |
| Fri 21 Aug 2026 | +3.24% | 39 |
This is the single most useful thing to know if you have arrived from a search asking why ether is going up. The move you are looking for is dated 20 August 2026. What followed it is a much smaller continuation.
It matters because a 3% day in ether is unremarkable — the base-rate table further down puts 43 such days in the past year — while a 17.69% day is the biggest in a year. Attributing the small day to whatever news happened to be published alongside it is the most common way these pages go wrong.
How does ether’s move compare with bitcoin and XRP?
All three rose over the same week, and ether landed in the middle.
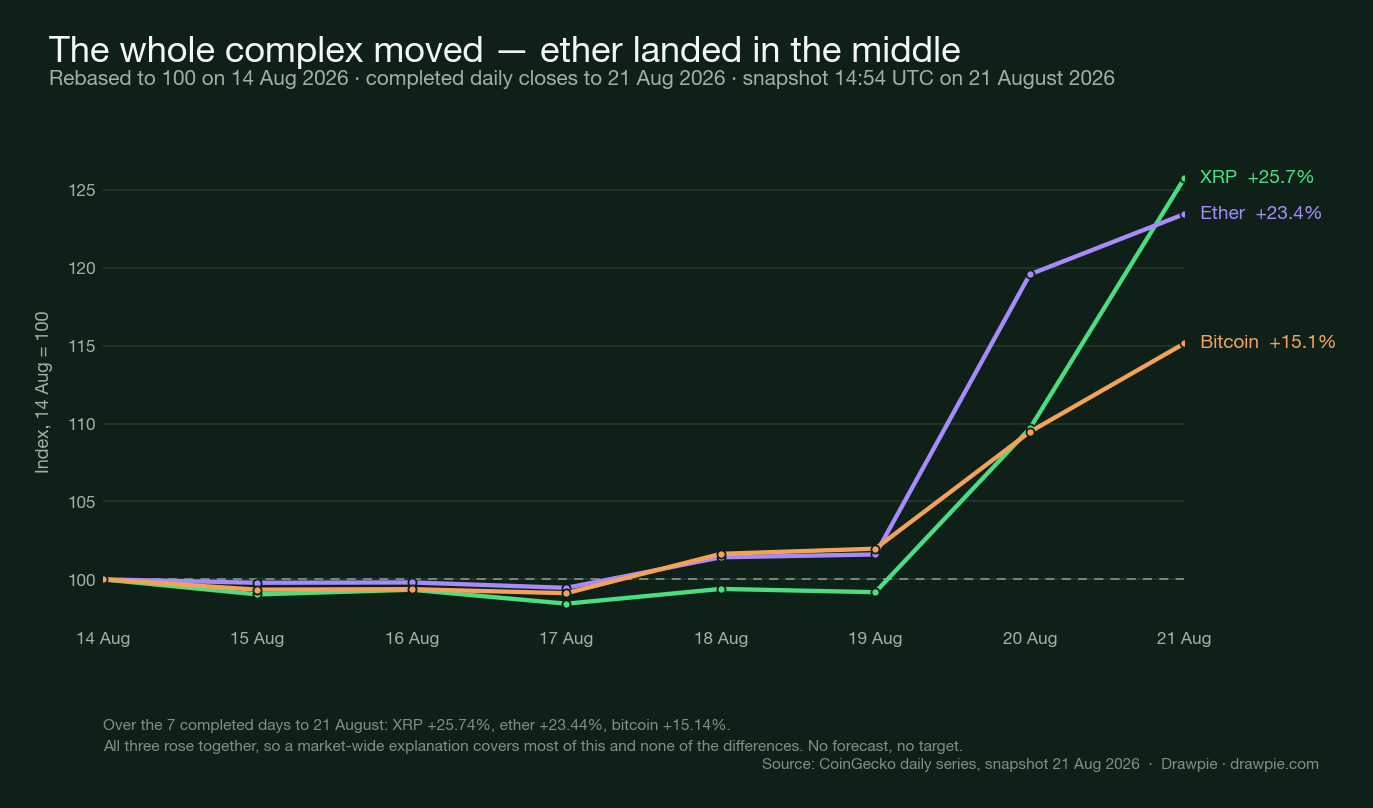
| Seven completed days to 21 Aug 2026 | Change |
|---|---|
| XRP | +25.74% |
| Ether | +23.44% |
| Bitcoin | +15.14% |
All three were flat, and slightly down, until 19 August. Nothing was building in any of them.
That shape is what makes a market-wide explanation plausible for most of this move, and it is also what makes an ether-specific explanation hard: whatever lifted ether also lifted two assets with entirely different technology, supply schedules and regulatory histories. We covered the same week from XRP’s side and bitcoin’s biggest week of the year separately.
One detail the chart shows that the endpoints do not: ether and XRP did not jump on the same day. Ether’s step is between 19 and 20 August; XRP’s is between 20 and 21. They ended the week close together by different routes.
Why is Ethereum going up?
Nobody can tell you, and the pages that do are describing a story rather than showing evidence. What can be done honestly is to lay out the dated, checkable things that happened in the same window.
| Date | Event | What the issuing body actually said |
|---|---|---|
| 18 Aug 2026 | SEC proposes Regulation Crypto Assets | Proposed rules creating “a clear and fit-for-purpose framework for certain investment contracts involving crypto assets” |
| 19 Aug 2026 | Fidelity’s ether fund files to add staking | The amendment’s stated purpose is to “include disclosure regarding the addition of staking of ether held by the Registrant” |
| 19 Aug 2026 | White House hosts crypto executives | Trump met the heads of Ripple, Coinbase, Kraken, Robinhood and ICE, with SEC Chairman Paul Atkins present |
| 19 Aug 2026 | Treasury enlarges long-end buybacks | Buyback operations go from a $2bn maximum to “at least $4 billion per operation”, from 9 September |
The Fidelity filing is the only one of the four that is about ether specifically. Fidelity Ethereum Fund filed an amended registration statement on 19 August — the day before ether’s largest day of the year. The document says the sponsor will use its custodians “to stake, or cause to be staked, all of the Trust’s ether” with node operators, and that while the trust may stake up to 100%, there is no minimum it is required to stake.
That is a genuine change in what a large regulated ether product would do with the coins it holds, and it is dated. It is still not proof of anything about the price, and this page does not present it as such.
Why single-day attribution cannot be settled. Ether trades continuously across dozens of venues, with no disclosure requirement about who is buying. There is no equivalent of a company announcement that a price move can be pinned to. Any claim that a specific factor caused a specific move is an inference from correlation, and on a single episode it cannot be tested. We have written before about why no formula reliably explains a crypto price .
The numbers most often offered as the mechanism for 20 August — the scale of short liquidations, the size of ETF inflows — come from feeds that are paywalled or that we could not control-test. The two most-repeated liquidation figures for that day differ from each other by about a billion dollars. Neither is printed here.
Is a move like this unusual for ether?
A 17% day is. A 3% day is not — ether moves more than 5% about once every eight and a half days.
| Over the past 364 completed days | Ether | XRP | Bitcoin |
|---|---|---|---|
| Days up more than 5% | 22 | 18 | 7 |
| Days down more than 5% | 21 | 15 | 6 |
| Total beyond ±5% | 43 | 33 | 13 |
| Roughly one such day every | 8.5 days | 11 days | 28 days |
Ether is the most volatile of the three, and by a wide margin against bitcoin. That is the base rate a single green day has to be read against: 43 days out of 364 moved more than 5%, and 21 of those were falls.
The base rate does not tell you what comes next. It tells you how much information one day contains, which is less than a headline implies.
What has ether actually done this year?
It is down. Ether is about 52% below its all-time high and roughly 20% below where it started 2026.
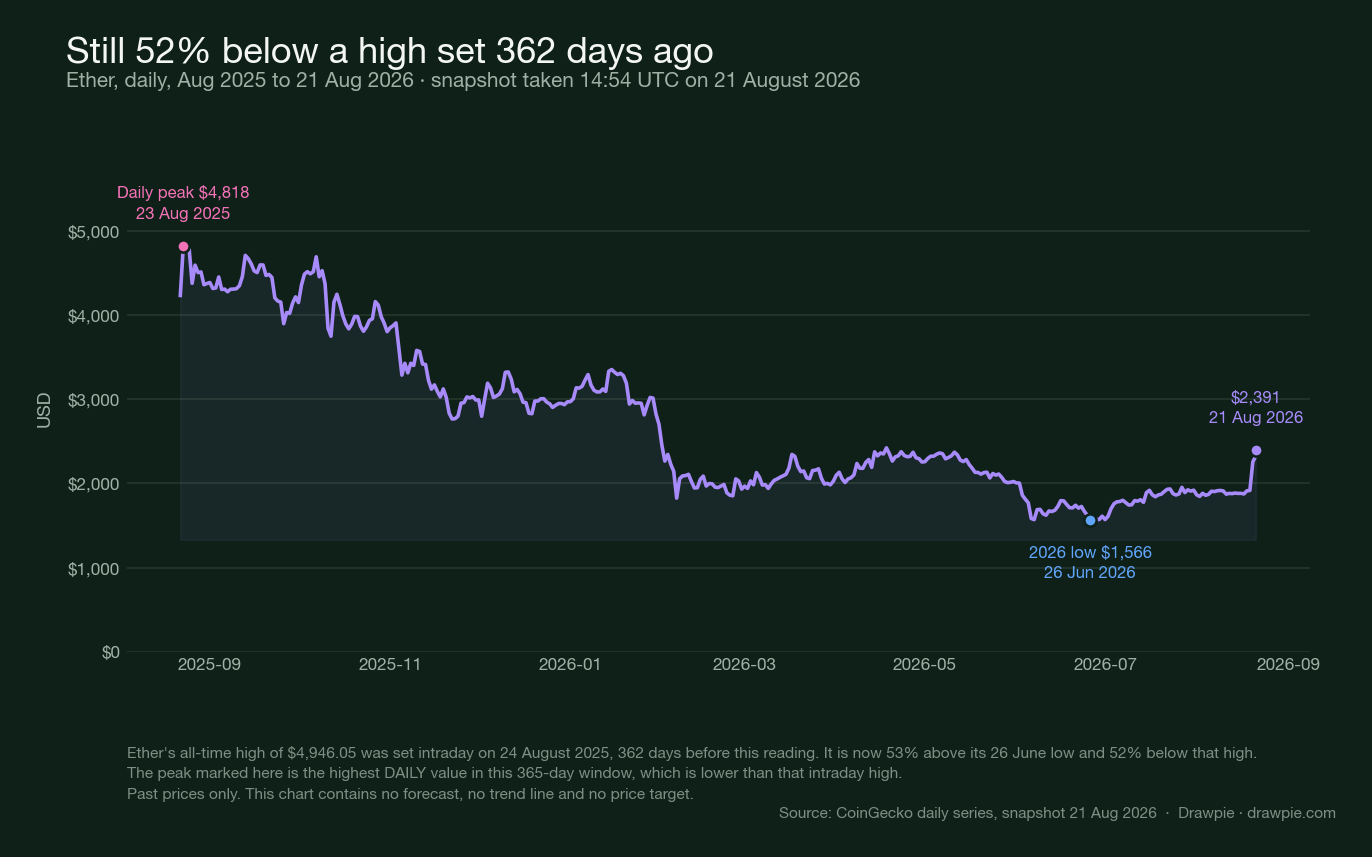
| Measure | Value |
|---|---|
| All-time high | $4,946.05, 24 August 2025 |
| Current distance from it | about −52% |
| Gain that would be needed to return to it | about +107% |
| Highest daily price in the past year | $4,817.76, 23 August 2025 |
| 2026 low | $1,566.01 on 26 June 2026 |
| Gain from that low | about +53% |
| Change since 1 January 2026 | about −20% |
| Last at this price before August | 18 April 2026 |
There is a date in that table worth sitting with. Ether’s all-time high was set on 24 August 2025 — 362 days before this was written. Its first anniversary falls three days from now, and ether is a little under half the price it was.
That 107% is arithmetic, not a target. A 52% fall requires a 107% gain to undo; the asymmetry is a property of percentages, and this page takes no view on whether it happens.
What should you watch from here?
Dated events, not opinions about direction.
| What to watch | When | Why it is on this list |
|---|---|---|
| The Fidelity staking amendment | Ongoing at the SEC | It is a filing, not an approved change. What the final registration statement says, and when it takes effect, are separate later events |
| SEC comment period on Regulation Crypto Assets | 60 days from Federal Register publication | Also a proposal. The final text is what matters |
| Next FOMC meeting | 15–16 September 2026 | Carries a Summary of Economic Projections |
| Treasury buyback operations | From 9 September, through 4 November 2026 | The enlarged operations run to the end of the refunding quarter |
| Whether ether keeps pace with XRP and bitcoin | Daily | If the three keep moving together, the explanation is the market. If ether separates, there is something ether-specific to find |
What this page will not tell you
- Where ether goes next. No forecast, no target, no range, no “if it breaks X” level. That is a site-wide rule for anything with a market price.
- What any analyst thinks it is worth. Third-party price targets are not republished here, even with attribution — and for this search term they are most of what is on offer.
- Whether to buy, sell or hold anything. Nothing on this page is investment advice.
- What caused the 20 August move. Not because it is uninteresting, but because it is not knowable from any source available to a reader.
- How much was liquidated, or how much went into ETFs. Both are quoted everywhere, neither could be verified, so neither is printed.
Sources
| Source | What it supports here |
|---|---|
| Coinbase spot price API | The $2,388.62 reading at 14:54 UTC on 21 August 2026, and the control test that an invented pair returns an error |
| Kraken public ticker API | The $2,389.45 reading, the 24-hour high, low and open, and the +2.7% computed from them |
| CoinGecko ether market data | The $2,390.94 aggregate timestamped 14:51:40 UTC, its +5.02% 24-hour figure, and the all-time high of $4,946.05 with its 24 August 2025 date |
| CoinGecko ether daily market chart | The 365-day series behind all three charts, the 26 June 2026 low, the year-to-date change, and every daily ranking and seven-day calculation |
| SEC EDGAR: Fidelity Ethereum Fund filing history | That the fund filed an S-3/A on 19 August 2026 and a 424B3 on 21 August, and the control test that an invented CIK returns 404 |
| SEC EDGAR: Fidelity Ethereum Fund S-3/A, 19 August 2026 | The stated purpose of the amendment, and the quoted language on staking all of the trust’s ether with no required minimum |
| SEC: SEC Proposes New Regulation Crypto Assets (18 Aug 2026) | The 18 August date, the proposal’s name and purpose, and that it is a proposal with a 60-day comment period |
| U.S. Treasury: increased sizes of nominal long-end liquidity support buybacks (19 Aug 2026) | The increase to an at-least-$4 billion maximum per operation and the 9 September effective date |
| The Washington Times: Trump hosts crypto executives at the White House (19 Aug 2026) | The 19 August White House meeting and its attendee list including SEC Chairman Paul Atkins |
| Federal Reserve: FOMC calendars | That the next FOMC meeting is 15–16 September 2026, with projections |
Checked 21 August 2026, with every price stamped to the minute it was read.
This article contains no price forecast, and quotes no third-party price target. It is a record of prices that have already occurred and of published documents from the SEC, the U.S. Treasury and the Federal Reserve. Cryptocurrency prices are volatile and can fall as well as rise. Nothing here is investment advice or a recommendation to buy, sell or hold any asset. Do your own research and consider a licensed professional before acting on anything you read about markets.
How we verified this
Every price here was read from an exchange or market-data API and stamped, not taken from coverage. At 14:54 UTC on 21 August 2026, Coinbase’s spot endpoint returned $2,388.615 and Kraken’s ticker returned $2,389.45, with 24-hour figures of a $2,447.99 high, a $2,273.45 low and a $2,326.21 open. CoinGecko’s aggregate, timestamped 14:51:40 UTC, returned $2,390.94.
All three endpoints were control-tested, and one needs its body read rather than its status code. An invented pair on Coinbase returns an error and an invented coin id on CoinGecko returns 404. Kraken returns HTTP 200 for a nonsense pair, with EQuery:Unknown asset pair in the body instead of a price.
⚠️ The two “24-hour change” figures disagree, and that is not an error. Kraken’s own rolling window gives +2.72% from its $2,326.21 open; CoinGecko’s cross-venue figure gives +5.02%. Different windows, different venues. Both are stated with their source rather than averaged.
🔴 The central claim of this page is a ranking, and it is asserted in code rather than typed. The chart script computes every completed daily change in the snapshot, ranks them, and asserts that 20 August is rank 1 and that 21 August falls outside the top ten. If a future snapshot breaks either condition the script fails rather than rendering a chart whose headline no longer matches the data. On the snapshot used here, 20 August is +17.69% at rank 1 of 364, and 21 August is +3.24% at rank 39.
⚠️ The final point of a CoinGecko daily series is the live price, not a completed day. With interval=daily the last two entries share a date. Every completed-day statistic here excludes it. The charts are built from committed snapshots taken at 14:54 UTC (ether), 14:11 (XRP) and 13:33 (bitcoin) on 21 August, and the three-asset chart asserts that all three cover the same completed days before drawing anything.
The Ethereum-specific filing was read at EDGAR, not in coverage of it. Fidelity Ethereum Fund, CIK 0002000046, filed an S-3/A on 19 August 2026. Its own text states the amendment is filed to “include disclosure regarding the addition of staking of ether held by the Registrant”, and the prospectus says the sponsor will use the custodians “to stake, or cause to be staked, all of the Trust’s ether” with node operators, with no minimum percentage required. A 424B3 followed on 21 August. The submissions endpoint was control-tested: an invented CIK returns 404, and an invented phrase in EDGAR full-text search returns zero hits where the fund’s name returns hundreds.
The other three dated events are each from the body that issued them. SEC press release 2026-76 is dated 18 August and quoted directly; an invented press-release path on the same host does not return it. Treasury’s 19 August release was read on home.treasury.gov, where an invented release number returns 404. The White House meeting of 19 August and its attendee list come from mainstream political reporting rather than crypto press, and that report’s description of the SEC proposal matches the SEC’s own release.
🔴 No cause is asserted anywhere on this page. The four events are reported because they are dated and checkable, not because any of them can be shown to have moved the price. Ether trades continuously across dozens of venues with no disclosure of who is buying. The Fidelity filing is the closest thing to an Ethereum-specific event in the window, and it is still only that — an event in the window.
⚠️ Several numbers being circulated as evidence were sought and discarded. The two most-repeated short-liquidation figures for 20 August differ from each other by a billion dollars, and spot-ETF flow numbers come from a tracker that returns the same response for a real and an invented path. None of them appears here.
⚠️ The search results for this question are dominated by price-prediction pages, most carrying targets for 2026, 2030 or 2040. Nothing of that kind is repeated or linked here.
This article contains no price forecast and quotes no third-party price target. The 107% figure is what a 52% decline implies in percentage terms, not a level anyone expects to be reached.