When Will the 2027 Social Security COLA Be Announced? Key Date, Latest Projections & Payment Increase
Update log (1)
- — August's CPI-W came in at 328.481, up 3.5% on the year, so two of the three months the 2027 COLA is calculated from are now published; only September's, due 14 October, is still to come. The two published projections are The Senior Citizens League's 3.5% (11 September, down from 3.6%) and AARP's 3.6% (September). The earlier 3.1% 'July held flat' calculation and its dollar comparison are gone, and so is the quarter chart, which still showed August as unpublished. Corrections: the earlier version said either scenario would be the largest increase in four years, but the 2024 COLA was 3.2%, so anything above that would be the largest since 2023's 8.7%; it applied a $1,937.53 baseline described as the average retirement benefit, and dollar figures now use SSA's August 2026 average retired-worker benefit of $2,087.52; and the 2020s average now spans 2020 to 2026 rather than 2020 to 2025.

- The 2027 COLA is announced on Wednesday 14 October 2026 — the same day the Bureau of Labor Statistics publishes the September CPI, which is the last piece of data the formula needs.
- That date can move. In 2025 the September CPI slipped to 24 October and the COLA announcement slipped with it, nearly two weeks later than the 10–13 October it had landed on in each of the four previous years. This year federal funding runs through 11 December and BLS still lists 14 October.
- The base the increase is measured from is fixed and public: the 2025 third-quarter CPI-W average of 317.265.
- Two of the three months are in. July’s CPI-W was 327.104 and August’s was 328.481, up 3.5% on the year. September lands 14 October.
- The two months published so far average 3.3% above the base. That is data to date, not a projection: the COLA uses all three months.
- The Senior Citizens League projected 3.5% on 11 September and AARP projected 3.6% in September. On SSA’s August average retired-worker benefit of $2,087.52, those are +$73.06 and +$75.15 a month. Neither is a Drawpie forecast.
The 2027 Social Security cost-of-living adjustment will be announced on Wednesday 14 October 2026 — the same day the Bureau of Labor Statistics publishes the September Consumer Price Index.
Those two things are the same event for a reason. The COLA is not a decision anybody makes; it falls out of a formula written into the Social Security Act, and September’s inflation reading is the last number that formula needs. Two of its three months are now published. The third arrives that morning.
When will the 2027 Social Security COLA be announced?
Wednesday 14 October 2026. BLS has the September CPI scheduled for 8:30am ET that morning, and repeated the date in its August release on 11 September. SSA has announced the COLA on the day of that release in each of the last five years.
The pattern in SSA’s own press release archive is tight:
| Announced | COLA | For |
|---|---|---|
| 24 Oct 2025 | 2.8% | 2026 |
| 10 Oct 2024 | 2.5% | 2025 |
| 12 Oct 2023 | 3.2% | 2024 |
| 13 Oct 2022 | 8.7% | 2023 |
| 13 Oct 2021 | 5.9% | 2022 |
Why 14 October, and could it move?
It could, and last year it did.
Look again at that table. Four of the five announcements land between the 10th and the 13th of October. The fifth, in 2025, came on the 24th — nearly a fortnight later. That was not SSA changing its mind; a federal shutdown pushed the September 2025 CPI to 24 October, and the announcement followed it the same day.
So the date to watch is really the CPI date. If the September 2026 release holds at 14 October, the COLA comes that morning. If that release slips, expect the COLA to slip with it by roughly the same amount.
The cause of last year’s slip is not in play this time. A continuing resolution, P.L. 119-103, was signed on 2 September and funds federal agencies through 11 December 2026, and BLS’s calendar still lists 14 October. That lowers the risk without removing it, so if the date matters to you, check the BLS calendar the week before.
How is the COLA actually calculated?
By comparing one three-month average with another. The Social Security Act sets it out: take the average CPI-W across July, August and September, compare it with the average for the same quarter of the last year a COLA took effect, and round the increase to the nearest tenth of a percentage point.
The base for this one is already fixed and public. SSA’s 2025 third-quarter CPI-W figures were 316.349 for July, 317.306 for August and 318.139 for September, averaging 317.265. That is the number the 2026 quarter will be measured against.
Two of the three 2026 months are now in, both published by BLS:
| Month | 2025 | 2026 |
|---|---|---|
| July | 316.349 | 327.104 |
| August | 317.306 | 328.481 |
| September | 318.139 | due 14 Oct |
| Average | 317.265 | pending |
August’s CPI-W was up 3.5% on the year; July’s was up 3.4%. Add July and August and divide by two and you get 327.7925, which is 3.3% above the base:
(327.7925 − 317.265) ÷ 317.265 × 100 = 3.3%
Read that as data to date, not a projection. The COLA uses all three months, September’s reading is not out, and nothing on this page says where it will land.
One more thing about that index is worth knowing, because it is unusual and it is not an accident. CPI-W is not a retirees’ index. BLS defines its population as households where more than half of income comes from clerical or wage occupations and at least one earner worked 37 weeks or more in the past year — roughly 30% of the US population, and by construction a working one. The adjustment that keeps retirement benefits level with prices is therefore pegged to what wage-earning households buy, not to what retirees buy. That is a long-running criticism of the mechanism rather than a flaw in this year’s number, but it explains why some groups argue for a different index entirely.
What are the latest 2027 COLA projections?
As of 2 October 2026, two organizations have published dated projections since August’s CPI came out:
| Source | Projection | Dated |
|---|---|---|
| The Senior Citizens League | 3.5% | 11 Sep 2026 |
| AARP | 3.6% | Sep 2026 |
The Senior Citizens League (TSCL) runs a statistical model each month. Its projection has drifted down since the spring: 3.9% in May, 3.8% in June and July, 3.6% on 12 August and 3.5% on 11 September, the day August’s CPI was published. AARP says its 3.6% draws on the latest BLS price data and Federal Reserve projections of inflation trends in the coming weeks.
Both sit above the 3.3% that the two published months show. That means each one assumes September’s reading lifts the quarter’s average, and that assumption is the model’s, not the data’s. It is the one thing still unmeasured, and it is why these numbers move.
The reading underneath has been volatile, too. BLS has the annual CPI-W change at 2.2% in January, 4.4% in May, then 3.5%, 3.4% and 3.5% for June, July and August. A model fed a series that has doubled and then eased inside seven months will produce a different answer each month, and TSCL’s has. Neither projection is a Drawpie forecast.
How much would that add to a monthly payment?
SSA’s Monthly Statistical Snapshot puts the average retired-worker benefit at $2,087.52 for August 2026. Applied to that figure, the two published projections come out like this:
| Projection | New monthly | Increase |
|---|---|---|
| TSCL — 3.5% | $2,160.58 | +$73.06 |
| AARP — 3.6% | $2,162.67 | +$75.15 |
Over a year that is roughly $877 and $902.
Dollar figures quoted elsewhere will not match these, because outlets start from different baselines. TSCL’s own release uses $1,940.08 and puts the increase at $67.90; AARP’s uses about $2,086 and puts it at $75. This page uses the SSA retired-worker figure throughout so the two projections are compared on one footing. The number that matters to you is the benefit shown in your own my Social Security account.
How does that compare with recent years?
Both published projections are above 2024’s 3.2%, so either would make 2027 the largest increase since the 8.7% for 2023. The 2025 and 2026 adjustments were 2.5% and 2.8%.
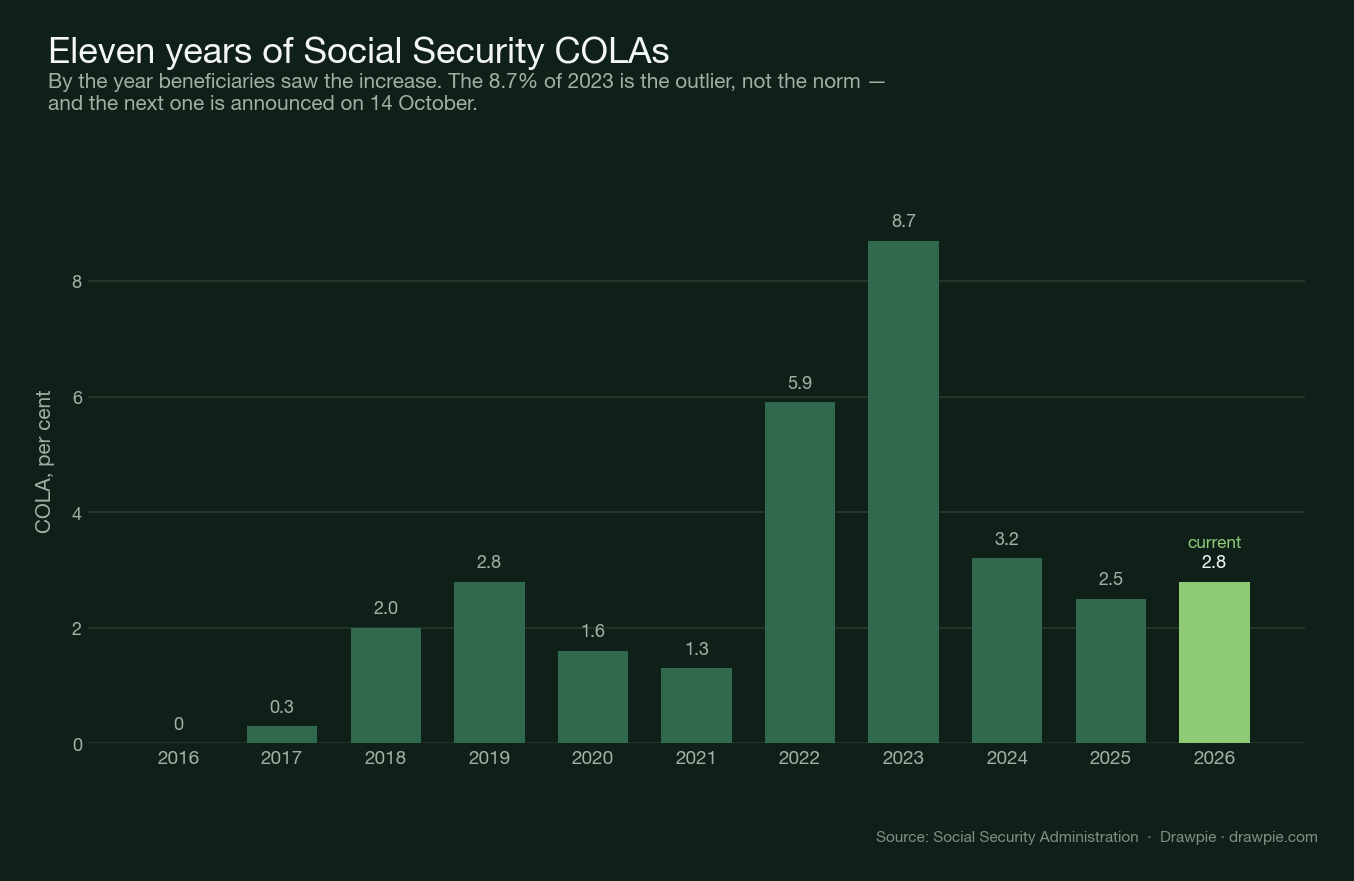
Note the 2016 bar. It is zero, and that is not a rendering error — the statute says in as many words that if there is no increase, or the rounded increase is zero, there is no COLA that year. In the fifty years of adjustments since 1975 it has happened exactly three times, and all three are recent: the increases for 2010, 2011 and 2016 were all zero. An adjustment is not guaranteed; it is the output of a subtraction that can come out flat.
The ten adjustments from 2017 to 2026 average about 3.1%. The distribution behind that average is lopsided, though: the 2010–2019 adjustments average about 1.4%, against about 3.7% across 2020–2026. The quiet decade and the noisy one are different regimes, and the average sits between two things that rarely happen.
When would a 2027 COLA actually reach you?
Not in October. The announcement is just the number.
It is a number with a wide reach: SSA put last year’s increase at 75 million Americans, covering nearly 71 million Social Security beneficiaries and about 7.5 million people receiving SSI.
The increase applies to benefits for December 2026, which are paid in January 2027 — that is why SSA’s actuarial tables index it as the 2026 COLA while its press releases call it the increase for 2027. SSI recipients see it slightly earlier, because the January SSI payment is issued at the end of the preceding December.
SSA begins mailing notices of the new amount in early December, and account holders can read the same notice online instead. Last year the agency set a mid-November deadline for opting out of paper notices, so if you want yours digitally, that switch is worth making before the announcement rather than after.
What else changes at the same time?
Two things, both worth knowing if you are still working or on Medicare.
The taxable maximum — the ceiling on earnings subject to Social Security tax — is announced in the same release, and it moves with average wages rather than with prices. For 2026 it went to $184,500 from $176,100.
Medicare premiums are separate and land later. The 2026 standard Part B premium is $202.90. The Medicare Trustees’ 2026 report projects about $209.50 for 2027, but that is a projection, and CMS confirms the real figure in the fall. That timing matters because Part B is usually deducted straight from a Social Security payment, so the COLA and the premium together decide what actually arrives in the bank — and the second half of that sum is not known on announcement day.