U.S. Strike on Larak Island: What It Means for Oil and Gas Prices
The Strait of Hormuz flow figures come from EIA’s energy-security tables, published 12 August 2026 alongside the August Short-Term Energy Outlook. The STEO page’s own header names 9 September 2026 as the next release date. From that morning the quarterly flow numbers here are one issue behind.
Everything else on the page is unaffected; the figures below still say when they were read.

- Nothing hit on 30 August produced or shipped a barrel of oil. The strike was aimed at the ability to mine the shipping lane, which is why the thing to follow is whether the lane through Hormuz stays passable — not what Larak Island itself puts out.
- Crude has round-tripped and the pump has not. Brent rose 93.8% from its pre-war level to $138.21 on 7 April, then gave back 104% of that rise — on 2 July it was $68.53, below where it started. The US average price of regular gave back 46% of its rise and bottomed 28.6% above its pre-war level.
- The pump peaked 34 days after crude did: Brent on 7 April, the retail average on 11 May at $4.50 a gallon. At the latest published week, crude is 54% of what a gallon costs.
- The strait is not an American supply line. Of the 14.75 million barrels a day of crude and condensate that left the Strait of Hormuz in the first half of 2025, the United States took 0.43 million — 2.9%. China took 5.40 million.
- Flows through Hormuz fell 77% between the last quarter of 2025 and the second quarter of 2026, from 21.6 million barrels a day to 4.9. Traffic through Bab el-Mandeb rose 50% over the same period, which is what rerouting looks like in EIA’s own table.
- This page publishes no price forecast, ours or anyone else’s, and that is a rule rather than an omission. It sets out what has already happened and what the inputs are.
The US struck Larak Island on Sunday. It is the first American strike on Iran in over a month, and it landed in the middle of the narrowest part of the Strait of Hormuz — which is why the first question most people have is what it does to the price of a gallon.
The honest version of that answer starts with something the coverage tends to skip: nothing on Larak Island was an oil facility.
What did the US actually strike on Larak Island?
Two Iranian launchers, according to US Central Command — after IRGC forces were observed preparing to fire rockets carrying sea mines into the Strait of Hormuz.
Captain Tim Hawkins, the spokesperson for Central Command, is the named source for the two launchers. Iran’s semi-official Fars News Agency reported that residents heard an explosion near the island. The Islamic Revolutionary Guard Corps confirmed the attack, said it killed and wounded Iranian fighters and civilians without giving a toll, and vowed to punish those responsible; its spokesperson called the strike “a strategic and fatal mistake”. No independent casualty figure has been published.
The sequence around it matters more for oil than the island does. Central Command finished clearing sea mines from the strait’s international shipping routes the week before, and on the Tuesday before the strike President Trump said Iran had been notified that “any ship or boat placing new mines will be immediately and systematically destroyed”. Sunday’s strike is that policy being applied to a launcher rather than a boat.
So the mechanism to watch is not Larak’s production. It is whether the shipping lane through Hormuz is mineable — because the lane, not the island, is what carries a fifth of the world’s oil in a normal year.
What has this war already done to US gas prices?
The US average price of regular has gone from $2.937 a gallon to $4.085 — up 39.1% — and it peaked at $4.50 on 11 May.
Those are EIA’s own weekly retail figures: $2.937 for the week of 23 February, the last full week before the campaign began on 28 February, and $4.085 for the week of 24 August, the most recent EIA has published.
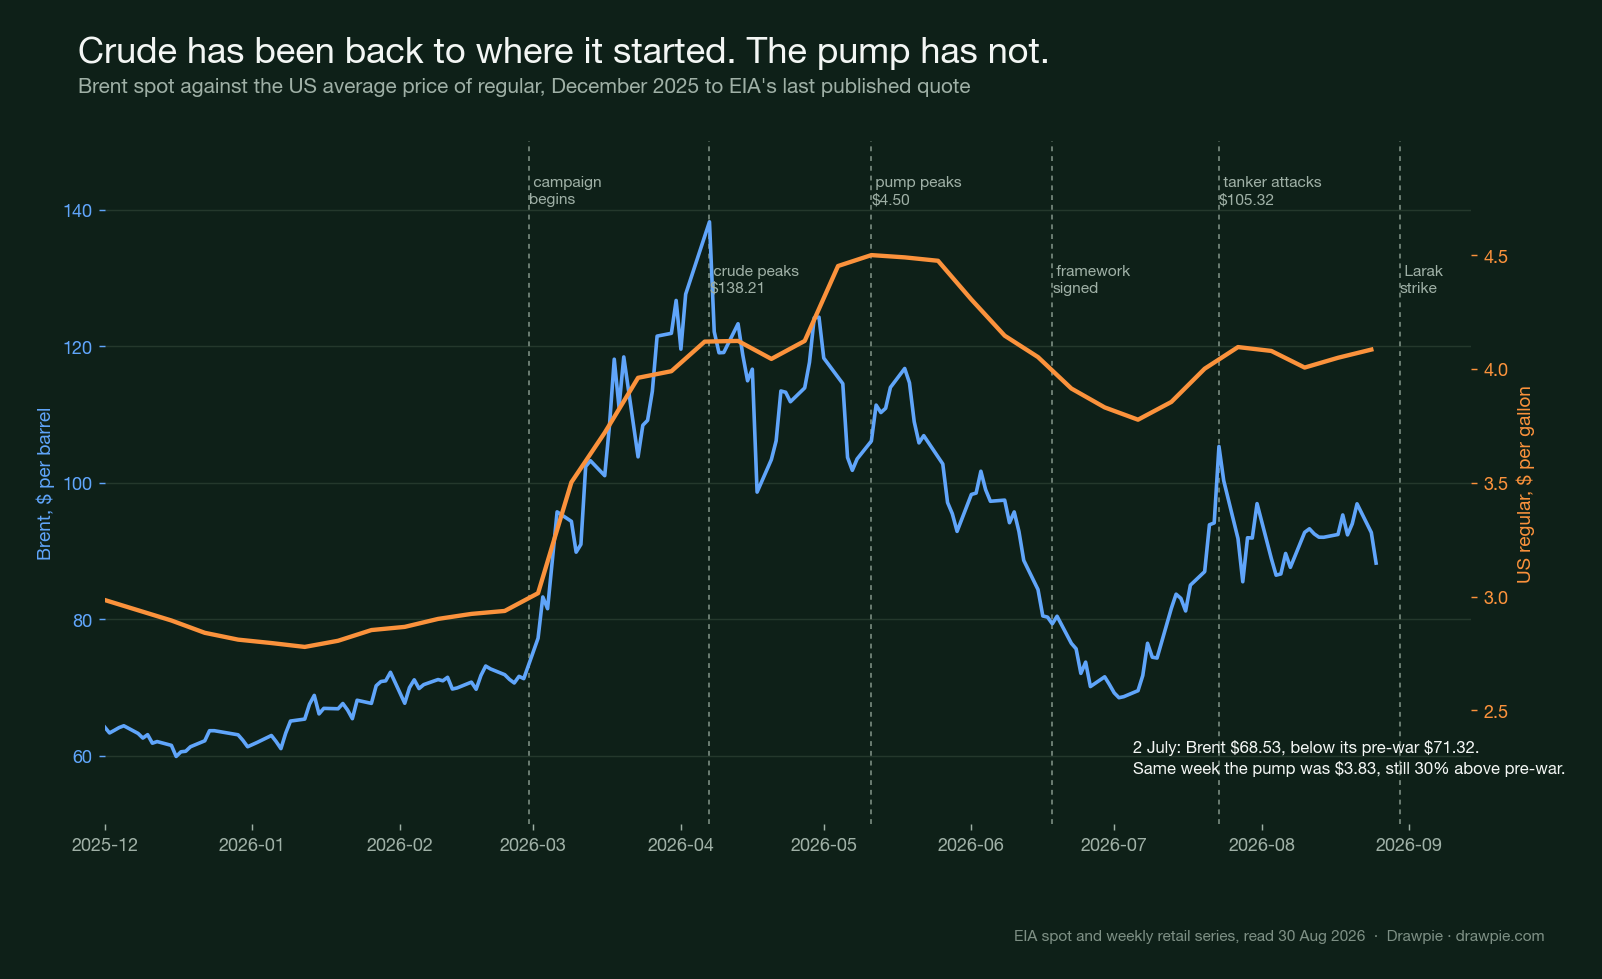
Crude did something more dramatic and less durable. Brent was $71.32 on 27 February. It reached $138.21 on 7 April, a rise of 93.8% in 39 days. EIA’s own quarterly write-up frames the first quarter in futures rather than spot and reaches the same conclusion: the front-month contract went from $61 at the start of the year to $118 at the end of March, and the increase was the largest on an inflation-adjusted basis in data going back to 1988. Brent passed $100 on 12 March. Iraq, Saudi Arabia and the UAE shut in production.
On 30 March, with retail petrol at $3.99 and diesel at $5.40, EIA recorded both as the highest in real terms in over two years.
Why hasn’t the pump come down with crude?
Because it has only given back 46% of its rise, while crude gave back 104% of its own.
This is the part of the story that does not appear in the headline numbers, and it is simple arithmetic on two published series:
| Brent | US regular | |
|---|---|---|
| Pre-war | $71.32 | $2.937 |
| Peak | $138.21 (7 Apr) | $4.50 (11 May) |
| Rise | +93.8% in 39 days | +53.2% in 77 days |
| Post-peak low | $68.53 (2 Jul) | $3.831 |
| Gave back | 104.2% of the rise | 46.3% of the rise |
| Low vs pre-war | −3.9% | +28.6% |
On 2 July, Brent was cheaper than it had been before the war started. In the same week, the pump was still 30% above its pre-war level. Crude has since gone back up, and at EIA’s latest published quote it is 23.7% above pre-war while the pump is 39.1% above.
Two things about the delay are worth separating. The first is real and measurable: the retail average peaked 34 days after crude did. The second is that the delay is shorter than folklore suggests. Correlating week-on-week changes in the retail average against week-on-week changes in crude gives 0.63 at zero lag and 0.41 at one week, then nothing much beyond two. Most of the pass-through has happened inside a fortnight.
The other half of the answer is that crude is only part of a gallon. At the week of 24 August, Brent at $92.71 a barrel works out to $2.21 of crude in a $4.085 gallon — 54%. The rest is refining, distribution, marketing and tax, and those do not move with the barrel.
Why does a strait America barely uses set the American price?
Because oil is priced globally, and the US buys almost none of what goes through Hormuz.
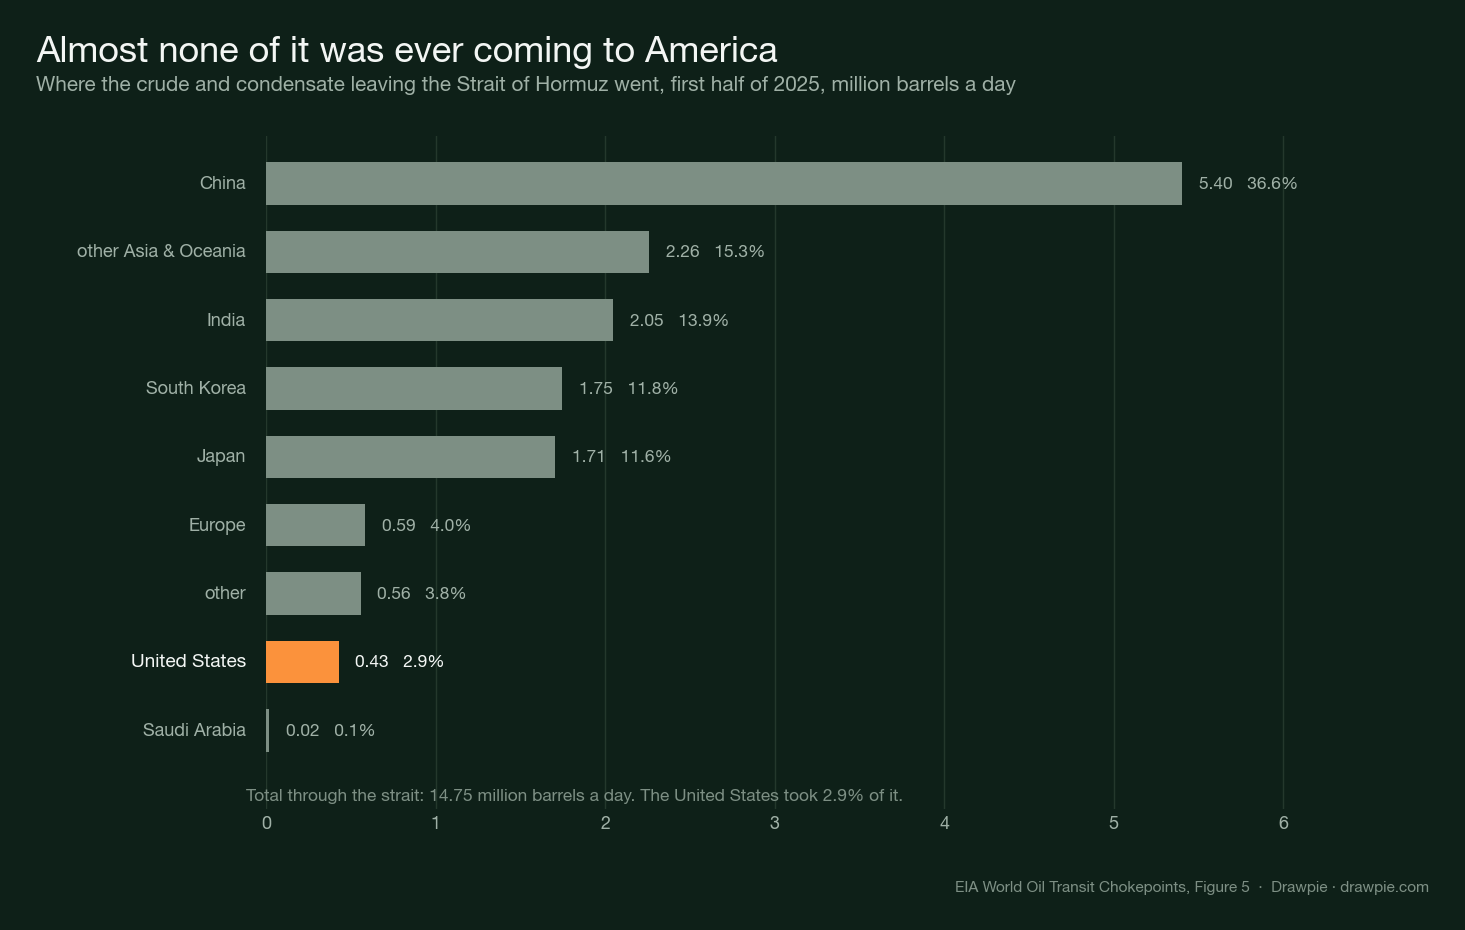
In the first half of 2025 — the most recent period EIA’s chokepoint workbook covers — 14.75 million barrels a day of crude and condensate left the strait. The United States took 0.43 million of it: 2.9%. China took 5.40 million, more than twelve times as much.
That gap is the whole answer to “why does this reach me”. A barrel that never comes near the United States still sets the price of the barrels that do, because refiners everywhere bid for the same global pool. When 14 million barrels a day stopped arriving in Asia, Asian buyers competed for cargoes that would otherwise have gone somewhere else, and the price of the marginal barrel rose everywhere at once. Physical distance from the disruption bought the United States very little.
It cuts the other way too, and this is the more useful half for a reader: because the US imports so little of it, the American exposure is to price rather than to supply. Nothing in this war has made petrol unavailable in the United States. It has made it more expensive.
How much oil is actually moving through Hormuz now?
4.9 million barrels a day in the second quarter, against 21.6 in the last quarter before the war — a fall of 77%.
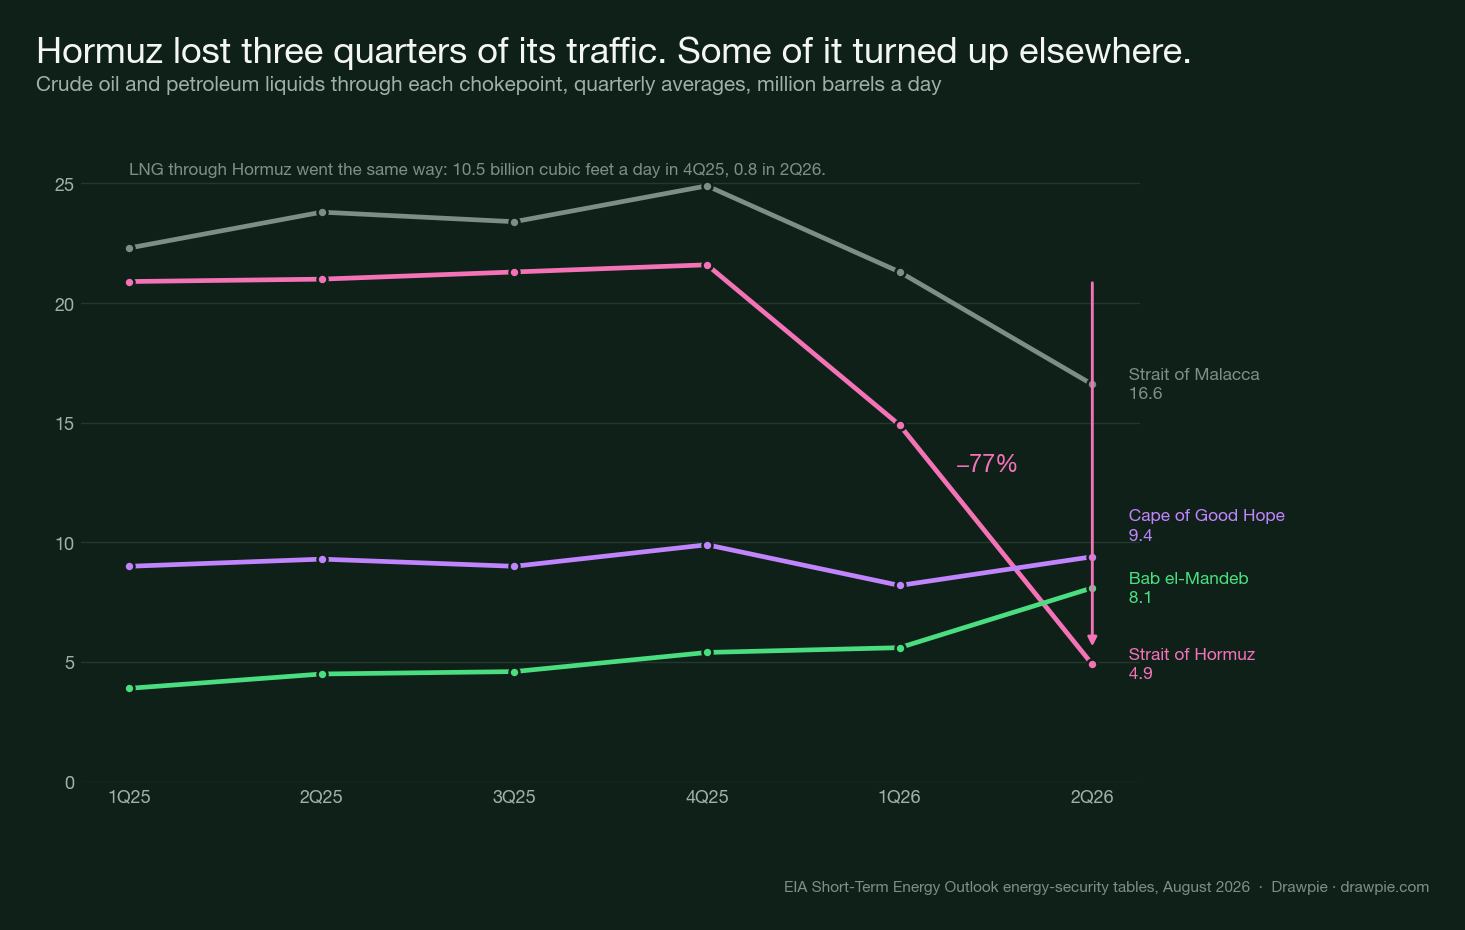
EIA began publishing these tables quarterly in May, which is itself a signal — the agency built a new dataset because a chokepoint stopped being a background fact. The breakdown for Hormuz, in million barrels a day except the last row:
| 4Q25 | 1Q26 | 2Q26 | |
|---|---|---|---|
| Total oil | 21.6 | 14.9 | 4.9 |
| Crude and condensate | 15.9 | 10.9 | 3.7 |
| Petroleum products | 5.7 | 4.0 | 1.1 |
| LNG, bcf a day | 10.5 | 7.4 | 0.8 |
For scale, EIA’s standing figure before all this was that Hormuz carried about 20 million barrels a day in 2024, roughly 20% of global petroleum liquids consumption.
The rerouting is visible in the same table. Traffic through Bab el-Mandeb went from 5.4 million barrels a day in the last quarter of 2025 to 8.1 in the second quarter of 2026 — up 50% while Hormuz collapsed. Malacca fell from 24.9 to 16.6, which is what happens downstream when the barrels that would have crossed it never left the Gulf. World total oil supply fell from 103.9 million barrels a day to 96.1 in the first quarter, recovering to 99.7 in the second.
One caution on all of these: they are quarterly averages ending in June. They describe the quarter of the deepest disruption, not this week.
What has happened to the Strategic Petroleum Reserve?
It is down 125.7 million barrels since the week before the war — a fall of 30.3%.
The SPR held 415.4 million barrels on 27 February. On 21 August, EIA’s most recent weekly figure, it held 289.7 million. Commercial crude stocks over the same period fell 2.4%, from 439.3 million barrels to 428.9 million. Almost all of the drawdown has come from the strategic stock rather than the commercial one.
EIA’s own account of the first quarter links that policy directly to the price gap between the two benchmarks. Brent rose faster than WTI because Brent is more exposed to shipping costs and to flows near the strait, while “strong U.S. inventories and plans to release crude oil from the Strategic Petroleum Reserve helped limit WTI price increases”. The spread between the two started the quarter around $4 a barrel and peaked at $25 on 31 March, averaging $11 in March — the widest in over five years.
That is the clearest single illustration of what a reserve is for. It did not stop the pump price rising. It did visibly hold the American benchmark below the global one while the strait was closed.
Will gas prices go up because of this strike?
We are not going to tell you, and the reason is a rule rather than a hedge.
Petrol and crude are traded commodities. This site does not publish forecasts of the future price of anything traded — not our own view, and not a bank’s or an agency’s with the name attached. EIA publishes exactly such numbers on the same pages the flow tables on this page came from. We read the flow tables and left the projections alone.
What can be said without crossing that line is what the inputs are, and every one of them is a quantity somebody publishes:
- Flow through the strait. EIA’s next energy-security tables land with the Short-Term Energy Outlook on 9 September, and will carry the third quarter.
- Whether the lane is mineable. Central Command says it cleared the international routes; Sunday’s strike was aimed at a launcher preparing to re-mine them. Iran maintains the strait is closed.
- The two stock numbers above, both of which EIA updates weekly on Wednesdays.
- The retail average, updated every Monday, which is the only one of these a household actually pays.
- The gap between the benchmarks, which is where the SPR shows up.
A reader who wants a number for next month will find plenty of them elsewhere. What is harder to find, and what this page is for, is the record of what the last six months actually did.
The bottom line
The strike itself was small: two launchers, on an island whose importance is its position rather than its production. What makes it worth reading about is the thing it was aimed at, which is the ability to close a waterway that carried a fifth of the world’s oil until February.
And the price story is not the one the headlines have been telling. Crude spiked further and faster than almost anything on record, then came all the way back and briefly went lower than it started. The American pump price rose less — and has stayed up. Six months in, crude is 24% above where it was before the first strike, and a gallon of regular is 39% above.
Sources
| Source | What it supports here |
|---|---|
| EIA: Europe Brent spot price, daily | Every Brent figure, the peak of $138.21 on 7 April and the $68.53 low on 2 July |
| EIA: Cushing WTI spot price, daily | The WTI figures and the benchmark comparison |
| EIA: weekly US regular retail gasoline prices | The pump price series, the $4.50 peak and every percentage move in it |
| EIA: weekly SPR and commercial crude stocks | The 125.7 million barrel drawdown and the commercial stock comparison |
| EIA: crude oil and petroleum product prices in 1Q26 | The futures framing, the 1988 record, the 12 March $100 crossing, the shut-in producers, the Brent–WTI spread and the 30 March retail figures |
| EIA: Short-Term Energy Outlook energy-security tables | Quarterly flows through Hormuz and the other chokepoints, the LNG row and world total oil supply |
| EIA: World Oil Transit Chokepoints | Where the crude leaving Hormuz goes, and the 2.9% US share |
| EIA: the Strait of Hormuz as an oil chokepoint | The pre-war baseline of about 20 million barrels a day, roughly 20% of global consumption |
| CNN: US strikes Iranian rocket launchers | Captain Tim Hawkins and Central Command on the two launchers, the mine-clearing operation and President Trump’s warning |
| Al Jazeera: US strikes Iran’s Larak Island | The IRGC response and its wording, and the competing claims about how much oil is moving |
Prices and stock levels read from EIA on 30 August 2026; each carries its own as-of date in the text. No affiliate links, and no payment was received for any link on this page.
This page describes what has already been published and does not forecast the price of crude, petrol or anything else. Prices quoted are national averages and will not match any particular station.
How we verified this
🔴 No forecast of any price appears on this page, and the omission is deliberate and complete. Crude and petrol are traded commodities, and this site does not publish predictions of their future prices — not ours, not a bank’s, and not a government agency’s. EIA’s August Short-Term Energy Outlook carries dollar-per-barrel and dollar-per-gallon projections for 2026 and 2027 on the same pages the flow tables come from. We read the flow tables and left the projections where they were. The build script that pulls this data says so in its own header, so a future edit cannot quietly reach into the price columns.
✅ Every price here is an observation with its own date attached, taken from EIA’s published series rather than from coverage of them. Brent and WTI are the daily spot series; the pump price is the weekly US regular all-formulations retail average. The comparisons — pre-war, peak, trough, latest — are computed in scripts/build_oil_larak_2026.py from those series, not transcribed from anywhere.
⚠️ EIA’s daily spot series runs a few days behind, and this page stops where it stops. On 30 August the Brent file ended at 25 August and the retail file at the week of 24 August. Quotes for later dates exist on commercial sites; we do not mix sources into one series, so every figure is stamped with the date EIA published it. The strike itself happened on a Sunday, when nothing trades.
🔴 The “crude round-tripped, the pump did not” finding is arithmetic on two EIA series, and the chart script refuses to draw if it stops being true. Brent gave back 104.2% of its rise; the retail average gave back 46.3% and its post-peak low was still 28.6% above pre-war. scripts/make_oil_larak_charts.py asserts all three before it renders.
⚠️ The pass-through lag is measured on changes, not levels, because levels give a meaningless answer. Correlating the weekly retail average against weekly crude in levels returns about 0.9 at every lag from zero to six weeks — that is the shared trend, not the transmission. On week-on-week changes the correlation is 0.63 at zero lag, 0.41 at one week and at or below 0.10 beyond two weeks. Both sets are in the committed data file.
⚠️ EIA’s own figures for the first quarter use futures, ours use spot, and the two are not the same number. EIA’s 7 April write-up says the Brent front-month contract began the year at $61 and finished the quarter at $118. The spot series this page computes from gives $126.69 on 31 March. Neither is wrong; they are different instruments, and each is labelled where it appears.
✅ The Strait of Hormuz flow figures are EIA’s, from its energy-security tables published 12 August 2026, and are quarterly averages that have already happened. The destination breakdown is from EIA’s World Oil Transit Chokepoints workbook, Figure 5, and covers the first half of 2025 — the most recent period in that product, and deliberately not presented as a current-day split.
🔴 eia.gov/todayinenergy soft-404s, so the sourcing check there is content-based. An invented article id returns HTTP 200 with a generic index page larger than the real article. Status codes prove nothing on that host; each article was confirmed by its own headline and date.
⚠️ Three different grades of attribution appear in the strike section and the text keeps them apart. One element is on the record from a named military spokesperson; one is sourced to an anonymous US official in the wire copy; and the casualties are the IRGC’s own claim, carried by Iranian state media, with no independent toll published anywhere. Where a fact is only one side’s assertion, the sentence names that side. Al Jazeera and CNN both carry 30 August 2026 timestamps and both were read in full rather than summarised.
⚠️ Every date on this page is the UTC one, and on the day of writing that mattered. The strike, the reporting of it and this page all fall on Sunday 30 August 2026 in UTC, while the desk clock had already turned over to the 31st. Dating the page to the 31st would have put it a day ahead of the wire copy it cites.
⚠️ Both sides are making claims about how much oil is moving and neither is adjudicated here. US officials say millions of barrels are transiting under military protection; Iran’s foreign minister said on 29 August that such reports are an attempt to “game energy markets”. Rather than choose, the page prints the tanker-tracking measurement EIA published and states its coverage: quarterly averages that stop at the end of June. Nobody’s characterisation of the present week is repeated as fact, including the US government’s.