Is a US Private Pension Actually Worth It? What the Data Says

- The honest answer is that it depends far less on you than the question implies. 72% of US private-sector workers are offered a retirement plan and 53% are actually in one — and the single biggest predictor of which group you land in is what your employer does, not what you decide.
- Among the lowest-paid tenth of private-sector workers, 15% are in a workplace plan. Among the highest-paid tenth, 83% are. The system works, and it works best for the people who were least likely to need it.
- The one intervention with a measurable, enormous effect is automatic enrolment. In Vanguard’s plans, 94% of automatically enrolled workers take part, against 64% where you have to sign up yourself.
“Is a private pension worth it?” is usually asked as a question about arithmetic — contributions in, compounding, money out. In the United States the data points somewhere else entirely. For most people the answer is decided before they ever run the numbers, by whether their employer offers a plan and whether that plan signs them up automatically.
Here is what the official numbers actually show.
What is a “private pension” in the US?
Almost always a 401(k), not a pension in the traditional sense. The employer-funded pension that pays a guaranteed income for life still exists, but it has become a minority product.
In March 2025, 70% of private industry workers had access to a defined contribution plan — a 401(k) or similar, where you and sometimes your employer put money into an account that is yours and whose eventual value is not promised. Only 14% had access to a defined benefit plan, the kind that promises an income.
That split is the first thing to understand about the question. A defined benefit pension was a promise the employer had to keep. A 401(k) is an account with tax advantages attached. Asking whether it is “worth it” is really asking about three separate things: whether you can get into one, what your employer puts in, and what comes back out before you retire.
Do most American workers actually have one?
Just over half. Retirement benefits were available to 72% of private industry workers in March 2025. 53% actually participated. The take-up rate — participation among those who are offered something — was 73%.
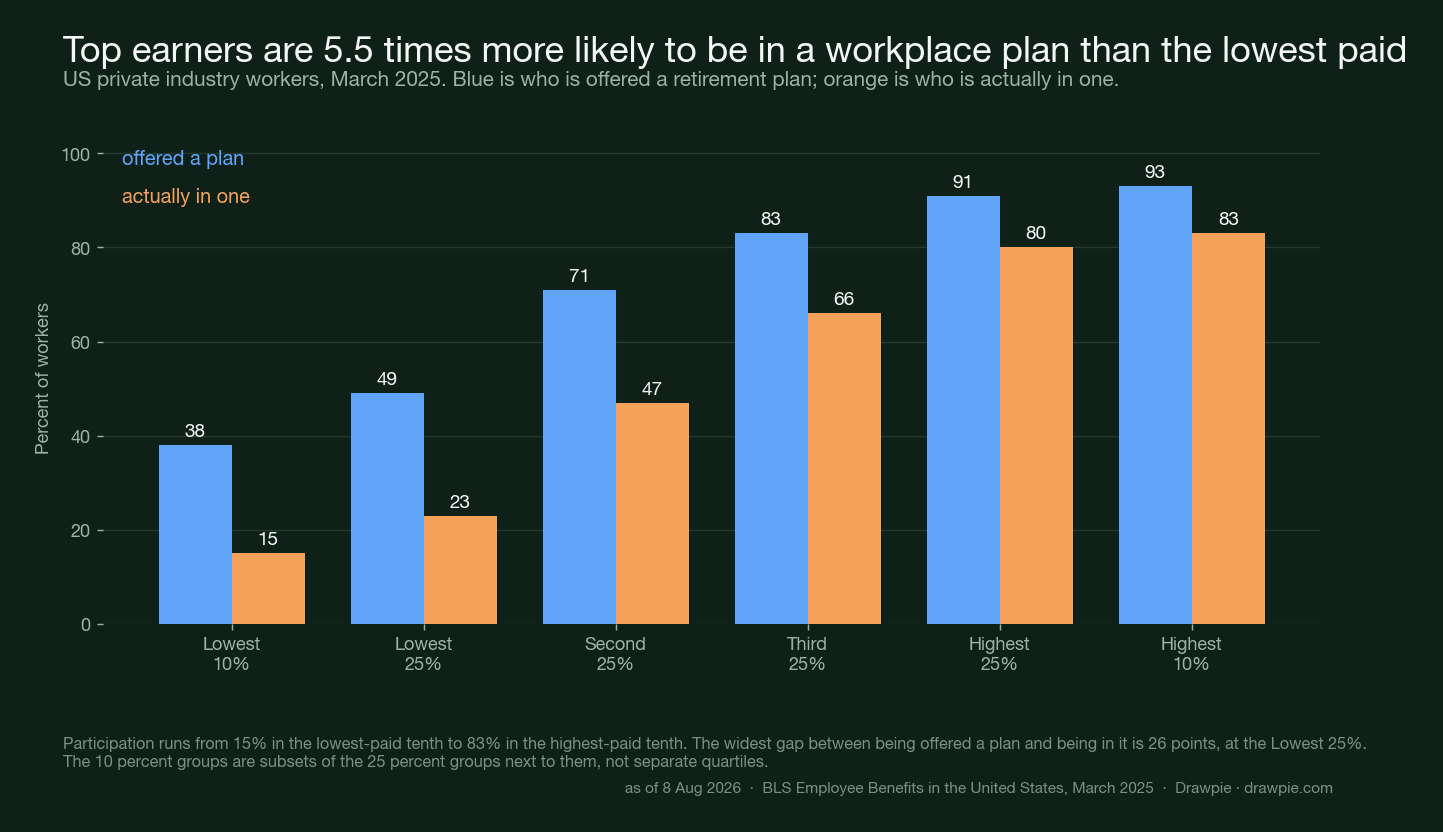
The averages hide the real story, which is that both numbers move enormously with pay.
| Pay group | Offered | In a plan |
|---|---|---|
| Lowest 10% | 38% | 15% |
| Lowest 25% | 49% | 23% |
| Second 25% | 71% | 47% |
| Third 25% | 83% | 66% |
| Highest 25% | 91% | 80% |
| Highest 10% | 93% | 83% |
Read the two ends of that table together. In the highest-paid tenth of private-sector workers, 83% are building a retirement account. In the lowest-paid tenth, 15% are — about five and a half times fewer.
The gap compounds twice over, because low-paid workers are less likely to be offered a plan and less likely to take one when it is offered. Take-up — participation among those with access — runs at 89% in the highest-paid tenth and 40% in the lowest-paid tenth.
Other splits point the same way.
| Split | Offered | In a plan |
|---|---|---|
| Full time | 81% | 62% |
| Part time | 47% | 23% |
| Union | 91% | 80% |
| Non-union | 71% | 50% |
| Service occupations | 47% | 25% |
Employer size matters as much as anything about the worker: 59% of people at establishments with fewer than 100 workers had access to retirement benefits, against 90% at establishments with 500 or more.
So the answer to “is it worth it” is partly not yours to give. Roughly a quarter of private-sector workers are not offered one, and that quarter is concentrated at the bottom of the pay distribution and in small firms.
What actually gets people to join?
Being enrolled without having to decide. This is the largest, cleanest effect in the whole subject.
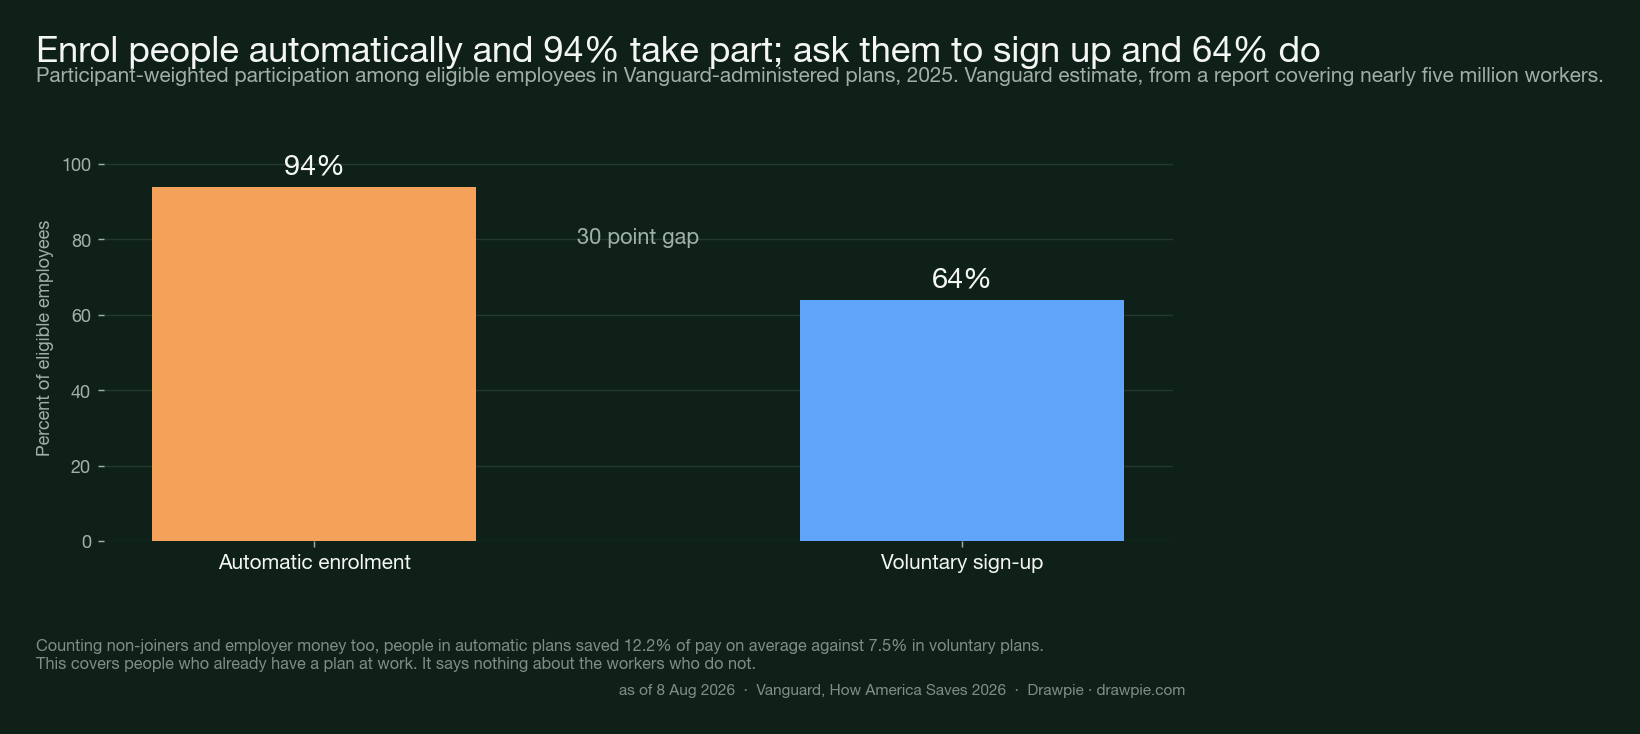
Vanguard’s How America Saves covers nearly five million workers in the plans it administers. Its 2026 edition puts it plainly: plans with automatic enrolment had a 94% participation rate, against 64% among voluntary enrolment plans. A thirty-point gap, produced by a default rather than by persuasion. Only 61% of Vanguard’s plans had adopted automatic enrolment by 2025, so this is not a settled question — it is a live gap between the plans that do it and the plans that do not.
The effect is even clearer in the measure that does not flatter anyone. Counting non-joiners as zero and including employer money, employees in automatic enrolment plans saved an average of 12.2% of pay. In voluntary enrolment plans the figure was 7.5% — a difference driven, in Vanguard’s words, by significantly lower overall participation.
Across the report’s 25-year history, Vanguard says participation rose from 65% to 86% as automatic enrolment spread. Nothing about human motivation changed over that quarter century; the paperwork changed.
The defaults have also been getting more serious, though the base matters: among the plans that use automatic enrolment, 62% now set the default at 4% of pay or higher, up from 27% in 2005, and 31% set it at 6% or more.
Two other things follow from designing the decision out. 69% of participants hold a professionally managed allocation — their whole balance in a single target-date or balanced fund, or in a managed account — rather than assembling one themselves. And they then leave it alone: 5% of participants directed a trade of their own in 2025, the lowest level in nearly two decades, even through the market volatility of that spring.
What that means for the original question: for someone with a plan at work, the outcome is mostly determined by decisions the plan sponsor already made. The gap between a good default and a bad one is far larger than the gap between a diligent saver and a lazy one.
How much actually goes in?
More than most people think, from both sides. The average total contribution rate among Vanguard participants — employee plus employer — reached 12.1% of pay in 2025 — the top of the report’s ten-year range, though level with 2024 rather than above it — and 45% of participants increased their own rate that year. On its own the employee side is smaller: an average deferral of 7.6% and a median of 6.6%.
The employer half is worth stating precisely, because it is easy to overstate. Among plans with a single- or multi-tier match formula, the average promised match was 4.7% of pay — the highest in Vanguard’s series, up from 4.2% in 2016. The median promised match was 4.0%, which is the more representative number: the average is pulled up by a minority of unusually generous formulas.
The legal ceilings for 2026 are set by the IRS.
| Limit for 2026 | Amount | 2025 |
|---|---|---|
| 401(k), 403(b), 457, TSP employee contribution | $24,500 | $23,500 |
| Catch-up, age 50 and over | $8,000 | $7,500 |
| Catch-up, ages 60 to 63 | $11,250 | $11,250 |
| IRA contribution | $7,500 | $7,000 |
| IRA catch-up, age 50 and over | $1,100 | $1,000 |
Someone aged 50 or over can therefore put $32,500 into a workplace plan in 2026, before any employer money. Very few people are anywhere near these numbers — they describe the roof, not the room. In 2025, 14% of Vanguard participants hit the employee contribution limit, then $23,500.
What comes out the other end is similarly lopsided. The average Vanguard account balance in 2025 was $167,970; the median was $44,115. When an average is nearly four times the median, it is describing a small number of large accounts rather than a typical one.
One thing worth separating out, because it is the part of the answer that does not depend on markets at all: an employer match is money that is not otherwise paid to you. Whether it is “worth” contributing enough to get the full match is a question about your employer’s compensation policy, not about investment performance. That is a different kind of question from anything involving returns, and it is the only part of this article where the arithmetic is unambiguous.
Where does the money leak out?
Out of the account before retirement, and increasingly so. 94% of Vanguard’s plans allowed hardship withdrawals in 2025, and 6% of participants with the option took one. That rate has tripled in five years: 2% in 2020, then 2%, 3%, 4%, 5%, 6%.
The size is not the alarming part. The median hardship withdrawal was $1,900, and Vanguard’s own assessment is that one or two such withdrawals across a 30- to 40-year career are unlikely to affect retirement readiness. The frequency is the alarming part: 46% of the people who took a hardship withdrawal in 2025 took more than one that year, and 21% took three or more. Vanguard’s phrase for this is that they are essentially using their retirement plans as emergency savings.
And here is the connection that makes this more than a footnote. Vanguard’s own explanation for the rise is that automatic enrolment is bringing more workers into the system, especially lower-income workers — so an increase in hardship withdrawals is, in its words, not surprising. The intervention that fixes participation is the same one that brings in people most likely to need the money before retirement. Both things are consequences of the system working better, and only one of them looks like success.
There is a second, quieter leak, which is the one the BLS numbers describe: 27% of private-sector workers with a plan available to them are not in it. Some of that is people who cannot spare the money. Some of it is a sign-up form nobody filled in.
So is a US private pension actually worth it?
As a system, it demonstrably works for the people it reaches — and it reaches roughly half of private-sector workers, weighted heavily towards the top.
Three things are true at once and it is worth holding all three.
It works. Participation across Vanguard’s plans is at a record 86%, the average total contribution rate is at the top of its range at 12.1% of pay, promised employer matches are at a series high of 4.7%, and most participants stayed invested through volatility rather than trading. Those are not marketing numbers; they come from a report that also documents hardship withdrawals tripling in five years.
It is unevenly distributed. 83% participation at the top of the wage distribution against 15% at the bottom is not a small gap, and it is not primarily a gap in willingness. It is a gap in what employers offer, which tracks pay and firm size. The balances say the same thing more bluntly: an average of $167,970 against a median of $44,115.
The bit that works best is the bit nobody chooses. Automatic enrolment produces a thirty-point swing in participation and a 12.2%-against-7.5% swing in what actually gets saved. Where it is used, the defaults themselves have climbed — 62% of those plans start people at 4% of pay or more, against 27% in 2005. Professionally managed allocations are now the norm, at a record 69%. The system has improved mostly by removing decisions, not by making people better at them — and it has done so in only 61% of plans so far.
What none of that tells you is what you personally should do, and this article does not attempt to. It has no forecast of what any of these accounts will be worth, and quotes nobody else’s. The question it can answer is narrower and more useful: whether the American workplace retirement system is a real benefit or a nominal one depends almost entirely on which employer you work for — and for a quarter of private-sector workers, the question does not arise at all.
If you want the equivalent picture for a different market, the UK’s best ISA rates covers a system built on individual accounts rather than employer plans.
Sources
Checked on 8 August 2026.
| Source | What it supports here |
|---|---|
| BLS — Employee Benefits in the United States, March 2025 | The 72% headline, the 70% defined contribution against 14% defined benefit split, and the establishment-size figures |
| BLS — table 1, retirement benefits access and participation | Every number in the wage table and the splits table, and the 53% participation and 73% take-up rates for private industry |
| Vanguard — How America Saves 2026 (full report) | The 94% against 64% split, the 12.2% against 7.5% saving comparison, the 4.7% and 4.0% promised match, 12.1% total contributions, the 62% and 31% default rates, the record 69% professionally managed, the 5% trading figure, the record 86% participation, balances, the 402(g) limit figure, and all hardship withdrawal data |
| Vanguard — press release, 16 June 2026 | The 65% to 86% 25-year trend — the one figure in this article that appears only in the release and not in the report |
| IRS — 401(k) limit increases to $24,500 for 2026 (IR-2025-111) | Every figure in the 2026 contribution limits table, including the age 60 to 63 catch-up |
Percentages in the charts and tables are as published by BLS and Vanguard; the five-and-a-half-times ratio between the top and bottom participation rates is our own arithmetic on the BLS figures.
How we verified this
All figures are from primary releases, not summaries. Coverage and participation come from the Bureau of Labor Statistics’ Employee Benefits in the United States release for March 2025 (USDL-25-1464) and its table 1, read directly. Plan-design, saving and withdrawal figures come from the 111-page How America Saves 2026 report itself, not from coverage of it. Contribution limits come from the IRS release IR-2025-111 and the underlying Notice 2025-67.
We went to the report because the press release was not enough. Vanguard’s 16 June 2026 press release does not contain the 94%-against-64% automatic enrolment split at all — that figure is in the report’s executive summary and figure 27. Anything sourced to a press release here has been checked against the report.
Two different participation measures, deliberately kept apart. Vanguard’s record 86% is plan-weighted — the average rate across plans. The 94% and 64% figures are participant-weighted, treating all employees as one pool; on that basis the overall rate is 83%, not 86%. The article does not present 94 and 64 as a split of 86, because they are not.
Vanguard’s 2025 figures are estimates. The report marks the 86%, 83%, 94%, 64%, 12.1% and 4.7% figures as estimated for 2025, because the data needed to compute them finally is not available until December 2026. The balance and hardship-withdrawal figures are not marked that way.
Three figures whose base is narrower than the headline version. The 62% and 31% default rates are shares of the plans that use automatic enrolment, not of all Vanguard plans — only 61% of plans use it at all. The 5% trading figure is participant-directed trading; counting advisor rebalancing in managed accounts, 11% of participants saw at least one trade. And the 4.7% match is the average promised match among plans that have a match formula. The article states each base rather than the rounder version.
A number we checked and did not use. Search results attribute an average employer match of 6.8% of pay to Vanguard’s data. The report gives an average promised match of 4.7% and a median of 4.0%. We used the figures from the source, and said which is which.
The two datasets are not interchangeable. The BLS numbers cover all private-sector workers, including those with no plan at all. The Vanguard numbers cover people already inside a Vanguard-administered plan, which is a more advantaged group by construction. Where a figure comes from one and not the other, the article says which.
Vintages differ. BLS reflects March 2025 and was published in September 2025; it is the most recent edition. Vanguard’s report reflects 2025 and was published in June 2026. IRS limits are for tax year 2026.
No forecast, no advice. This article contains no projection of investment returns, no third-party return or price target, and no recommendation about what any individual should do with their money. It reports how the system is set up and who it currently reaches.