UK Winter 2026–27 Snow Forecast: What the Record El Niño Actually Signals
Update log (1)
- — The page's premise is intact and has strengthened: NOAA still has an El Niño Advisory in force, the event is intensifying, and the Met Office's published UK signal is still 'wetter and stormier', never colder. Nothing has moved toward La Niña. Three corrections. The public long-range forecast now reaches 7 October, not the 2 October printed here. CPC now leads with the Relative ONI rather than the ONI, and RONI for June–August 2026 is +1.4 against the ONI's +1.80 — a distinction worth flagging because the two are quoted interchangeably against thresholds built for one of them. And the page's 'no official product covers this winter until end of November' framing needed qualifying: a live Met Office three-month Outlook issued 1 September already exists, covering September to November and naming El Niño as a driver, and the 28 September issue brings October–December into the official record.
Brought forward from 30 November on 9 September. The Met Office prints 28 September 2026 as the next issue of its three-month Outlook, and that one covers October to December — so a third of winter enters the official record then, not at the end of November as this page originally implied. The full December–February Outlook still arrives at the end of November, which is when the page’s central claim stops being true and the actual probabilities need adding. Nearer still: CPC’s ENSO diagnostic discussion on 10 September supersedes the +1.80 ONI headline.
Everything else on the page is unaffected; the figures below still say when they were read.

- Nobody is forecasting UK snow for this winter, including the Met Office. Its public long-range forecast currently runs only to 7 October and does not contain the word snow.
- The Pacific signal is genuinely extraordinary. The Oceanic Niño Index reached +1.80 °C for June–August 2026, the warmest reading for that season in 77 years of the record.
- The Met Office’s own statement of what that means for Britain is wetter and stormier through autumn and early winter. It does not say colder, and it does not mention snow.
- The historical record does not support a cold-UK signal either. Across nine strong El Niño winters since 1950, detrended UK winter temperature averaged +0.22 °C against the trend, with a spread of 1.17 °C — a null result.
- The two extremes point opposite ways. The coldest of those nine was 2009-10, Britain’s big freeze, at 2.57 °C below trend. The mildest followed the strongest event of the lot, 2015-16.
- There is a real physical route to a cold British winter under El Niño, but it runs through a sudden stratospheric warming in late winter — and nobody can forecast one in September.
- When the probabilities do arrive, read them against 20/60/20, not 33/33/33. That is the Met Office’s own published baseline, so a 40% cold signal is double the odds, not a shade above a third.
Nobody is forecasting UK snow for winter 2026–27 — including the Met Office. Its public long-range forecast currently runs to 7 October, and the word snow does not appear in it.
⚠️ One qualification this page owed you. It is not true that no official seasonal product exists. The Met Office has a live three-month Outlook issued 1 September covering September to November, and it names El Niño among its drivers. What it does not do is reach winter. The first Outlook covering December to February arrives at the end of November — but the next issue is 28 September, and that one covers October to December, so a third of winter enters the official record a full two months before this page originally implied.
That is not evasion. It is what the science supports in early September. What can be said is that the Pacific is doing something genuinely extraordinary, that the Met Office has stated what it expects that to mean for Britain, and that the historical record has a clear answer about strong El Niño winters here. None of those three things is the one the headlines are running.
What is actually known today
| El Niño strength | +1.80 °C (ONI, June–August 2026) — warmest such season in 77 years |
| Met Office signal for the UK | Wetter and stormier, autumn into early winter |
| Met Office signal for UK cold or snow | None issued |
| Public long-range forecast reaches | 7 October 2026 |
| First outlook covering Dec–Feb | End of November 2026 |
The Pacific signal is real, and it is a record
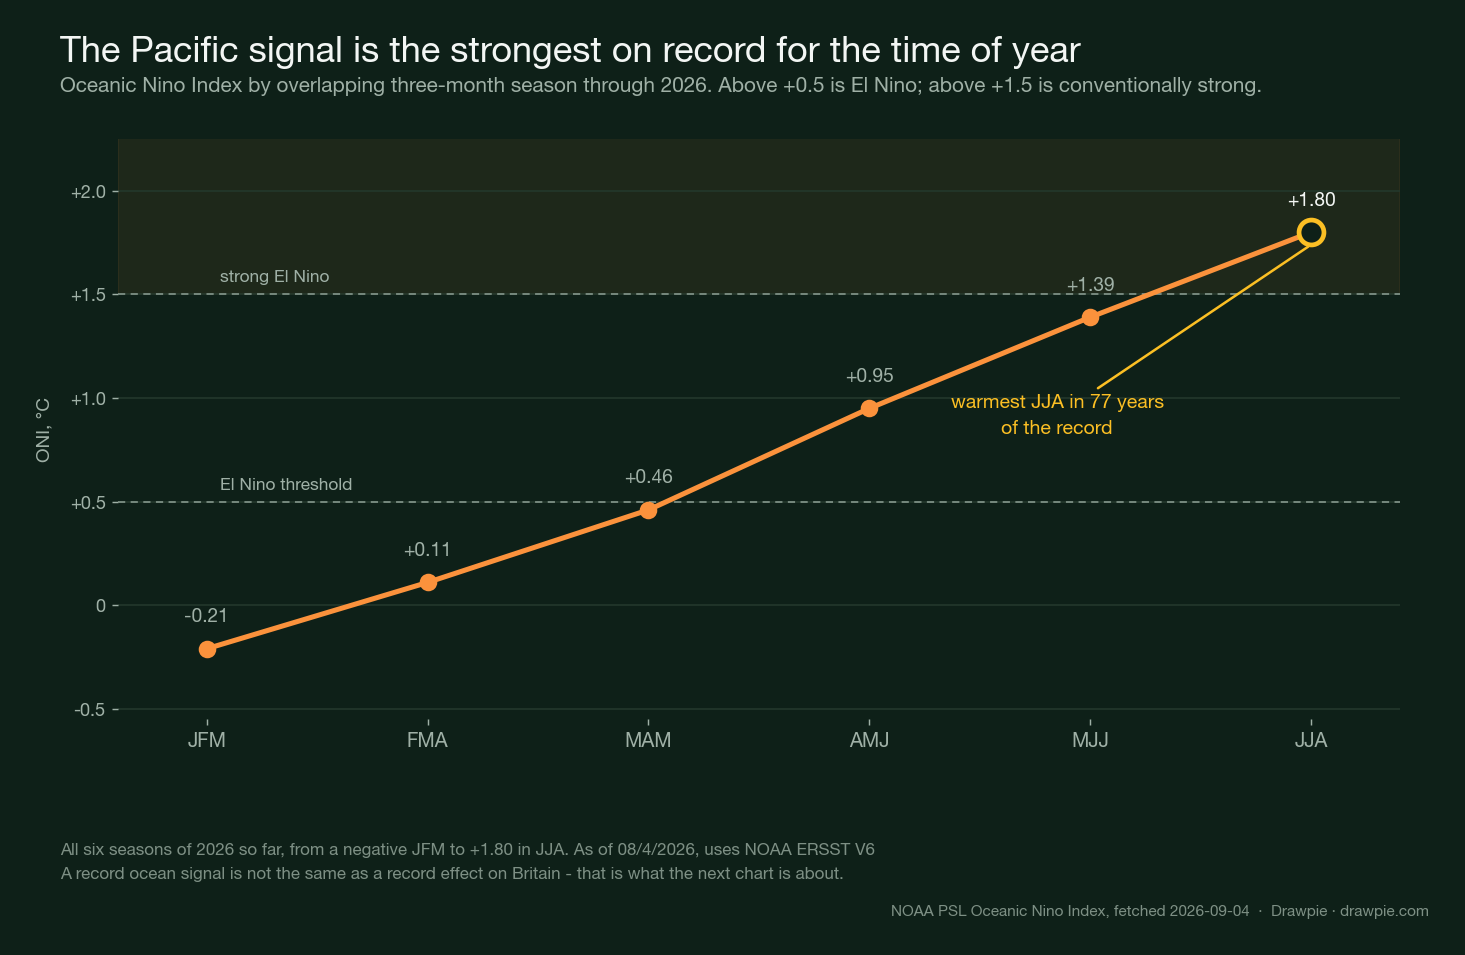
The Oceanic Niño Index has climbed through every season of 2026: −0.21 in January–March, then +0.11, +0.46, +0.95, +1.39, and +1.80 for June–August.
⚠️ Note which index you are reading, because CPC has changed which one it leads with. It now foregrounds the Relative Oceanic Niño Index (RONI), which for June–August 2026 is +1.4 — not the +1.80 above. RONI adjusts for warming across the wider tropics, so it usually reads lower than ONI in a warming ocean. Neither is wrong; a headline quoting one against a threshold built for the other is.
That last figure is the warmest June–August in the 77 years of the index. The Met Office’s own description of the event, published on 21 August, calls it unprecedented, with forecast sea-surface temperatures in the Niño 3.4 region exceeding 3 °C against a typical strong event’s 1–2 °C. Professor Adam Scaife, who leads the Met Office’s long-range prediction work, said he had never seen a signal this intense in their forecasts.
So the premise is sound. This is a record ocean state. The question is what it does to Britain — and that is where the story diverges from the headlines.
What the Met Office actually says it means for Britain
Wetter and stormier. Not colder.
The Met Office’s statement is that El Niño increases the chances of wetter, stormier conditions for north-west Europe, including the UK, through the coming autumn and early winter.
Read that again, because of what it does not say. It makes no claim about UK winter temperature, no claim about cold spells, and no mention of snow. A page telling you a record El Niño means a cold, snowy British winter is not extending the Met Office’s position. It is contradicting it.
What nine past strong El Niño winters actually did
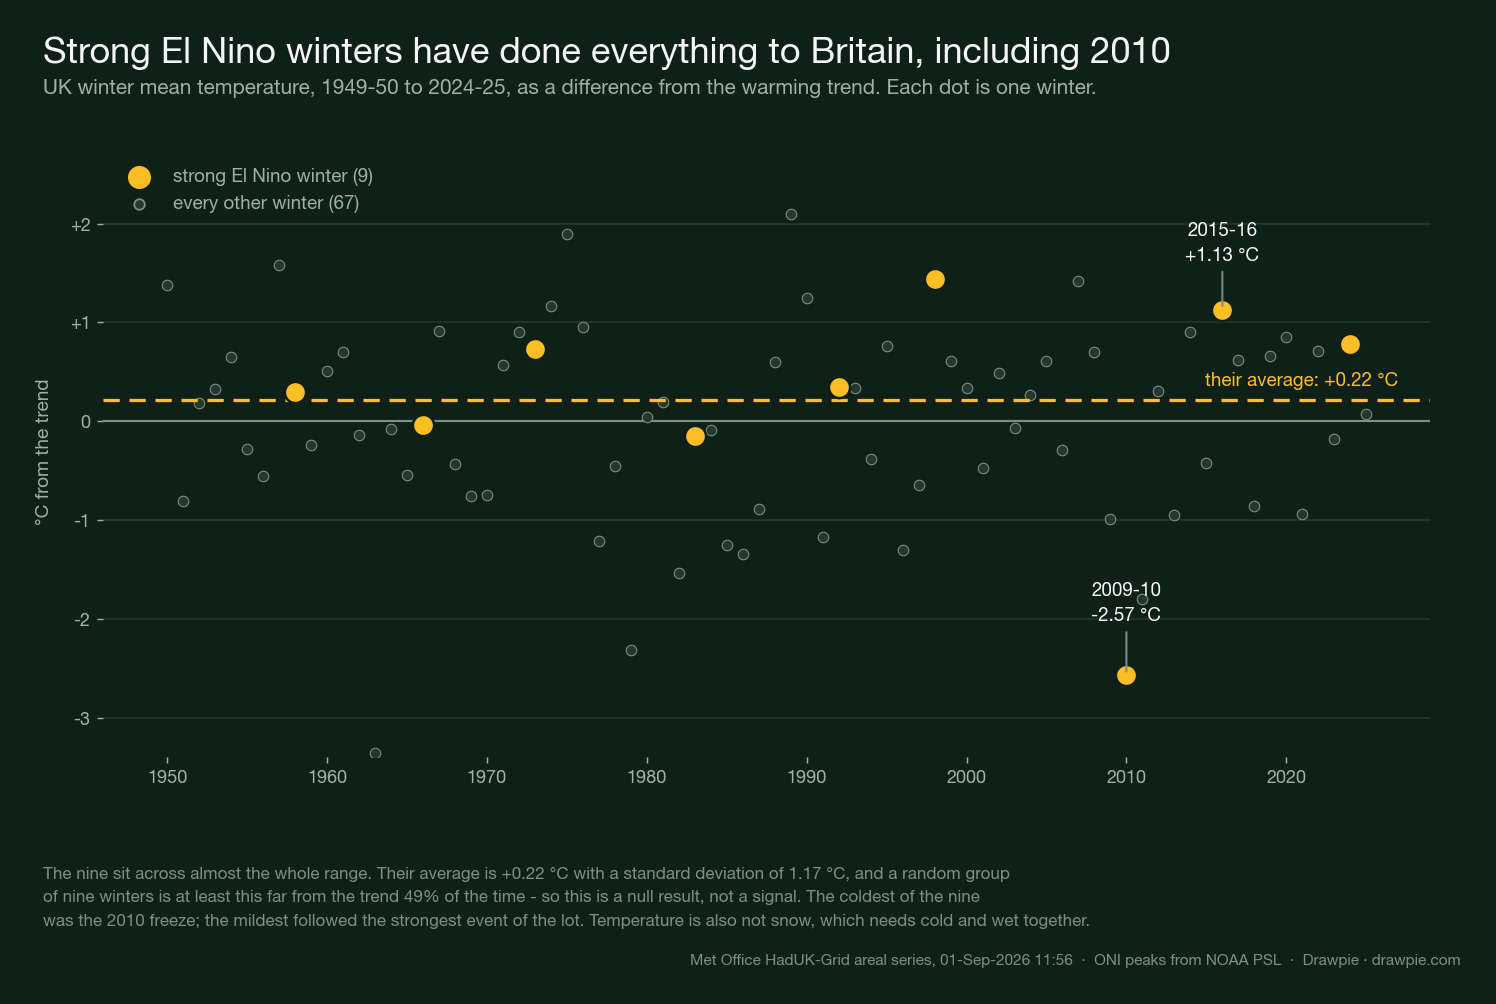
This is the part that can be checked rather than asserted, so we checked it.
Taking the Met Office’s own HadUK-Grid series of UK winter mean temperature back to 1949-50, and the nine winters whose peak ONI reached +1.5 °C or higher, the answer is: nothing much, in every direction at once.
| Strong El Niño winters since 1949-50 | 9 |
| Their average, against the trend | +0.22 °C |
| Spread (standard deviation) | 1.17 °C |
| Warmer than trend | 6 of 9 |
| Chance a random nine would look at least this unusual | 49% |
A coin flip. Widening the net to sixteen moderate-or-stronger events makes it weaker still: +0.11 °C, p = 0.64. For Scotland alone the strong-event average is +0.02 °C — not a signal, a rounding error.
Why the detrending matters. UK winters have warmed by about 0.24 °C per decade across this record, roughly 1.8 °C in total. Strong El Niño events are not spread evenly through those 76 years. Compare them raw against the whole series and you will “discover” that El Niño warms Britain, when what you have found is the calendar. Everything above is a residual from the trend line.
The two winters that settle the argument
| Winter | ONI peak | vs trend |
|---|---|---|
| 2009-10 | +1.56 | −2.57 °C |
| 2015-16 | +2.75 | +1.13 °C |
2009-10 was Britain’s big freeze — and it happened during a strong El Niño. 2015-16 followed the strongest event in the list and was one of the mildest winters on record here.
The stronger El Niño produced the milder winter. Any rule you could write from this sample is broken by its own two most extreme members.
So how could this winter turn cold?
There is a real physical route, and it is worth understanding because it explains the timing.
El Niño alters the upward propagation of atmospheric waves into the stratosphere, which can weaken the stratospheric polar vortex — the ring of fast winds high over the Arctic. A weakened or collapsed vortex can push its influence downward, shifting North Atlantic circulation towards blocking, which is what delivers cold air to Britain from the east or north. Work led by Sarah Ineson and Adam Scaife at the Met Office set out this end-to-end mechanism, and later research has found that El Niño raises the frequency of sudden stratospheric warmings while La Niña does not.
Three things follow, and they are the whole answer to the question in the title.
It is a late-winter route. The observed European response arrives around February, not December. The Met Office’s own early-winter signal for Britain points the other way — mild, wet and stormy Atlantic weather.
It runs through an event nobody can date. A sudden stratospheric warming is forecastable perhaps a couple of weeks ahead, not months. In September there is no way to know whether one will happen this winter, let alone when.
The connection is not even stable across decades. Recent work on the ENSO-to-Europe teleconnection finds it varies on multidecadal timescales, which is another reason not to build a winter plan on it.
How to read the outlook when it arrives
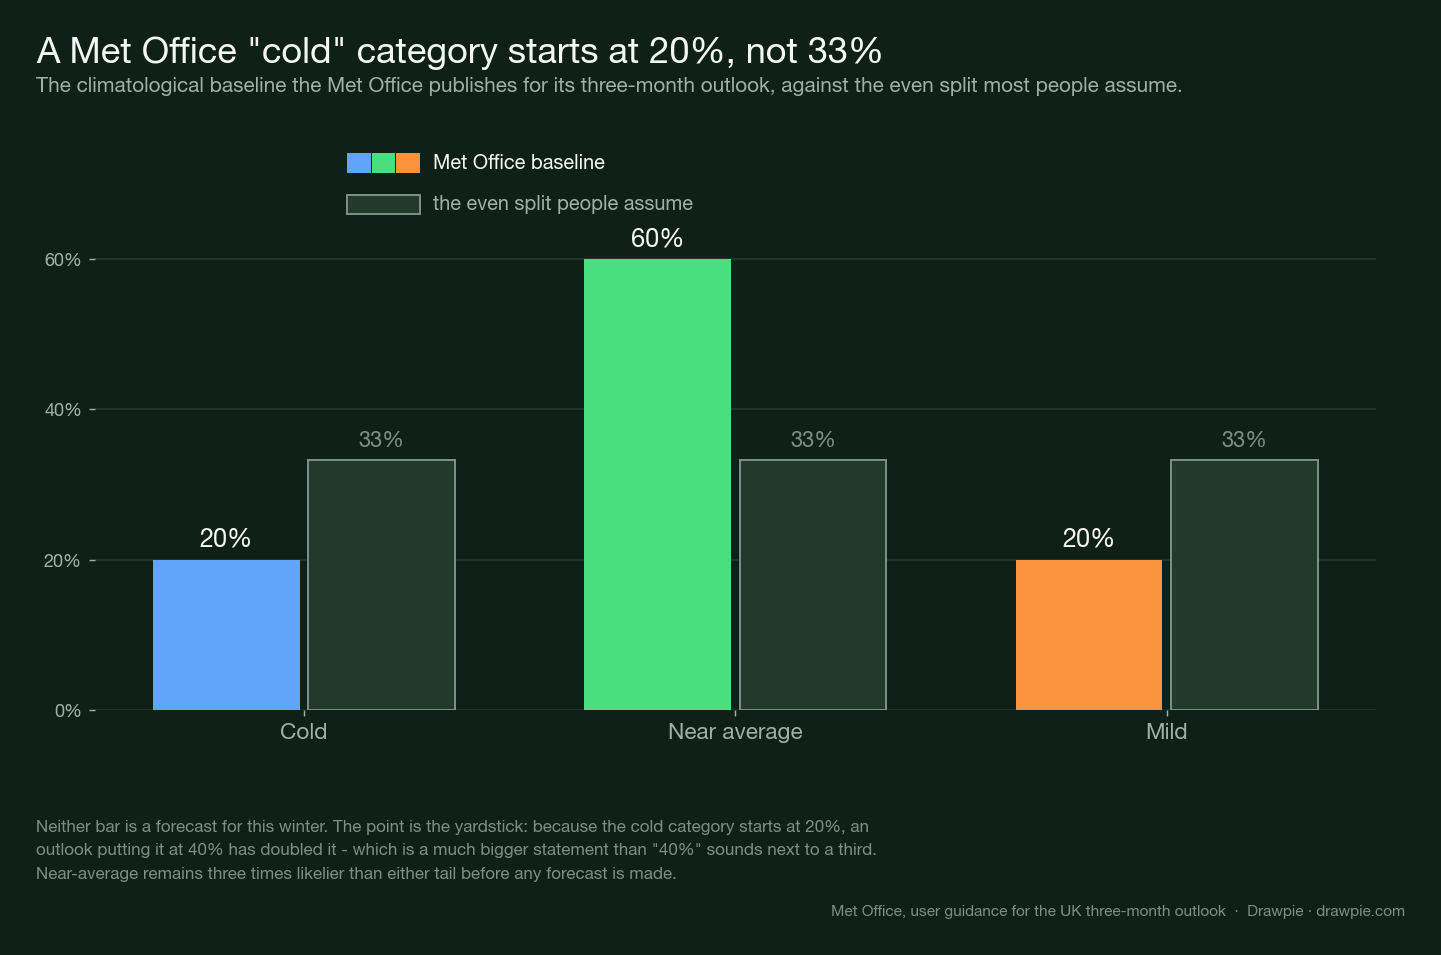
This is the most useful thing on this page, and it is the thing most coverage gets wrong.
The Met Office’s three-month outlook sorts each variable into three categories — for temperature, cold, near average, mild. Most people reading a percentage assume the neutral baseline is a third each. It is not. The Met Office’s own user guidance states that the near-average category has a normal likelihood of 60%, and the other two 20% each.
That changes what a headline number means:
- A 40% chance of a cold winter is double the baseline — a strong statement, not a mild one.
- A 33% chance of a cold winter is already well above normal.
- Near average is three times likelier than either tail before any forecast is made.
Two more things the guidance says, which matter as much:
It is a country-wide average, not your town. The outlook covers average temperature, total rainfall and average wind speed across the whole UK. It explicitly does not indicate conditions for particular locations or days.
It should not be used in isolation. It is built for contingency planners deciding how much grit and how many staff to have ready — not for deciding whether to book a skiing weekend.
Does El Niño mean a cold winter in the UK?
On the evidence, no — and the Met Office has not said it does.
Its published expectation for Britain under this El Niño is wetter and stormier conditions in autumn and early winter, which is the mild Atlantic pattern rather than the cold blocked one. The historical record agrees: across nine strong El Niño winters since 1949-50, detrended UK winter temperature averaged 0.22 °C above the trend, with a spread four times larger than that average, and a random group of nine winters would look at least as unusual about half the time.
The honest position is that El Niño is not a useful predictor of British winter temperature on its own.
When will there be an actual UK winter forecast?
The first Met Office outlook covering December to February arrives at the end of November 2026.
The three-month outlook is issued towards the end of each month and is published for contingency planners. Before then, no official product covers this winter — the public long-range forecast reaches about a month ahead, and today that means early October.
For snow specifically, useful information arrives on the timescale of days, not months. That is not a limitation of the Met Office; it is a property of the atmosphere.
Will it snow in the UK this winter?
Almost certainly somewhere, and nobody can yet tell you where, when or how much.
Snow falls somewhere in the UK in most winters, usually in the Scottish Highlands and over high ground in northern England. What varies enormously is whether it settles at low levels in populated areas, and that depends on cold air and moisture arriving together — a coincidence that depends on the position of the jet stream in a given week.
Note also that a temperature outlook is not a snow outlook. Even a winter that finishes colder than average can be dry, and a mild winter can contain a brutal snowy fortnight. That is why the Met Office’s product does not forecast snow at all.
Why do so many sites have a confident UK winter snow forecast?
Because it is a question millions of people ask and almost nobody can answer, which is a reliable formula for traffic.
Among the pages currently ranking for this search are a firewood retailer and a log merchant. That is not a criticism of their trade — it is a description of who benefits from a confident cold forecast in September, and a reason to check what any given page is actually sourcing.
The tell is specificity that outruns the science. A page that names a month, a region and a snow depth in early September is not working from the Met Office, because the Met Office does not publish that and says plainly that it cannot.
The bottom line
The El Niño is a record. Its published implication for Britain is wet and stormy, not cold. Nine past strong events left no detectable mark on UK winter temperature once the warming trend is removed, and the coldest of them was the 2010 freeze while the mildest followed the strongest event of the lot.
There is a genuine route to a cold British winter through the stratosphere, but it is a late-winter mechanism that turns on an event nobody can forecast from here.
So the useful answer in September is a date rather than a number: the end of November, when the first outlook covering this winter is published — and when it comes, read it against 20/60/20.
ONI figures fetched from NOAA PSL on 4 September 2026. UK temperatures are the Met Office HadUK-Grid areal series, last updated 1 September 2026. All composites are detrended; the analysis script and its data are in this site’s repository.