UK Energy Price Cap October 2026: How Much More You'll Pay, by Region and Payment Method

- The cap rises to £1,723 a year for a typical direct debit household from 1 October 2026, up £60 from £1,663. Ofgem announced it on 26 August.
- It went up even though VAT on electricity was cut from 5% to zero on the same day. The government’s own estimate is that the cut is worth about £45 a year, so the underlying rise was closer to £105.
- Standard credit goes to £1,861, prepayment to £1,678, and Economy 7 direct debit to £1,046.
- Wholesale costs drove it: up 11% overall, and now 47% of the cap against 44% last quarter. Ofgem names Middle East instability as the main cause, with summer heat and low wind as contributors.
- This October’s £1,723 looks lower than last October’s £1,755, but the two are measured against different assumed households and cannot be compared.
- Where you live matters most through the standing charge: £156.64 a year in London against £246.95 in Merseyside and Northern Wales, before a single unit of electricity is used.
- The cap limits unit rates and standing charges, not your bill. Use more than the assumed household and you pay more than £1,723.
The energy price cap rises to £1,723 a year on 1 October — and it does that even though the government cut VAT on electricity to zero on exactly the same day.
Ofgem published the new level on 26 August 2026. It covers 1 October to 31 December, and it is up £60 on the quarter that is ending.
Here is what it is, what it means for your household, and the two numbers that are being quoted wrongly everywhere.
The new cap in one table
| July to September 2026 | From 1 October | Change | |
|---|---|---|---|
| Direct debit | £1,663 | £1,723 | +£60 |
| Standard credit | £1,796 | £1,861 | +£65 |
| Prepayment | £1,620 | £1,678 | +£58 |
| Economy 7 (direct debit) | £1,039 | £1,046 | +£7 |
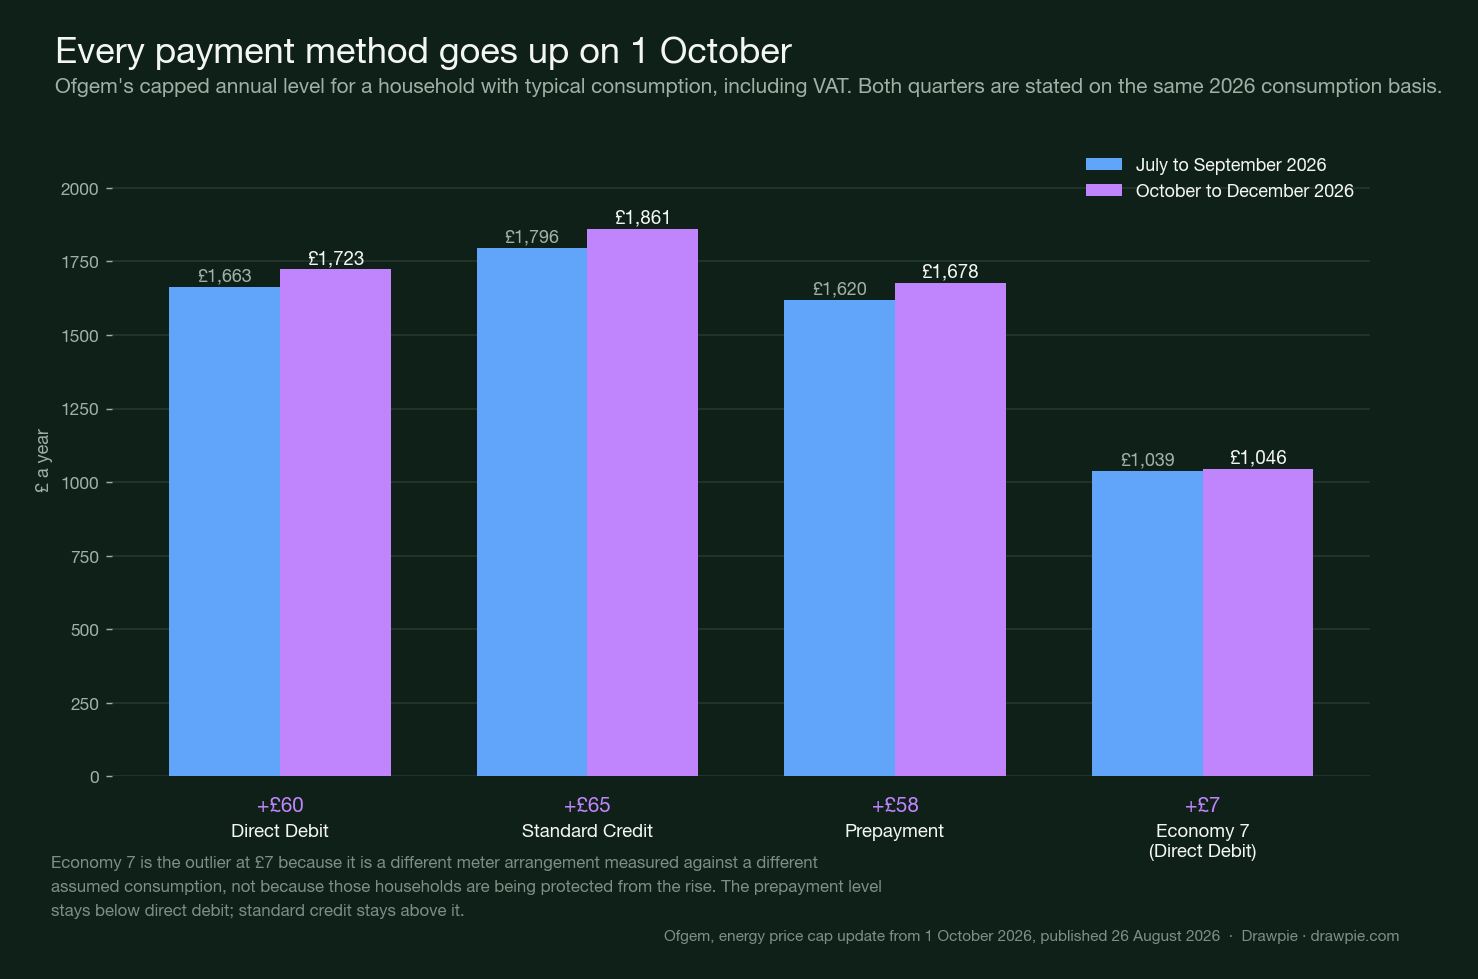
The single most important thing on this page: that is not a cap on your bill.
Ofgem caps the unit rate and the standing charge. The £1,723 is what those capped rates add up to for a household that uses a specific amount of energy — currently 2,500 kWh of electricity and 9,500 kWh of gas a year. Use more and you pay more, with no ceiling on the total. Use less and you pay less. Nobody is protected at £1,723.
VAT on electricity went to zero, and the bill still went up
This is the part that makes the October figure strange, and it is worth understanding before the rest.
From 1 October 2026 until 31 March 2027, VAT on domestic electricity is zero. Gas is unchanged at 5%. The change was announced by the Prime Minister’s Office and the Department for Energy Security and Net Zero, and Ofgem records it in the cap letter and in the cost breakdown behind the £1,723.
The government’s own numbers on it:
- It is expected to take around £45 off the annual cap in October.
- It is funded from cancelling the £1.8 billion Digital ID programme.
- The government says it comes on top of £150 taken off bills at the previous Budget.
- Suppliers are expected to pass it on to all customers, including those on fixed tariffs.
So the arithmetic runs the wrong way from the headline. The cap rose £60 with roughly £45 of tax relief already inside it. Strip that out and the underlying increase was in the region of £105.
That £105 is a subtraction using the government’s estimate rather than a figure Ofgem published, so treat it as an estimate. The direction is not in doubt: without the VAT cut, this October would have been a considerably worse morning.
Why it went up
Wholesale costs. Ofgem’s allowance for them rose 11%, and they now make up 47% of the cap against 44% in the previous quarter. Gas went up 13% and electricity 10% — and because gas sets the power price so often in Britain, the gas number pulls the electricity one along behind it.
Ofgem’s stated reasons, in its own order of importance:
| Driver | What Ofgem says |
|---|---|
| Middle East | Continued conflict and geopolitical instability, named as the primary driver of wholesale movements over the last three months |
| Heat | Extreme temperatures across much of Britain and Europe |
| LNG | The market adjusting risk factors around liquefied natural gas supply |
| Cooling demand | Higher demand for cooling, into tighter-than-normal margins caused by thermal curtailment of power plants across continental Europe |
| Low wind | Weak wind generation, increasing reliance on gas-fired power |
Three of those five are weather, which is the unintuitive part of a winter bill: a good deal of what you pay in October was set by what the summer did to the European power market. We covered the heat that sat over southern Europe this summer as a travel story at the time; this is the invoice.
Everything else in the cap barely moved. Networks came down a point to 24%, operating and debt costs held at 17%, policy costs at 6%.
What it costs where you live
Your region changes the cap, and it changes it most through the charge you pay before using anything at all.
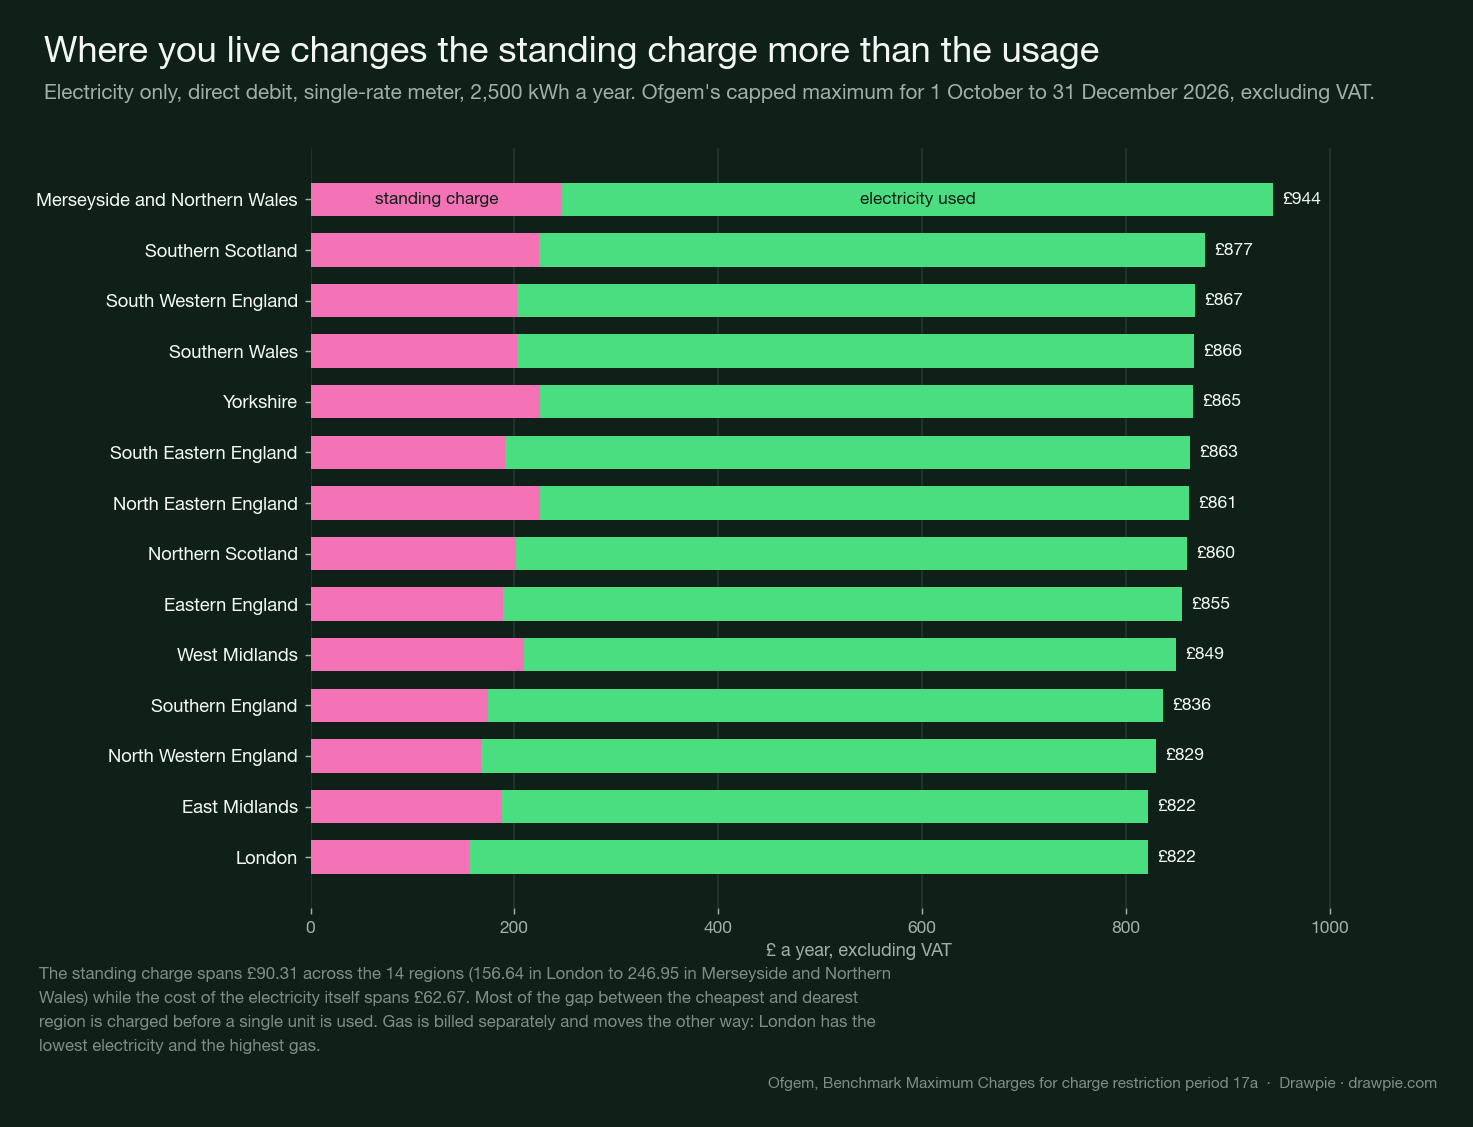
Electricity, direct debit, single-rate meter, 2,500 kWh a year — Ofgem’s capped maximum, excluding VAT:
| Region | Standing charge | Total a year |
|---|---|---|
| Merseyside and Northern Wales | £246.95 | £943.50 |
| Southern Scotland | £224.14 | £876.79 |
| South Western England | £202.87 | £867.42 |
| Southern Wales | £202.24 | £866.09 |
| Yorkshire | £225.09 | £865.16 |
| South Eastern England | £190.96 | £862.95 |
| North Eastern England | £224.78 | £861.16 |
| Northern Scotland | £201.25 | £859.91 |
| Eastern England | £189.20 | £854.53 |
| West Midlands | £208.89 | £848.97 |
| Southern England | £174.51 | £836.17 |
| North Western England | £166.72 | £828.95 |
| East Midlands | £187.80 | £821.68 |
| London | £156.64 | £821.53 |
The standing charge runs from £156.64 in London to £246.95 in Merseyside and Northern Wales — a gap of £90.31 a year, before a single unit of electricity is used. The electricity itself only varies by £62.67 across the same fourteen regions.
Gas runs the other way, and London loses. On gas, London has the highest annual cost of any region at £842.02, against £810.09 in the East Midlands. A London household on both fuels gets the cheapest electricity in the country and the dearest gas.
These figures exclude VAT because that is how Ofgem publishes them. From October the gross-up is no longer uniform — nothing on electricity, 5% on gas — so the old habit of adding 5% to a whole bill will now overstate it.
Why last year’s number isn’t comparable
Last October the cap was £1,755. This October it is £1,723. Cheaper, then?
No. Those two numbers describe different households.
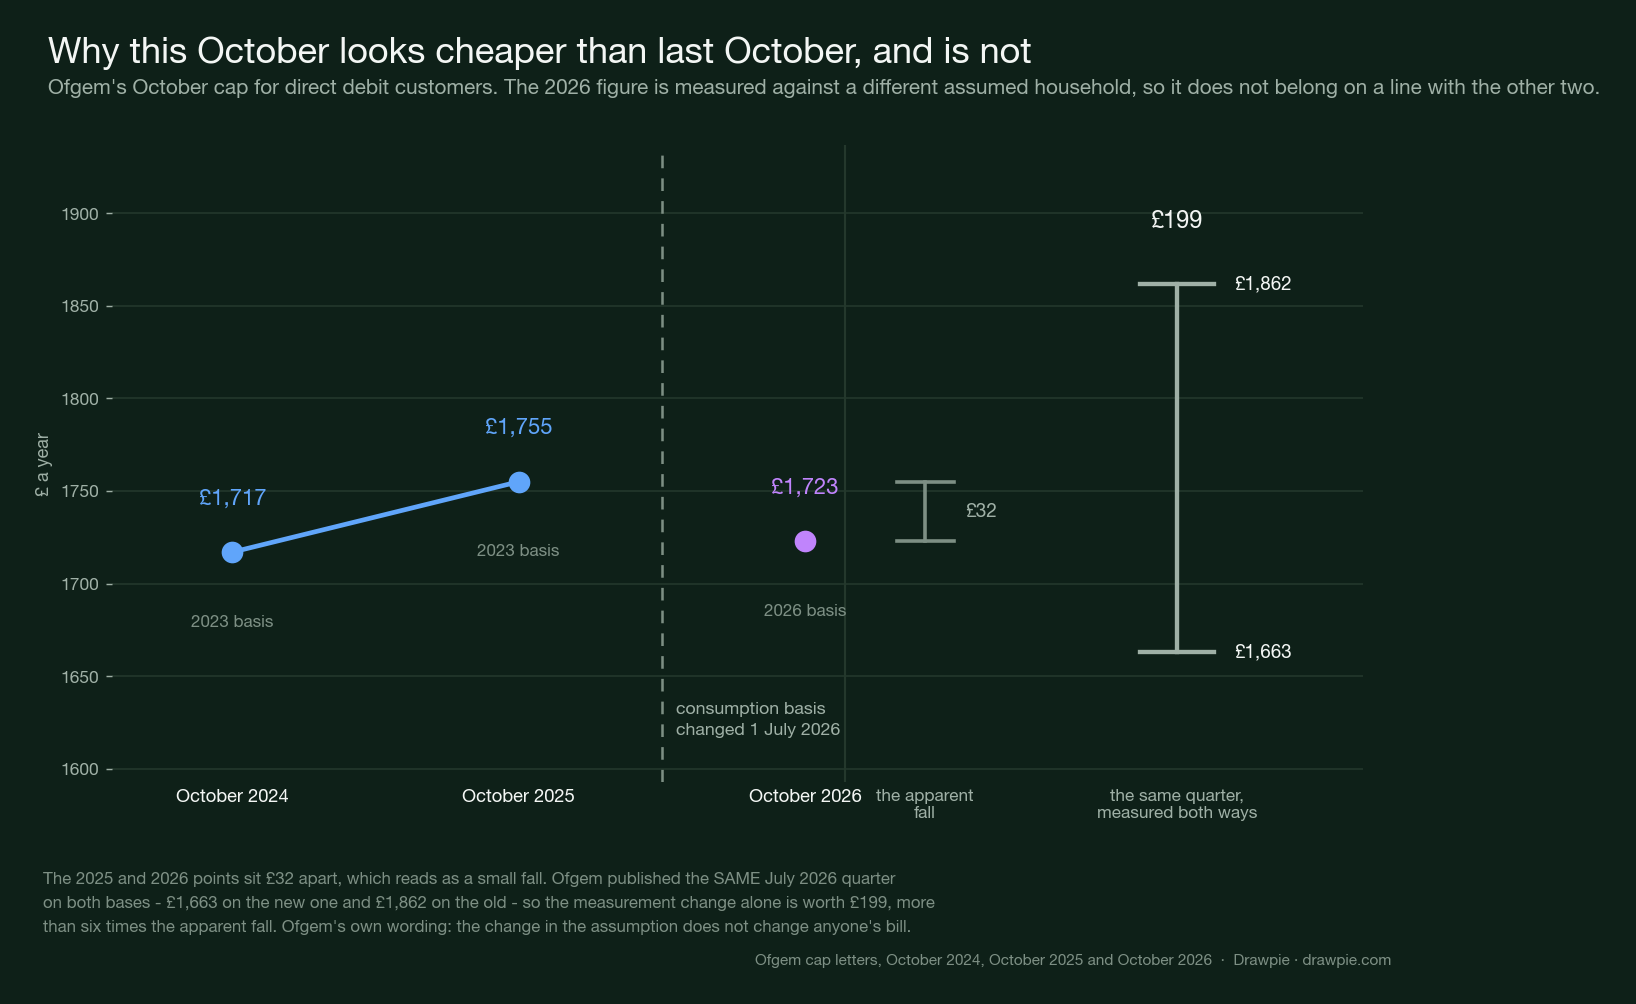
On 1 July 2026 Ofgem changed the typical consumption values used to turn capped rates into a headline figure, cutting them from 2,700 kWh of electricity and 11,500 kWh of gas to 2,500 and 9,500, on the basis that households have been using less.
Ofgem published the same July–September quarter both ways, which settles the size of the effect exactly:
| July to September 2026 | On the new basis | On the old basis |
|---|---|---|
| Direct debit | £1,663 | £1,862 |
| Standard credit | £1,796 | £2,005 |
| Prepayment | £1,620 | £1,812 |
| Economy 7 | £1,039 | £1,161 |
Identical prices. A £199 difference on direct debit, purely from the assumption.
Set that against the £32 that separates this October from last October and the comparison collapses: the measurement change is worth more than six times the apparent fall. And Ofgem is explicit about what it means for you — the change in the consumption values does not itself change anyone’s bill.
For the record, the three most recent October caps, with the basis marked:
| October cap, direct debit | Level | Change from July | Basis |
|---|---|---|---|
| 2024 | £1,717 | +£149 (10%) | 2023 |
| 2025 | £1,755 | +£35 (2%) | 2023 |
| 2026 | £1,723 | +£60 (4%) | 2026 |
Only the middle column is comparable across all three rows. The levels are not.
What actually happens to your bill
A few things worth being clear about, because the cap is widely misunderstood.
- It is not a maximum bill. It caps the rates. Your bill is those rates multiplied by what you actually use.
- It does not apply to fixed tariffs. If you are on a fix, your rates are whatever you agreed. The government has said it expects suppliers to pass the electricity VAT cut on to fixed-tariff customers as well, but the cap level itself is not your ceiling.
- Standing charges are unavoidable. They are charged whether or not you use anything, which is why a low-usage household in Merseyside can be worse off than a higher-usage one in London.
- Prepayment is below direct debit, not above it. The prepayment cap is £1,678 against £1,723, and the standing charges for the two are deliberately equalised.
- Economy 7’s small rise is not protection. It is a different meter arrangement measured against a different assumed consumption, so its headline moves differently.
When does the next one change?
Ofgem sets the cap every three months, and the level for January to March 2027 is announced in late November 2026. It takes effect on 1 January.
The electricity VAT cut is currently legislated to run to 31 March 2027, so it covers that next period too on present policy.
This page does not carry anyone’s prediction of what the January figure will be, and there is a reason for that: forecasts of the next cap circulate widely from late September onwards, they are routinely reported as though they were decisions, and Ofgem has not made one yet. The number that exists today is £1,723 from 1 October.
The bottom line
£1,723 for a typical direct debit household from 1 October, up £60 on the quarter. Standard credit £1,861, prepayment £1,678.
It rose despite VAT on electricity going to zero, which on the government’s own estimate was worth about £45 — so the underlying increase was nearer £105, driven by an 11% jump in wholesale costs that Ofgem attributes mainly to Middle East instability, with Europe’s hot, windless summer behind it.
And it is not cheaper than last October, whatever the two headline numbers look like side by side. They are measuring different houses.
Figures are Ofgem’s published cap levels for charge restriction period 17a, announced 26 August 2026. Regional tables exclude VAT; headline levels include it. This is an explainer, not financial advice — your own bill depends on what you use, where you live, how you pay and which tariff you are on.