UK Annuity Rates 2026: The Gap Between Providers Is Worth £1,356 a Year
The provider quotes on this page are dated 26 August 2026 and annuity rates are repriced regularly — a quote is normally guaranteed for a limited window only. The gilt yield behind them moves daily. Refresh both from the sources named here in early October, or retire the page; a stale annuity quote is worse than none.
Everything else on the page is unaffected; the figures below still say when they were read.

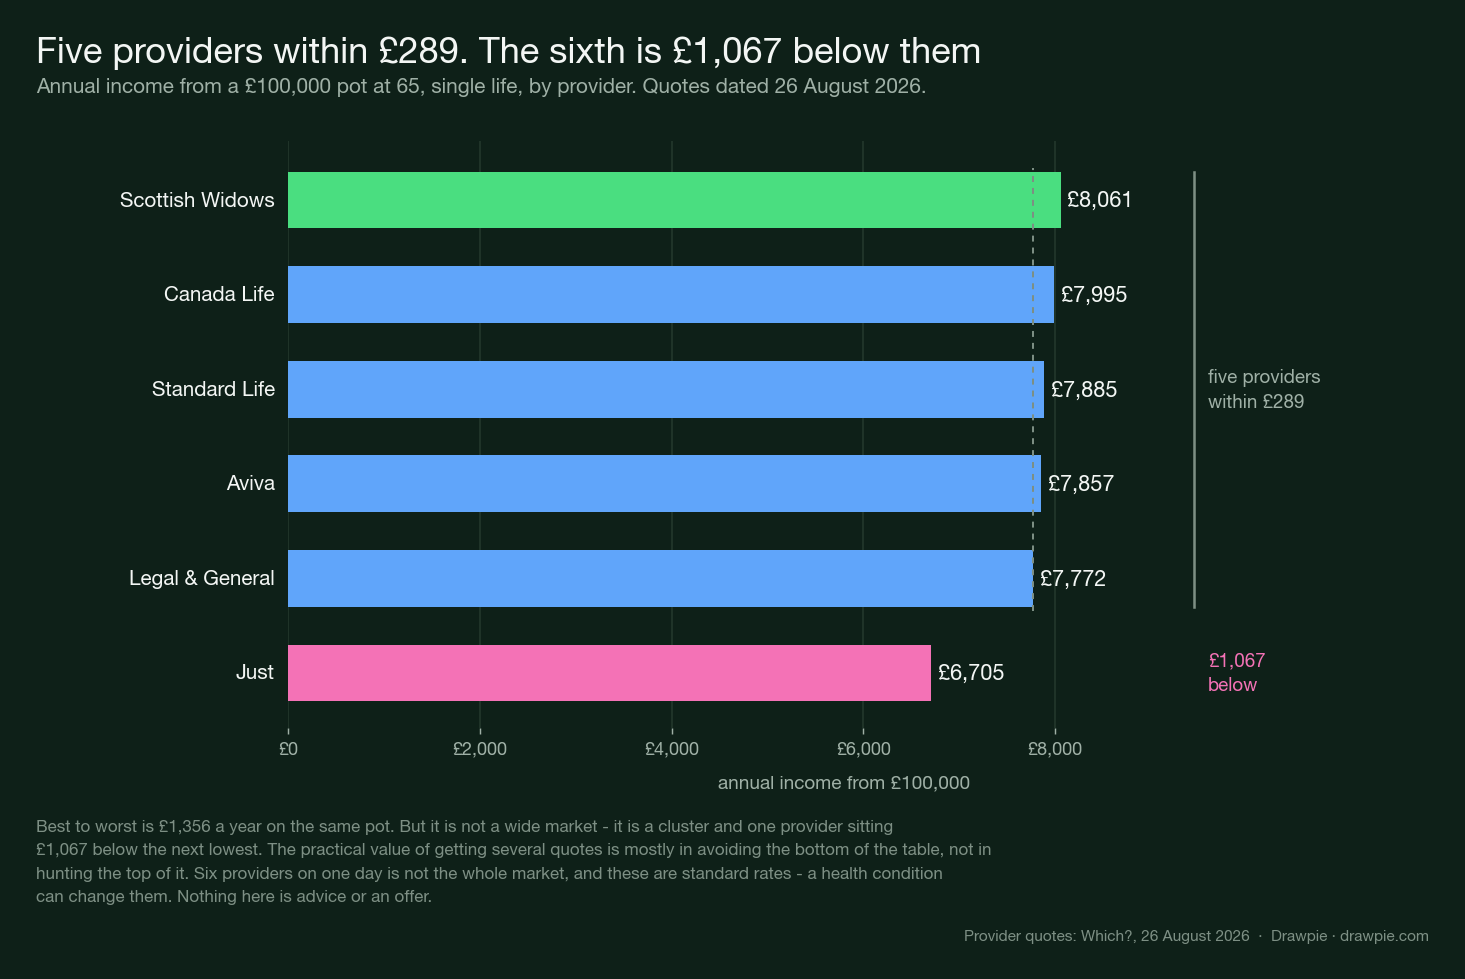
- On a £100,000 pot at 65, the best of six providers paid £8,061 a year and the worst £6,705 — a gap of £1,356 every year for life.
- But that is not a wide market. Five of the six sat within £289 of each other; the sixth was £1,067 below the next lowest. The value of shopping around is mostly in avoiding the bottom, not in hunting the top.
- The options cost more than the provider choice. Adding a 50% spouse’s pension cost £447 a year. Adding 3% annual escalation on top cost a further £2,021 — more than the entire best-to-worst provider gap.
- The reason rates are where they are is the 15-year gilt yield, which insurers price against. It closed at 5.61% on 1 September 2026.
- That is the highest in the Bank of England series used here — but that series only begins in 2000, so it is a 26-year high, not an all-time high.
- The 2021 average was 1.14%. The 2026 average so far is 5.27%. That is the whole story of why a £100,000 pot buys roughly what it buys today.
- This page is not advice and recommends nothing. Annuities are a regulated product and every quote here is a dated snapshot, not an offer.
On the same £100,000 pot, at the same age, the best provider paid £8,061 a year and the worst paid £6,705. That is £1,356 a year, for life, decided by nothing more than which company the money went to.
But the useful version of that finding is more specific, and most coverage misses it.
The gap is one provider, not a market
| Provider | Income from £100,000 at 65 |
|---|---|
| Scottish Widows | £8,061 |
| Canada Life | £7,995 |
| Standard Life | £7,885 |
| Aviva | £7,857 |
| Legal & General | £7,772 |
| Just | £6,705 |
Look at the shape rather than the range. Five of the six sit within £289 of one another. The sixth is £1,067 below the fifth.
So “annuity rates vary by up to 20% between providers” is arithmetically true and practically misleading. On this table, the work is not hunting the top — the top five are nearly interchangeable. The work is not ending up at the bottom.
That is a lower bar, and it is cleared by getting more than one quote.
What it is worth over a retirement. £1,356 a year for 20 years is £27,120 — undiscounted, and assuming a level income and that you live 20 years. It is an illustration of scale rather than a valuation, but it is the right order of magnitude for a decision most people make once and cannot undo.
The options cost more than the provider does
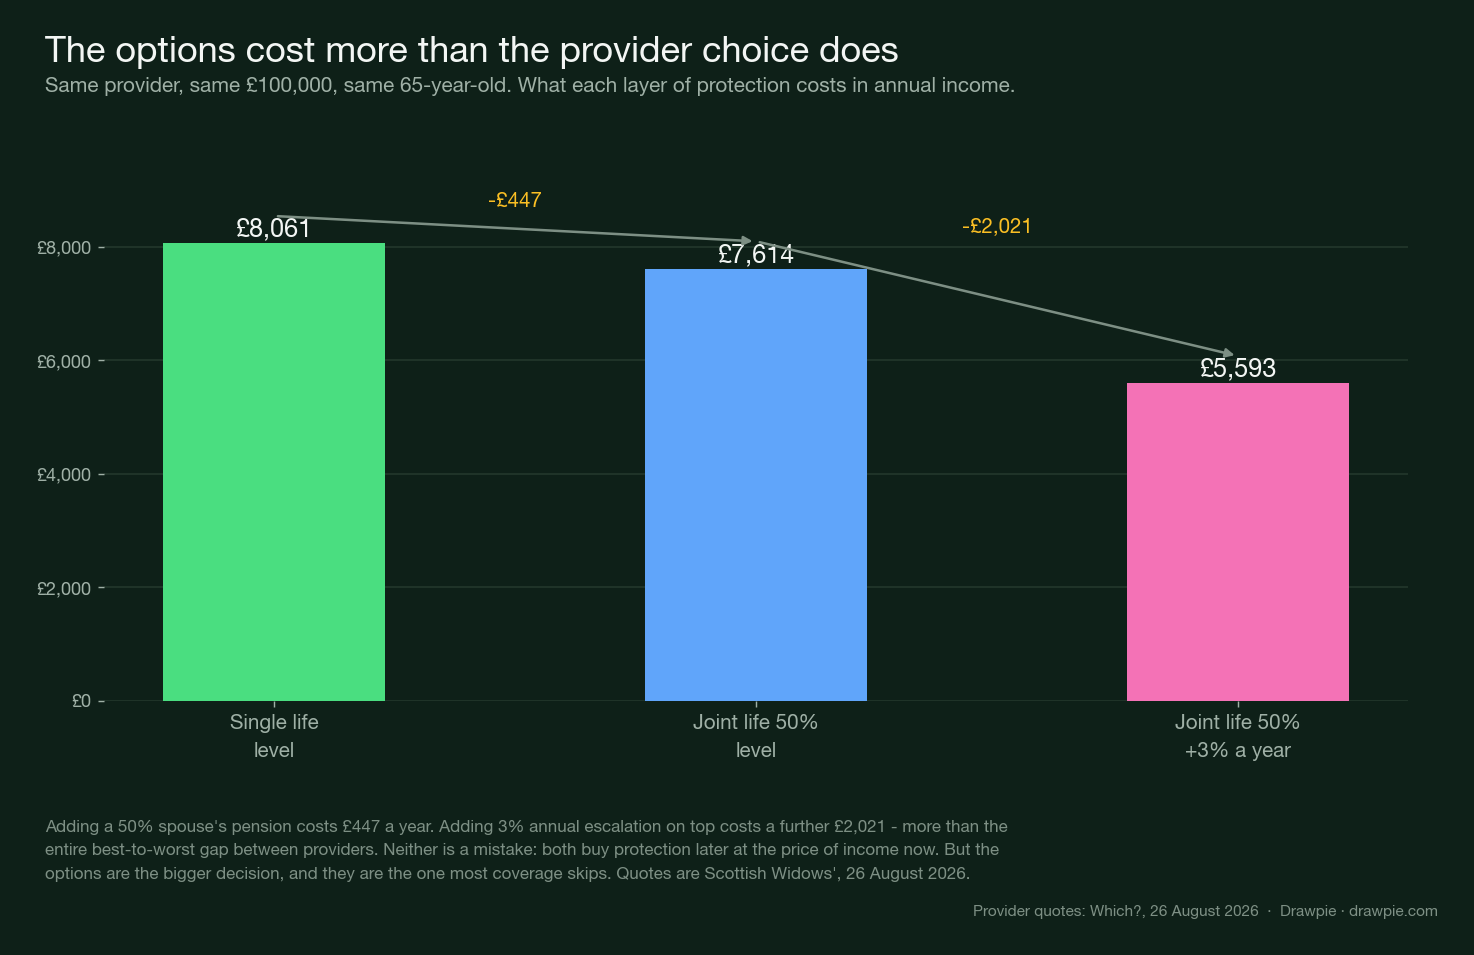
Same provider, same pot, same 65-year-old:
| Configuration | Annual income | Cost of the extra |
|---|---|---|
| Single life, level | £8,061 | — |
| Joint life 50%, level | £7,614 | −£447 |
| Joint life 50%, +3% a year | £5,593 | −£2,021 more |
Adding inflation protection cost £2,021 a year — more than the entire best-to-worst gap between providers.
Neither option is a mistake. A joint-life annuity keeps paying a spouse; escalation protects against inflation eroding a fixed income over what may be thirty years. Both buy protection later at the price of income now, and which is right depends on circumstances this page knows nothing about.
The point is only that this is the bigger of the two decisions, and it gets a fraction of the attention the provider comparison does.
Why rates are where they are
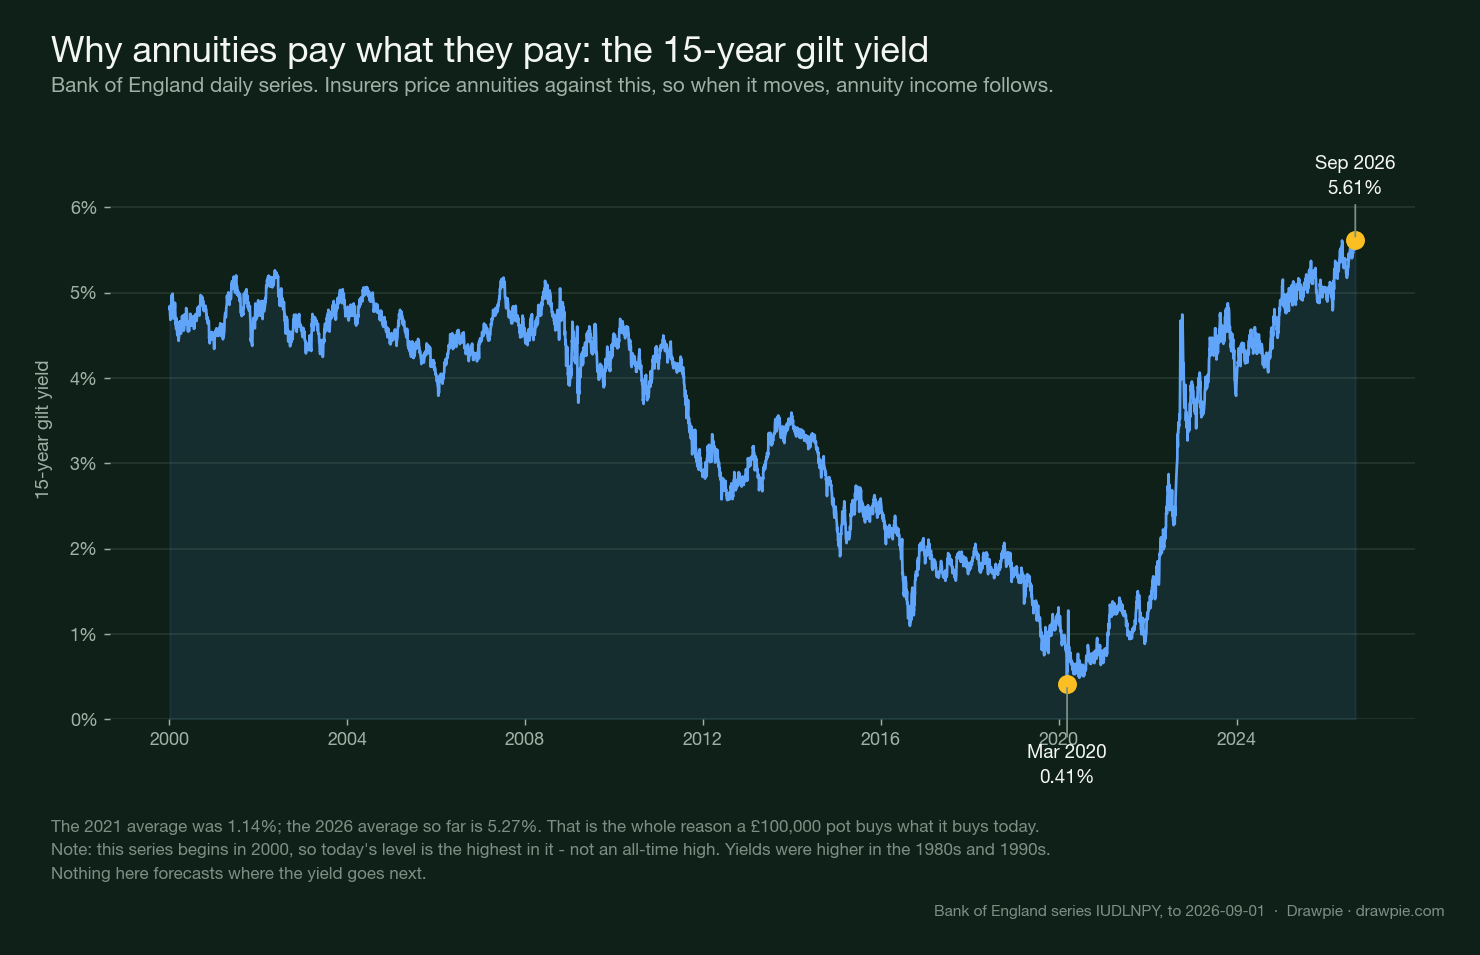
Annuity income is not set by insurers’ generosity. It is set mostly by what they can earn on gilts, because that is what backs the promise.
The benchmark is the 15-year gilt yield, and the Bank of England publishes it daily:
| Latest, 1 September 2026 | 5.61% |
| 2026 average so far | 5.27% |
| 2021 average | 1.14% |
| Series low, 9 March 2020 | 0.41% |
The 2021 average was 1.14%. It is now 5.61%. That is the entire explanation for why a £100,000 pot buys roughly £8,000 a year today when a few years ago the same pot bought around half that.
One precision that matters. Today’s level is the highest in this series — but the series begins in 2000. Gilt yields were higher in the 1980s and 1990s. Anyone telling you annuity rates are the best they have ever been is using a shorter yardstick than they think.
And the link is directional, not a formula. Higher yields let insurers offer more, but pricing also carries longevity assumptions, capital requirements, expenses and competition. You cannot read an annuity rate off that chart.
What does a £100,000 pension pot buy as an annuity?
Around £8,000 a year at 65 on the best standard rates in late August 2026, for a single-life, level annuity with no guarantee period.
Age changes it substantially, because the insurer is pricing how long it expects to pay:
| Age | Best income from £100,000 |
|---|---|
| 55 | £6,880 |
| 60 | £7,283 |
| 65 | £8,077 |
| 70 | £8,851 |
| 75 | £10,101 |
Those are best available rates across leading providers as of 27 August 2026. Waiting is not free — you forgo the income in the meantime — but the rate on offer does rise with age.
Should I shop around for an annuity?
Yes, and the reason is narrower than it is usually presented.
The table above shows five of six providers within £289 of each other and one £1,067 below. Getting several quotes is not about squeezing out a top rate that barely exists; it is about not accidentally buying from the bottom of the table. That is what the Open Market Option is for — you are not obliged to take an annuity from the company that held your pension.
Two things this page cannot tell you: whether your own provider is competitive today, and whether you qualify for an enhanced rate. A health condition or a smoking history can raise the income materially, and none of the quotes here are enhanced.
Are UK annuity rates the highest they have ever been?
Not on the evidence used here, and the claim needs a longer series than most coverage uses.
The 15-year gilt yield at 5.61% is the highest in the Bank of England series consulted for this page — but that series starts in 2000. Yields, and therefore annuity rates, were higher in the 1980s and 1990s. “Best in a generation” is defensible; “best ever” is not, at least not from this data.
Will annuity rates go up or down from here?
This page does not say, and you should be careful of any that does.
Annuity rates follow gilt yields, gilt yields follow interest rate expectations and government borrowing, and forecasting either is not something a page like this should pretend to do. What can be said is what has happened: from a 1.14% average in 2021 to 5.61% now.
If you want the current picture rather than a prediction, the Bank of England publishes the yield daily and providers republish their rates regularly. Both are named at the foot of this page.
The bottom line
The £1,356 gap between the best and worst provider is real, and it is the wrong thing to spend most of your attention on. Five of the six were within £289; the practical task is avoiding the outlier, and one extra quote does that.
The £2,021 that inflation protection costs is the bigger decision, and it is the one that gets written about least.
And the reason any of these numbers look good at all is a gilt yield that has gone from 1.14% to 5.61% since 2021 — which is a fact about the bond market, not about annuities, and not something anyone on this page can tell you about tomorrow.
Provider quotes from Which?, 26 August 2026, and best-rate figures from Hargreaves Lansdown, 27 August 2026. Gilt yields from the Bank of England Interactive Database, series IUDLNPY, to 1 September 2026. Annuity quotes expire and rates are repriced regularly. This article is information, not advice, and recommends no product or provider.