Donald Trump State Polls 2026: Approval Ratings by State & Swing-State Trends
Civiqs is a rolling daily tracker, so every level on this page drifts. The directional findings are more durable than the numbers: ‘fell in all 50’, ‘battlegrounds moved less than the median’ and the starting-position relationship are all re-checkable by re-running scripts/build_civiqs_trend.py against a fresh pull, and the chart script asserts each of them and fails the build if one stops being true. Re-read by 21 September 2026; the numbers will have moved by a point or two, and the small-state numbers by more.
Everything else on the page is unaffected; the figures below still say when they were read.

- Trump’s net approval is lower now than on inauguration day in every one of the 50 states. Not one state has gone the other way. The median fall is 18.5 points, over the 579 days from 20 January 2025 to 21 August 2026.
- He fell hardest where he was strongest. The five biggest falls are Idaho (−28.4), Wyoming (−27.8), Kentucky (−27.1), Tennessee (−26.5) and Utah (−25.4). The five smallest are New Jersey (−10.5), California (−11.4), Rhode Island (−12.2), Delaware (−12.4) and New Mexico (−12.5). The relationship is real but partial: where he started explains about 37% of how far he fell.
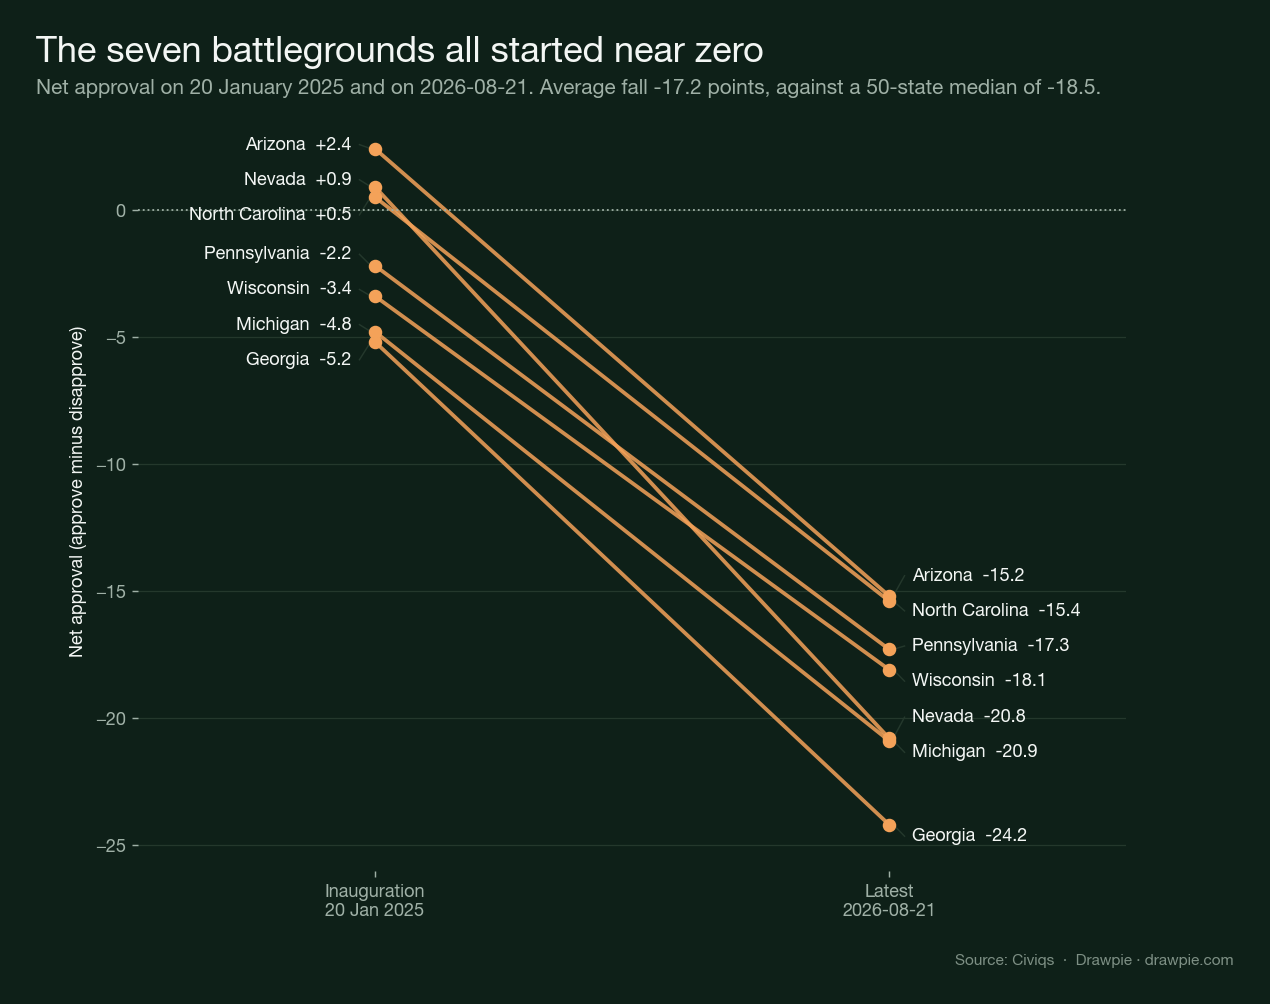
- The seven 2024 battlegrounds moved LESS than the country, not more. They fell 17.2 points on average against a 50-state median of 18.5. All seven started within about five points of zero and all seven are now between −15 and −25.
- The 50-state map is less solid than it looks, and small states are where it wobbles. Reading the same 19 August figures two days apart, North Dakota moved 4.8 points and Tennessee 4.2, while California moved 0.2 and Maryland not at all. Civiqs’ own confidence band runs from 10.3 points wide in Maryland to 19.8 in South Dakota.
- No single event broke it. Across the six moments Civiqs annotates on its own chart — the tariff announcement, two Iran episodes, the Big Beautiful Bill, the 2025 shutdown and Maduro’s capture — no segment moves the national net by more than 4.5 points, and the largest of those is also the longest. The decline is a grind, not a shock.
A poll taken today tells you where opinion is. It cannot tell you where it is going, and it certainly cannot tell you where it has been. For that you need the same question, asked the same way, in the same state, over a long stretch — and then the interesting part is not the number, it is the slope.
Two days ago we published where Trump stands in all 50 states . This is the other half: how each state got there, measured across the 579 days from inauguration to 21 August 2026.
The short version is that the direction is unanimous and the magnitude is not. He is down everywhere. He is down least in the places that already disliked him, and the seven states that decide presidential elections moved less than the country as a whole.
Has Trump’s approval fallen in every state?
Yes — all 50, with no exceptions in either direction. The median state is 18.5 points lower on net approval than it was on 20 January 2025.
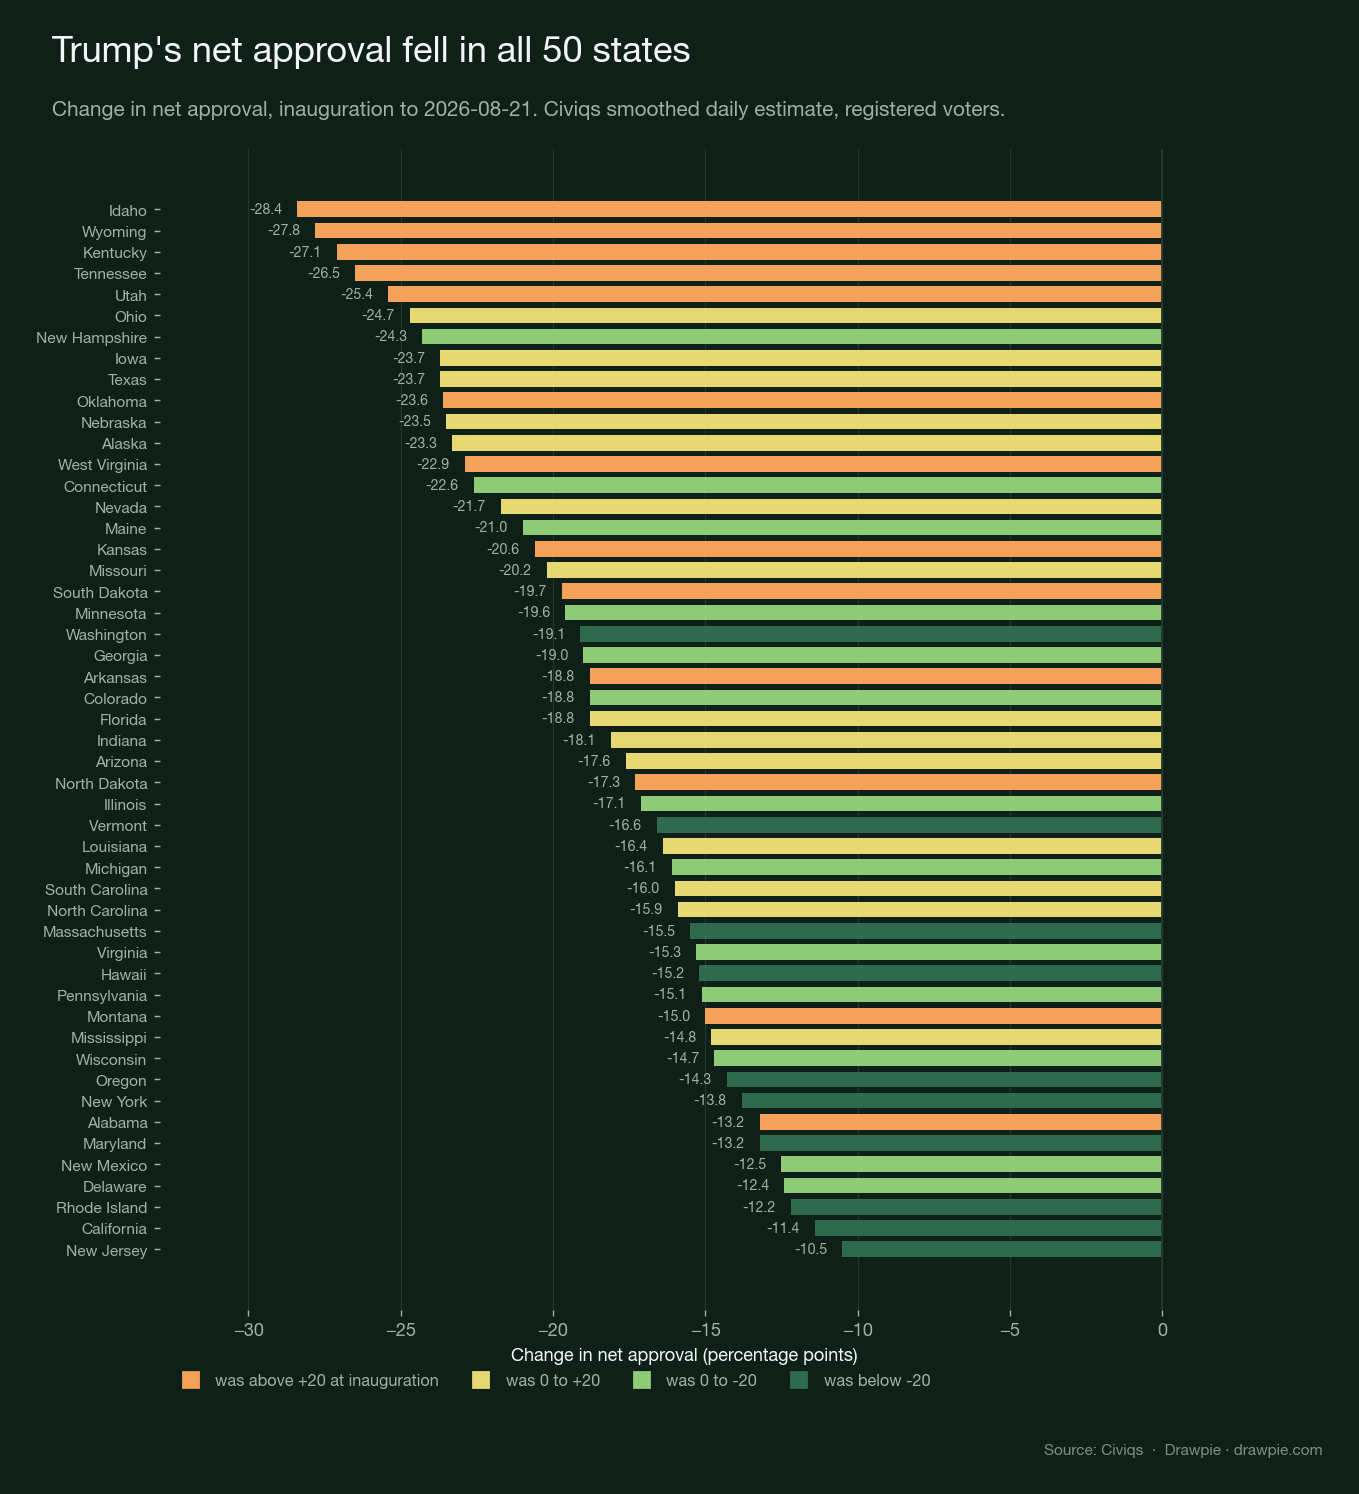
Nationally, net approval went from −6.0 to −22.6, a fall of 16.6 points. That the national figure moved less than the median state is not a contradiction: the national number is weighted by population, and the biggest falls happened in small states.
Which states moved most, and which barely moved?
The top and bottom of that ranking are the part worth sitting with, because they run opposite to the intuition that a president loses ground fastest among people who were never going to like him.
| Biggest falls | Change | Smallest falls | Change |
|---|---|---|---|
| Idaho | −28.4 | New Jersey | −10.5 |
| Wyoming | −27.8 | California | −11.4 |
| Kentucky | −27.1 | Rhode Island | −12.2 |
| Tennessee | −26.5 | Delaware | −12.4 |
| Utah | −25.4 | New Mexico | −12.5 |
Every state in the left column voted for Trump comfortably in 2024. Every state in the right column did not. He lost more than twice as much ground in Idaho as in New Jersey.
Why did he fall hardest in his strongest states?
Mostly because that is where the room was. A president sitting at +47 in Wyoming has forty-seven points to give away before he reaches parity; a president at −43 in California has already lost the people available to lose.
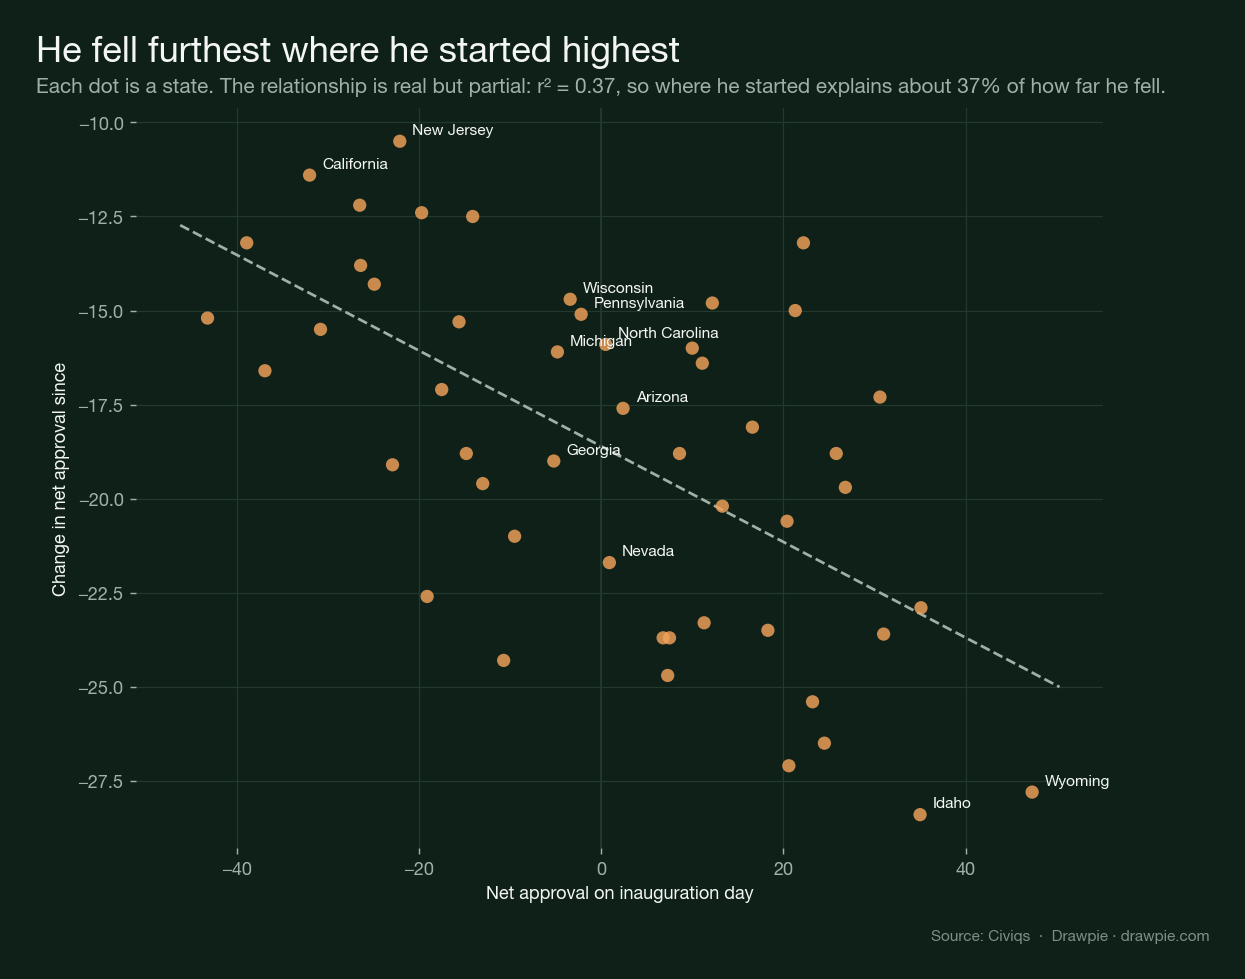
The relationship is genuine and worth stating precisely rather than dramatically: r² = 0.37, so where a state started explains about 37% of how far it fell, and roughly two thirds of the variation is something else. Splitting the states into quarters by starting position, the reddest quarter fell 22.1 points on average and the bluest quarter 14.7 — a real gap of about seven and a half points, not a chasm.
How are the swing states trending?
This is where the expectation and the data part company most sharply. The seven 2024 battlegrounds fell by 17.2 points on average, against a 50-state median of 18.5. They moved less than the typical state, not more.
| Battleground | Inauguration | Now (21 Aug 2026) | Change |
|---|---|---|---|
| Arizona | +2.4 | −15.2 | −17.6 |
| Nevada | +0.9 | −20.8 | −21.7 |
| North Carolina | +0.5 | −15.4 | −15.9 |
| Pennsylvania | −2.2 | −17.3 | −15.1 |
| Wisconsin | −3.4 | −18.1 | −14.7 |
| Michigan | −4.8 | −20.9 | −16.1 |
| Georgia | −5.2 | −24.2 | −19.0 |
Two things stand out. All seven began within about five points of zero, which is a fair description of what makes a state a battleground in the first place. And all seven now sit between −15 and −25, a band they entered at different speeds — Nevada fell 21.7 points, Wisconsin 14.7 — but which none of them has escaped.
Georgia now sits lowest at −24.2, but Nevada fell the furthest. Those two are the only battlegrounds whose decline beat the 50-state median; the other five all moved less than the typical state.
Was there a moment it broke?
No. Civiqs annotates its own chart with six events, and taking the national net approval at each of them shows a slide rather than a series of cliffs.
| Period ending | Event | National net | Move in period |
|---|---|---|---|
| 20 Jan 2025 | Inauguration | −6.0 | — |
| 2 Apr 2025 | Tariff announcement | −9.4 | −3.4 |
| 22 Jun 2025 | US bombs Iran | −12.4 | −3.0 |
| 4 Jul 2025 | Big Beautiful Bill signed | −11.9 | +0.5 |
| 1 Oct 2025 | 2025 government shutdown | −13.2 | −1.3 |
| 3 Jan 2026 | Nicolas Maduro captured | −16.4 | −3.2 |
| 28 Feb 2026 | 2026 Iran war | −18.1 | −1.7 |
| 21 Aug 2026 | Latest | −22.6 | −4.5 |
The periods are very different lengths, so the raw moves are not directly comparable — the largest, −4.5, covers nearly six months, while the +0.5 covers twelve days. Read as rates, nothing here is a shock. The steepest sustained stretch is the opening ten weeks, from inauguration to the tariff announcement.
Why does the 50-state map keep changing?
Because roughly half of it rests on samples too small to hold still, and this is the single most useful thing to understand before quoting any state figure — including ours.
Reading the same date, 19 August, two days apart produces different answers. Across all 50 states the average difference is −0.26 points, with 22 states revising up and 26 down, so there is no drift in the tracker. But the individual movements are not small:
| State | Read on 21 Aug | Read on 22 Aug | Difference |
|---|---|---|---|
| North Dakota | +18.4 | +13.6 | −4.8 |
| Tennessee | +2.3 | −1.9 | −4.2 |
| Alabama | +5.9 | +9.2 | +3.3 |
| California | −43.2 | −43.4 | −0.2 |
| Maryland | −52.0 | −52.0 | 0.0 |
The pattern is not subtle. The states that move are small ones; the states that hold still are large ones. Civiqs’ own published confidence band says the same thing in advance: it is 10.3 points wide in Maryland, 10.5 in Massachusetts and New York, and 19.8 in South Dakota, 19.2 in Alaska, 18.8 in Wyoming.
There is a payoff in this for anyone reading the battlegrounds. Wisconsin’s band is 10.7 points, the fourth narrowest in the country. Michigan, Pennsylvania, Georgia, Arizona and North Carolina are all populous enough to sit in the reliable half of the table. The states people most want a number for are, for once, the states where the number is worth most.
Does any of this predict the midterms?
Not on its own, and this page does not try.
Presidential approval is one input to a midterm forecast, and a well-known one, but the relationship between a president’s net approval in a state and how that state’s House and Senate races break is loose enough that treating this as a seat projection would be a mistake. Our 2026 midterm House forecast handles approval as one variable among several, which is the right way round.
What the trend does establish is narrower and firmer: there is no state where the second term has improved Trump’s standing, the erosion is deepest in his own base, and the seven states that will be contested hardest have moved slightly less than the rest of the country.
What is Trump’s approval rating by state right now?
Nine states are net positive as of 21 August 2026: Wyoming (+19.5), North Dakota (+13.3), West Virginia (+12.2), Alabama (+9.0), Oklahoma (+7.4), South Dakota (+7.1), Arkansas (+7.0), Idaho (+6.6) and Montana (+6.3). The other 41 are net negative, from Kansas at −0.2 down to Hawaii at −58.4. The full 50-state table is on our state approval snapshot .
Which swing state has moved against Trump the most?
Nevada, which fell 21.7 points from +0.9 at inauguration to −20.8. Georgia is the battleground where he now stands lowest, at −24.2, but it started lower too, so its fall of 19.0 points is second. Wisconsin has moved least of the seven, at −14.7.
Has Trump’s approval gone up in any state?
No. Measured from inauguration day to 21 August 2026, net approval is lower in all 50 states. The smallest decline is New Jersey at −10.5 points.
Why do Trump approval numbers differ between trackers?
Different houses use different panels, weighting and rolling windows, and they can differ by a lot. In mid-August 2026 Civiqs had national net approval at −22.6 while Morning Consult’s weekly national tracker had −11, a gap of more than 11 points, with both sampling registered voters. Neither is straightforwardly right. The practical rule is that figures from different houses should never be combined or compared point to point — only a single house’s series can be read as a trend.
How reliable are state-level approval numbers?
Much less than national ones, and unevenly. Civiqs publishes a confidence band for each state which runs from about 10 points wide in the largest states to nearly 20 points in the smallest. In practice that means a state figure from Wyoming, South Dakota or Alaska can move several points within days without any opinion changing, while figures from California, New York or Maryland barely move at all.
When are the 2026 midterms?
3 November 2026. Every seat in the House of Representatives is up, along with a third of the Senate and a number of governorships.
Sources
| Source | Used for |
|---|---|
| Civiqs — Donald Trump job approval, second term | Every figure on this page. The daily smoothed trendline per state and nationally, the per-state confidence bands, and the six dated event annotations, all read from the data the results page embeds |
| Drawpie — Trump state approval, all 50 states | The 19 August snapshot the revision comparison is measured against, and the full current 50-state table |
| Drawpie — 2026 midterm House forecast | How presidential approval is treated as a forecasting input rather than a result |
How we verified this
🔴 Every number here was computed from the source’s own data, and the extraction is committed so it can be re-run. Civiqs embeds its full daily series in the results page as JSON, keyed by epoch milliseconds and filterable by state. scripts/civiqs_extract.py pulls it, scripts/build_civiqs_trend.py samples it and writes data/civiqs-trump-state-trend-2026-08-21.json. Nothing on this page is transcribed from a news report.
✅ The extraction was validated two independent ways before any of it was used. First, the values decoded from the page’s SVG chart geometry were checked against the JSON: Pennsylvania’s line ends at 38.2 approve / 55.5 disapprove by both routes. Second, every state’s final trendline value was checked against the separate per-state array Civiqs publishes on the national page — across all 50 states the median gap is 0.0 points and the largest is 0.1.
🔴 The figures here differ from our own 50-state snapshot published two days earlier, and the reason is the story. That page put Pennsylvania at −19.4 on 19 August; reading the same date now gives −17.2. Comparing all 50 states the same way, the mean difference is −0.26 points with 22 states up and 26 down — no systematic bias, just noise being smoothed away as more interviews arrive. The states that moved most are the small ones. Neither reading is wrong; a rolling tracker’s most recent days are its least settled.
⚠️ Two states have crossed from net positive to net negative since that snapshot, and both are states where Civiqs’ own uncertainty is widest. Kansas went +2.1 to −0.2 and Tennessee +2.3 to −2.0. Their published confidence bands are 15.8 and 18.1 points wide, against a 50-state median of 13.5. The count of states where Trump is above water is 9 now and was 11 then; that number was never a stable fact and is not presented as one.
⚠️ Civiqs failed a control test and is used anyway, on the same grounds as before. An invented question path on civiqs.com returns HTTP 200, so a successful response proves nothing. The page is judged on content: its title resolves to the specific second-term question while the invented path falls back to the generic site title, and its embedded numbers reproduce values published independently by Newsweek.
The two figures published by this tracker are different quantities and are not mixed. The smoothed daily trendline is what every trend and change figure on this page uses, because a change needs a consistent series at both ends. The per-state array is what the endpoint cross-check uses. They agree today to within 0.1 points.
Per-state sample sizes are still not published, but a per-state uncertainty is. Civiqs does not give an interview count by state. It does publish a confidence band for every state and every day inside the same data, and this page quotes those bands rather than treating all 50 states as equally solid. A gap of two or three points between adjacent states is not a real difference in most of them.
🔴 Figures from different polling houses are never combined here. Everything on this page is one Civiqs series. Morning Consult’s state-by-state tracker is still stamped February 2026 with autumn 2025 fieldwork and is not comparable; its national weekly reading had net −11 in mid-August against Civiqs’ −22.6, and no attempt is made to adjudicate between them.
This page contains no forecast, no seat projection, and no betting or prediction-market number of any kind. It reports movement in survey readings that have already been taken. What that movement implies for November is discussed only in terms of what it cannot tell you.