Trump Approval Rating Summer 2026: What the Polls Actually Show
Civiqs updates daily and Marquette fields a national survey roughly every six to eight weeks, so the next Marquette release will either confirm or contradict the August decline shown here. From 30 September the summer framing is stale and the numbers need re-reading.
Everything else on the page is unaffected; the figures below still say when they were read.

- Civiqs has Trump at 35.3% approve and 58.6% disapprove as of 27 August — a net of -23.3, and within a fifth of a point of the lowest reading of his second term.
- The summer barely moved. From 1 June to 27 August the Civiqs trendline covered 2.3 points in total, against 10.8 points across the term as a whole. But it finished at the term’s low, so a summer that went almost nowhere still ended somewhere the presidency had not been.
- The other major public tracker says the opposite about the same months. Marquette’s national survey had approval rising from 38% in June to 40% in late July, which it attributed to improving views of gas and grocery prices.
- They are not really contradicting each other. Marquette runs 2.4 points higher on average because its toplines are forced to 100 while Civiqs leaves about 6% with no opinion — and Marquette’s last interview was 29 July, before the August decline happened at all.
- The most telling number is inside Marquette’s own poll. In the survey where approval rose two points, strong approval fell to 15%, its lowest of the term. Every point of the gain was in ‘somewhat approve’.
Two of the most-followed public trackers of Trump’s job approval covered summer 2026 and came away with different stories. One has him at the lowest point of his presidency. The other had him improving.
Both readings are defensible. The reason they differ is more interesting than either number.
What is Trump’s approval rating right now?
35.3% approve and 58.6% disapprove, on the Civiqs daily trendline as of 27 August 2026 — a net of −23.3. That is within two-tenths of a point of the lowest reading of his second term.
The most recent reading from the other source here is older and higher: Marquette’s national survey of adults, interviewed 22–29 July, put it at 40% approve and 60% disapprove.
| Civiqs | Marquette | |
|---|---|---|
| Who | registered voters | all adults |
| How | daily trendline | survey |
| As of | 27 Aug 2026 | 22–29 Jul 2026 |
| Approve | 35.3% | 40% |
| Disapprove | 58.6% | 60% |
| Net | −23.3 | −20 |
Those are five points apart, and about half of that gap is a methodology difference that never goes away. The rest is a month of calendar.
Did Trump’s approval change over the summer?
Barely, and then decisively at the end. On the Civiqs series the whole of summer fits inside 2.3 points — it opened at 36.5% on 1 June, peaked at 37.4% on 16 June, and closed at 35.3% on 27 August.
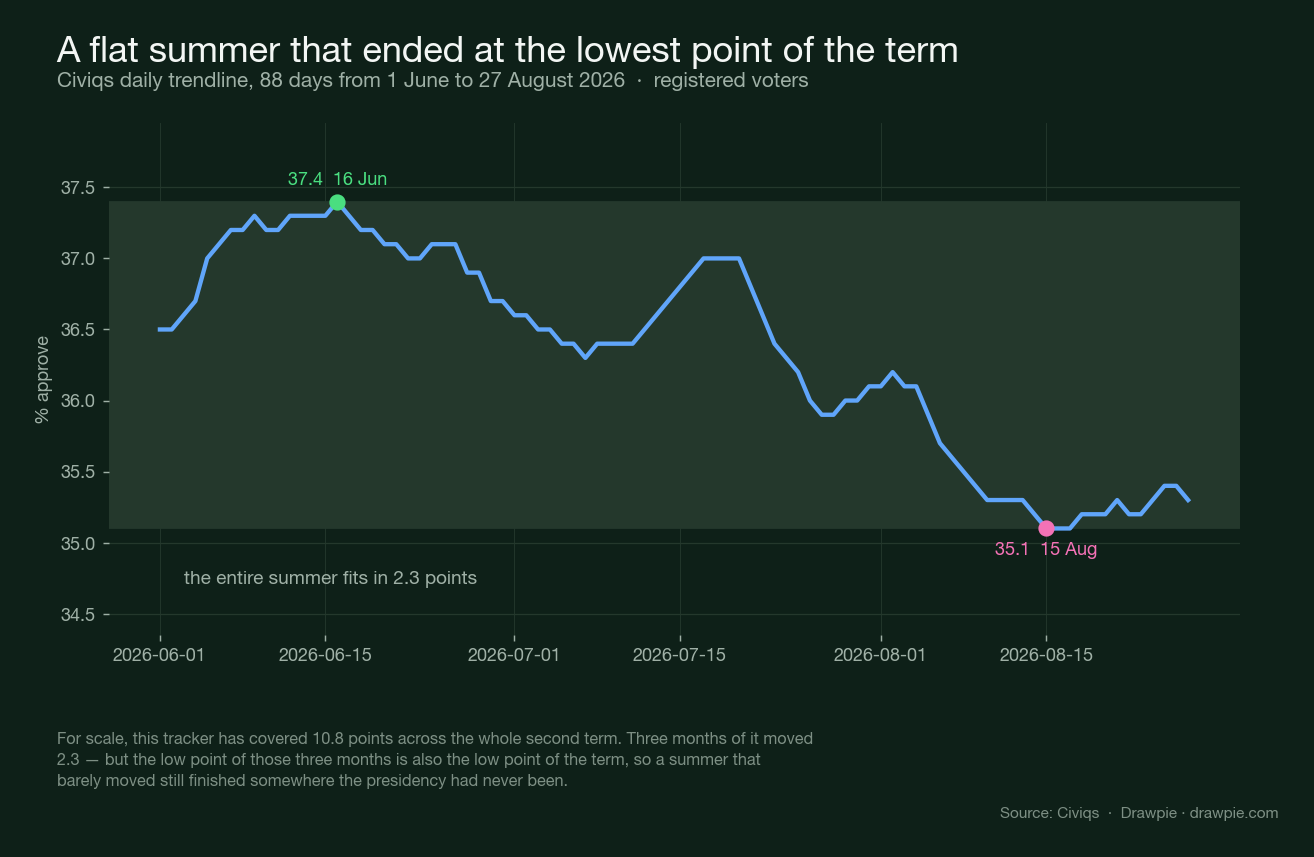
For scale, that same tracker has covered 10.8 points across the whole second term. Three months moved a fifth of that.
But the floor of those three months is also the floor of the presidency: 35.1% on 15 August, the lowest single day of the term. A summer that went almost nowhere still finished somewhere the number had never been.
The monthly averages show it was a slide rather than an event:
| Month | Approve | Net | Change |
|---|---|---|---|
| April | 37.3 | −20.5 | −1.0 |
| May | 37.4 | −20.1 | +0.0 |
| June | 37.1 | −20.6 | −0.3 |
| July | 36.5 | −21.6 | −0.6 |
| August | 35.4 | −23.2 | −1.0 |
August was the steepest month of 2026 so far, tied with April. Nothing in the shape of the line suggests a single moment; it is a drift that accelerated.
Why do two trackers show the summer differently?
Because they are measuring different people, asking in a different format, and — decisively — stopping on different dates.
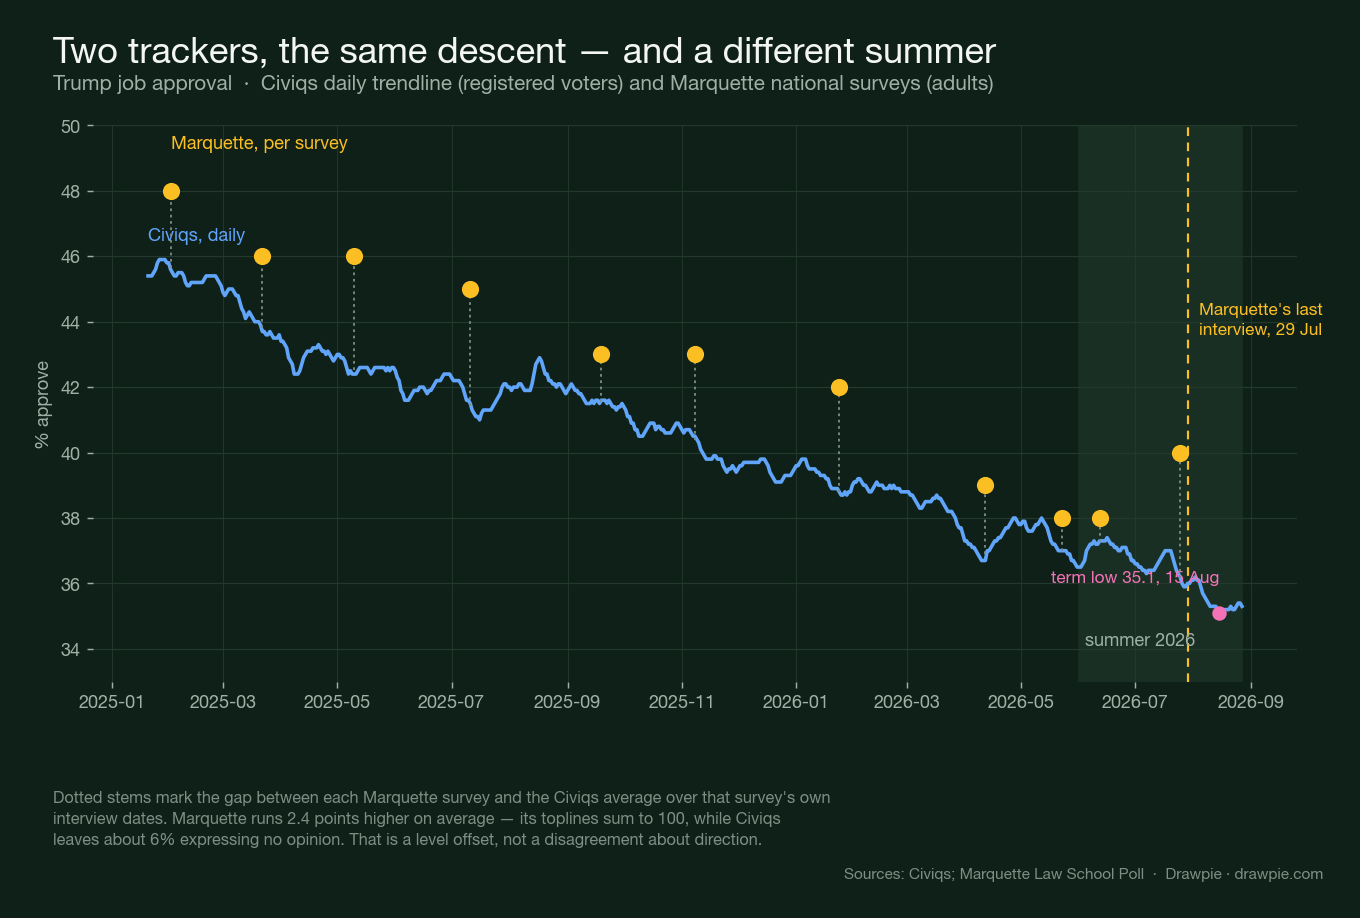
Set each Marquette survey against the average of the Civiqs line across that survey’s own interview dates, and the picture resolves:
| Survey | Marquette | Civiqs | Gap |
|---|---|---|---|
| Jan 2026 | 42 | 38.8 | +3.2 |
| Apr 2026 | 39 | 36.9 | +2.1 |
| May 2026 | 38 | 37.0 | +1.0 |
| Jun 2026 | 38 | 37.3 | +0.7 |
| Jul 2026 | 40 | 36.2 | +3.8 |
The Civiqs column is that tracker’s average across each Marquette survey’s own interview dates, not a headline figure.
Across all eleven aligned windows the correlation is r = 0.95 and the average gap is +2.4 points. They are the same descent, drawn at two heights.
Three things account for the difference:
Registered voters versus all adults. Civiqs polls registered voters; Marquette polls adults. These are different populations and there is no fixed conversion between them.
What happens to people with no opinion. This is the biggest single factor and it is pure arithmetic. Civiqs’ latest reading is 35.3 plus 58.6, which leaves 6.1% expressing no opinion. Marquette’s July toplines are 40 and 60 — they sum to exactly 100, so effectively nobody is left out. A survey that pushes undecided respondents onto one side or the other will read higher for whichever side they lean toward. That is not a flaw in either; it is a design choice with a predictable consequence.
Marquette stopped measuring on 29 July. This is the part most coverage misses. The entire August decline, including the 15 August term low, falls after Marquette’s last interview. The two sources are not disagreeing about August. Only one of them has been there.
That last point cuts both ways. Marquette’s next national survey will be the test: if it comes back at 38 or lower, the August fall was real and Marquette simply had not caught it. If it comes back at 40 again, the Civiqs dip was noise in a modelled series.
What does “strongly approve” show that the headline number doesn’t?
That the July improvement was hollow. In the same survey where Marquette’s headline rose two points, strong approval fell to 15% — the lowest of the term.
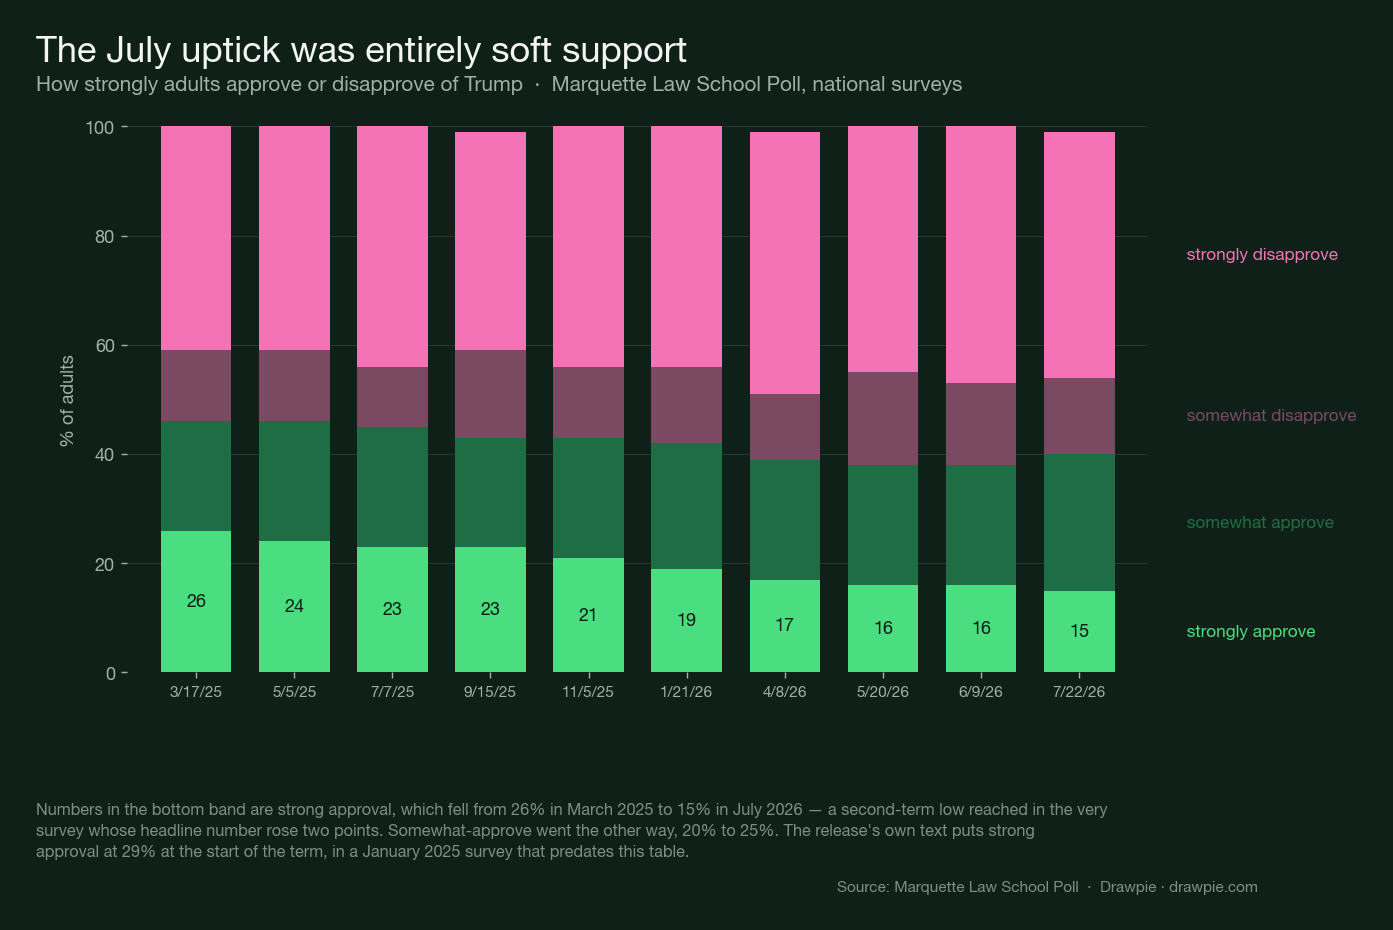
Here is the June-to-July move broken out:
| June | July | Change | |
|---|---|---|---|
| Strongly approve | 16 | 15 | −1 |
| Somewhat approve | 22 | 25 | +3 |
| Total approve | 38 | 40 | +2 |
| Somewhat disapprove | 15 | 14 | −1 |
| Strongly disapprove | 47 | 45 | −2 |
Every point of the gain, and one point more, came from “somewhat approve.” The committed end of his support kept shrinking through the month his headline number rose.
Over the term as a whole the trend is unbroken. Marquette’s published table has strong approval at 26% in March 2025 falling to 15% in July 2026, while somewhat-approve rose from 20% to 25%. The release’s own text puts strong approval at 29% at the very start of the term, in a January 2025 survey that predates the published table — which would make the fall roughly half of where it started.
Marquette attributes the July uptick to improving economic perceptions, specifically views of gas and grocery prices. Its own issue numbers put a ceiling on how much that helped: approval of his handling of inflation, the economy, the Iran war and gas prices all sat at 30% or below in the same survey.
How does this compare with the rest of his second term?
It is the bottom of a long, fairly smooth descent rather than a collapse. Both sources show the same arc from a start in the mid-to-high 40s.
| Start | Latest | Change | |
|---|---|---|---|
| Civiqs | 45.4 (20 Jan 2025) | 35.3 (27 Aug 2026) | −10.1 |
| Marquette | 48 (27 Jan – 6 Feb 2025) | 40 (22–29 Jul 2026) | −8 |
Marquette’s own framing is that approval “declined steadily throughout his second term until this improvement in July,” with the number falling into the high 30s from April onward. The Civiqs monthly series says the same thing in more granularity: nineteen months, one direction, no reversal lasting more than a few weeks.
What is unusual is not the level but the stability of the disapproval side. Civiqs has disapproval between 57 and 59 for most of 2026. The movement in the net figure comes mostly from approval leaking away, not from disapproval hardening further — there is not much room left for it to.
What can these numbers not tell you?
Quite a lot, and it is worth being specific about which things.
They are not a forecast. Approval measures the present. There is a relationship between presidential approval and midterm outcomes, but it is loose, it is mediated by turnout and candidate quality, and translating one into the other is a separate exercise with its own error. We keep that on the 2026 midterm House forecast rather than smuggling it in here.
A modelled daily line is not a poll. The Civiqs trendline is a smoothed estimate, not a single survey with a single margin of error, and its most recent days are the least settled — they get revised as more interviews arrive. Our own state-level page found exactly that: reading the same date two days later moved some states by more than two points, with no systematic direction .
Two sources is two, not many. These are the two that publish enough underlying detail to be checked, which is why they are the two used here. A broader average would include houses whose methods cannot be inspected.
Sub-2-point moves are not news. Marquette’s July survey has a stated margin of error of ±3.2 points on 1,076 adults. Its two-point rise does not clear that on its own — what makes it worth reporting is not the size but the composition, which is where the strong-approval finding comes from.
Sources
| Source | Used for |
|---|---|
| Civiqs — Donald Trump job approval, second term | The daily national trendline, 20 January 2025 to 27 August 2026, extracted from the JSON embedded in the results page: every Civiqs figure, the monthly averages, the summer range and the term low |
| Marquette Law School Poll — national release, 5 August 2026 (PDF) | Tables 13 and 14: the eleven-survey approval series, the strength-of-approval breakdown, the July field dates and sample, the economic-perception attribution and the issue-approval ceiling |
| Marquette Law School Poll — detailed results, July 22–29 2026 | The survey instrument, methodology statement and the SSRS Opinion Panel description |
| Drawpie — Trump state polls 2026 | The finding that a rolling tracker’s most recent days get revised without a systematic direction |
How we verified this
Two independent sources, deliberately, and neither is treated as the answer on its own. Civiqs publishes a daily smoothed trendline of registered voters; the Marquette Law School Poll fields national surveys of adults roughly every six to eight weeks and publishes complete toplines. Both were read on 28 August 2026, and the combined series is committed to data/civiqs-marquette-trump-national-2026-08-28.json so every figure here can be re-derived without a network call.
🔴 A control test on Civiqs failed at the status-code level and had to be redone against the body. Requesting an invented result slug on civiqs.com returns HTTP 302 — exactly what the real page returns — so a successful response proves nothing. The discriminator used instead is content: the real page contains the filtered_topline series once, the invented slug contains it zero times despite returning a larger page. Marquette’s own site does discriminate properly, returning 404 for an invented path.
✅ The two sources are compared over Marquette’s own interview windows, not against each other’s headline dates. Setting “Civiqs says 35, Marquette says 40” side by side would confound three different things at once. Each Marquette reading is therefore set against the average of the Civiqs daily trendline across that survey’s exact field dates. What survives that alignment is a level offset of +2.4 points (sd 1.1) and a correlation of r = 0.95 across eleven windows — the two track each other closely and sit at different heights.
⚠️ They agree on the shape and disagree more often than the correlation suggests. Interval by interval, with a half-point dead band applied to both, the direction of movement matches on only 5 of 10 intervals. An earlier version of that calculation counted a flat Marquette reading against a falling Civiqs one as agreement and reported 7 of 10; that was a coding error and the corrected figure is used.
🔴 The Marquette strength-of-approval table was mis-parsed on the first pass and the error was caught by a sum check. The extractor picked up a row from the following table whose four values summed to 138 rather than 100. Every row is now validated to sum to 99-101 before use, and the ten rows charted all pass. This is why the chart’s earliest strong-approval figure is 26% from March 2025 rather than the 29% the release’s prose cites — the 29% comes from a January 2025 survey that predates the published table.
The level gap has a concrete cause, not a hand-waved one. Civiqs’ latest reading is 35.3 approve plus 58.6 disapprove, which leaves 6.1% expressing no opinion. Marquette’s July toplines are 40 and 60, summing to exactly 100. A survey that effectively pushes undecided respondents onto a side will read higher for whichever side they lean to; that is arithmetic, not a judgement about which house is better.
Sample and error. Marquette’s July survey interviewed 1,076 adults nationwide from 22 to 29 July 2026 on the SSRS Opinion Panel, an online probability panel, with a stated margin of error of ±3.2 points. Civiqs’ figure is a modelled daily estimate rather than a single survey, so it has no comparable single margin of error and its most recent days are the least settled.
What this page does not do. It makes no forecast, of the midterms or of anything else, and it carries no betting or prediction-market prices in any form. Approval polling is a measurement of the present; treating it as a prediction of November is a separate exercise with its own error, and we keep that on its own page.