Tropical Storm Dolly 2026: The Full Track, and Why It Fell Apart in a Day
Update log (1)
- — 2026-09-02: rewritten from a live tracker into a retrospective. Dolly degenerated into an open tropical wave on 28 August, two days earlier than advisory 1 forecast; NHC's final advisory (No. 5) was issued at 15:00 UTC that day, and the storm never reached the Leeward Islands as a cyclone. Present-tense framing, the live-update section and the forecast-track section replaced with the closed record; remnant rainfall outcome for the US Virgin Islands and Puerto Rico added.

- NHC does not forecast Dolly to become a hurricane. Its advisory 1 peak is 40 kt (45 mph), against a hurricane threshold of 64 kt (74 mph), and the forecast ends in dissipation on 31 August.
- The quantified answer is in NHC’s wind speed probability product: not one location in it carries a 64 kt row, and the product prints those rows whenever the five-day chance of hurricane-force wind reaches 1%. Everywhere is below one per cent.
- US territory is involved only lightly and only through rain. St Thomas, St John and St Croix sit at a 3–4% chance of tropical-storm-force wind; Puerto Rico is below the 3% threshold to be printed at all. NHC’s hazard is heavy rain and flash flooding on Sunday and Monday, especially in higher terrain.
- No coastal watch or warning was issued for Dolly at any point, and the mainland United States never appeared in any part of the forecast. NHC’s fifth advisory, at 15:00 UTC on 28 August, was its last.
Tropical Storm Dolly formed over the central tropical Atlantic on the morning of Thursday 27 August 2026. The National Hurricane Center began issuing advisories on it at 15:00 UTC, and the first one already contains the answer to the question most people are asking.
It is no.
Everything below is from that first advisory — and the record is now closed. NHC issued four more, and stopped: advisory 5, at 15:00 UTC on Friday 28 August, was the last public advisory on the system. Where advisory 1’s forecast and the outcome differ, this page now says so.
Did Tropical Storm Dolly become a hurricane?
No, and it never came near. Advisory 1 forecast a peak of 40 kt — 45 mph — against the 64 kt, 74 mph hurricane threshold, and 40 mph was as strong as Dolly ever got: NHC’s final advisory, 24 hours later, still had it at 40 mph with a central pressure of 1008 mb. If anything the forecast was generous. It had Dolly going post-tropical on Sunday and dissipating on Monday; in the event it opened into a tropical wave on Friday morning.
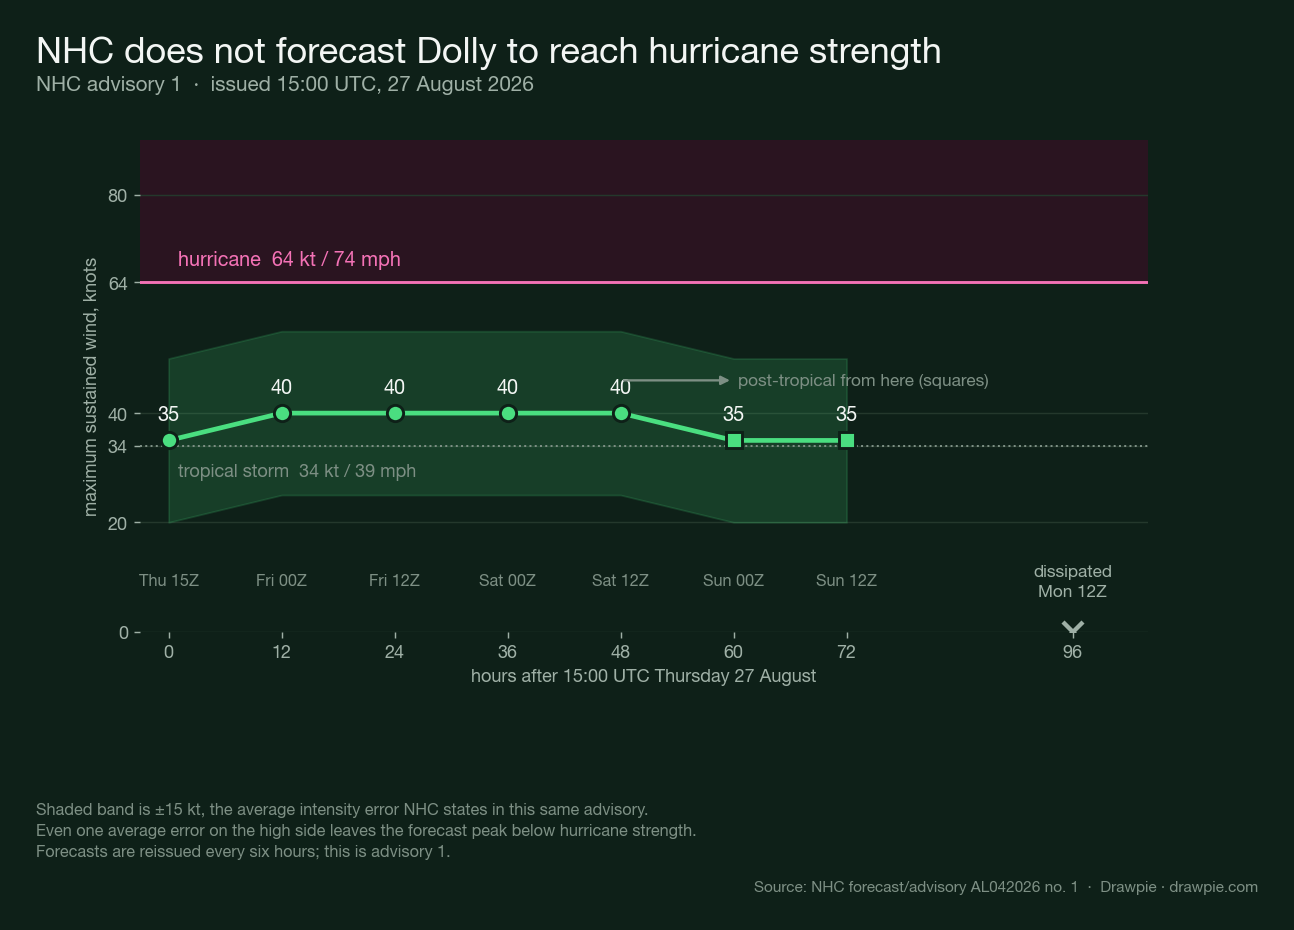
The shaded band is NHC’s own stated average intensity error — the advisory says those errors “have averaged near 15 kt each day”. Even adding a full average error to the forecast peak leaves Dolly at 55 kt, still short of a hurricane.
There is a harder number than that, and it comes from a product almost nobody reads. Alongside each advisory NHC issues wind speed probabilities for specific locations, giving the chance of sustained winds of at least 34, 50 and 64 kt. In this one, eleven locations are listed and every one of them has only a 34 kt row. The product states its own rule: the 50 and 64 kt rows are printed whenever the five-day cumulative chance of hurricane-force wind reaches 1 per cent.
Nothing was printed. At every location in the product, that chance is below one per cent.
Where Dolly was, at the first advisory
Near 13.6°N, 38.7°W, about 1,555 miles east of the Leeward Islands, as of 15:00 UTC on 27 August.
| Measure | Advisory 1, 15:00 UTC 27 Aug |
|---|---|
| Maximum sustained winds | 40 mph (65 km/h), 35 kt |
| Movement | West, 275°, at 24 mph (39 km/h) |
| Minimum central pressure | 1007 mb (29.74 in) |
| Tropical-storm-force wind extent | 60 miles (95 km) from the centre |
| Coastal watches and warnings | none in effect |
Two of those numbers matter more than they look. A central pressure of 1007 mb is barely below ordinary tropical sea-level pressure — this is a weak system. And 24 mph is a fast forward speed for a tropical cyclone, which is part of why NHC does not expect it to organise.
The forecast track, and how far it actually got
Almost due west, quickly, and then apart before it gets anywhere. Dolly’s forecast latitude climbs only from 13.6°N to 17.7°N over three days while its longitude runs from 38.7°W to 63.2°W — a nearly straight line across open ocean towards the Lesser Antilles.
NHC forecast track for Dolly
Dolly is not in the National Hurricane Center's active-storm list as of 4 October 2026, 13:56 UTC. Storms leave that list once they dissipate or become post-tropical remnants, so this is the expected state for any system more than a few days old — the article above describes what it did while it existed.
NHC notes that model guidance is “tightly packed” on a track towards the Leeward Islands, and that its own forecast sits on the faster and more southward side of that guidance — consistent, it says, with a well-known tendency for models to be too slow and too far poleward in the tropical Atlantic.
That forecast never ran its course. Dolly opened into a tropical wave on Friday morning, 28 August, still about 1,000 miles east of the Leeward Islands — it never reached them as a cyclone at all. NHC’s final forecast had the vorticity centre dissipated by 00:00 UTC on 30 August, a day and a half earlier than advisory 1’s timeline. There was never any mainland United States in this story.
Who was actually at risk — and what landed
The islands, and mostly from rain rather than wind. NHC’s hazard statement is specific about both the places and the days: heavy rain could begin to affect the Leeward Islands late Saturday into Sunday, and the Virgin Islands, Puerto Rico and Hispaniola Sunday and Monday. The risk it names is flash flooding, especially in areas of higher terrain.
On wind, the picture is thinner still.
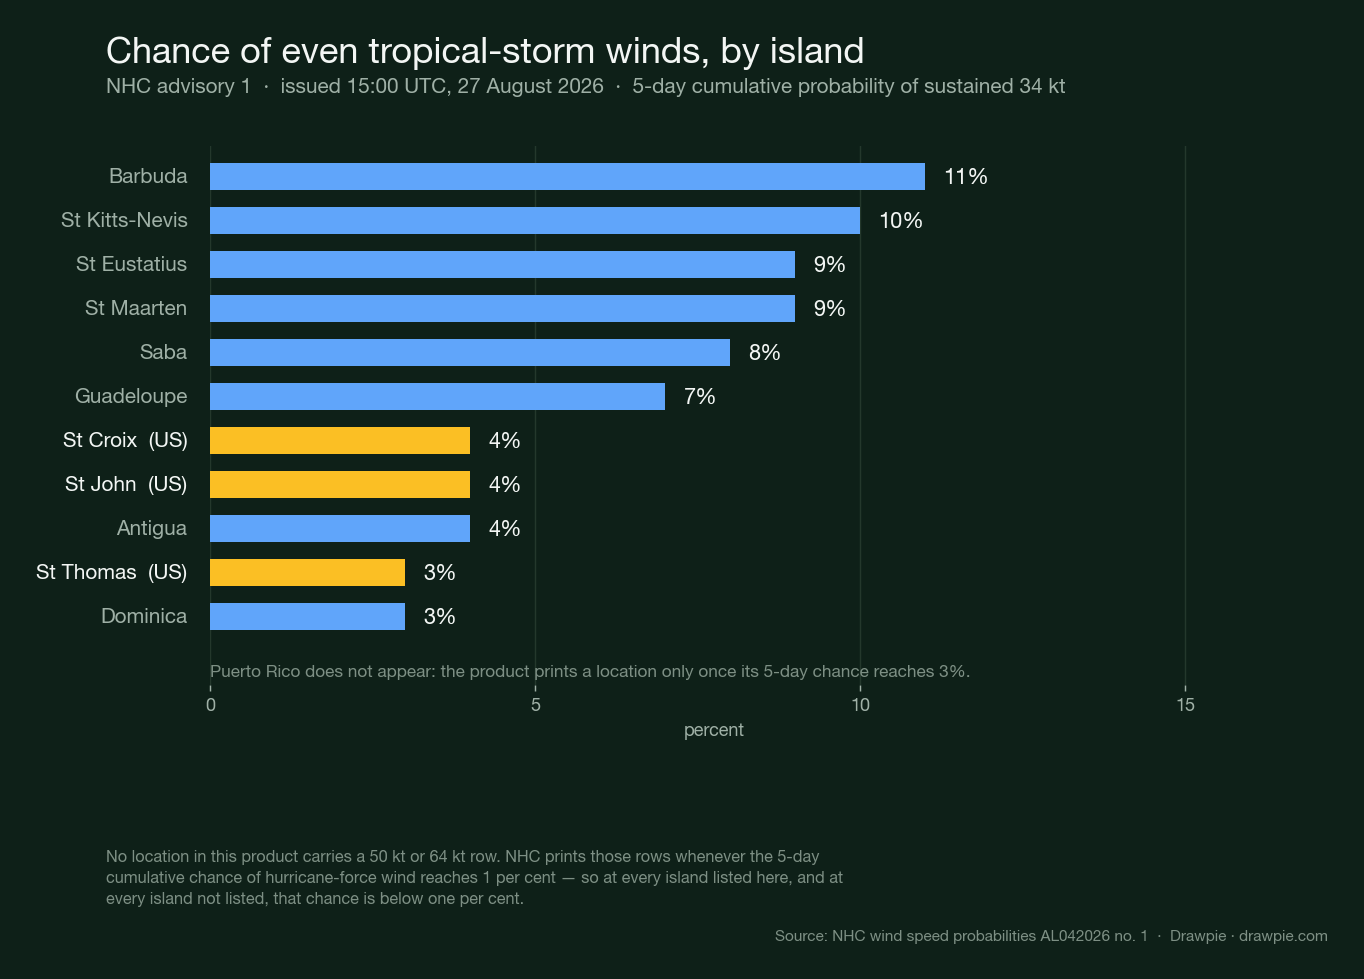
For a US audience the two rows that matter are the US Virgin Islands and Puerto Rico:
- St Croix and St John: 4%. St Thomas: 3%. Those are five-day cumulative chances of sustained tropical-storm-force wind — 39 mph and above.
- Puerto Rico does not appear in the table at all, which places it under the 3% threshold NHC uses before printing a location.
Puerto Rico being absent from the wind table while named in the rain hazard is not a contradiction. It is the whole shape of this system: a disorganised bundle of moisture moving fast, with far more rain in it than wind.
Are there any watches or warnings?
None, ever. No coastal watch or warning was in effect at advisory 1, and none was issued before NHC’s final advisory 24 hours later. No storm surge product was issued at any point.
What NHC says instead is that interests in the Leeward Islands should monitor Dolly’s progress. That is the weakest formal language in the set, and it is worth reading as what it is — a request to keep an eye on it, not an instruction to act.
Why Dolly fell apart
Three things at once, and NHC names all three: increasing southwesterly shear from an upper-level trough over the central Atlantic, the storm’s own fast forward motion, and dry air aloft.
Shear is already visible in what the satellite shows. NHC describes northwesterly shear pushing most of the thunderstorm activity onto the southern side of the circulation, away from the centre — a storm whose convection has been shoved off its own middle is not a storm that is deepening. The maximum winds of 35 kt were measured by scatterometer in the northeastern quadrant, with a Dvorak classification of T2.5/35 kt supporting it.
NHC’s expectation, in its own words, was that Dolly would open up into a strong tropical wave before it reached the Leeward Islands. It did — about a thousand miles short of them, on the morning of Friday 28 August. The final discussion put it flatly: “Dolly has become an open tropical wave”, the initial and forecast positions from then on being those of a vorticity maximum rather than a storm centre. The post-tropical positions in the forecast are provided not because the system will still be dangerous as a cyclone, but because a decaying wave still carries gusty winds and heavy rain.
Where the full record lives
The National Hurricane Center, at nhc.noaa.gov. It is the only source that matters here, and every number on this page came from it.
Complete advisories come at 5:00 and 11:00, morning and evening, Atlantic Standard Time — the equivalent of 21:00, 03:00, 09:00 and 15:00 UTC. Advisory 1 was issued at 15:00 UTC on 27 August, so the first update to everything above was due at 21:00 UTC that same day. If watches or warnings are ever issued for a storm, intermediate advisories fill the gaps every three hours.
Four products are published each cycle and they answer different questions. The public advisory is the plain-language summary with the position and the hazards. The forecast/advisory carries the numerical forecast positions and intensities. The forecast discussion explains the reasoning, and is where the forecaster’s own doubts appear. The wind speed probabilities give the per-location numbers used above.
Why is it called Dolly?
It is the fourth name on the 2026 Atlantic list, and NHC went out of its way to say the timing is coincidental. The discussion attached to advisory 1 contains an unusual paragraph explaining that Atlantic storm names come from six pre-determined rotating lists maintained by the World Meteorological Organization’s Region IV Hurricane Committee, and that the name Dolly replaced Diana after the 1990 hurricane season, first being used in 1996.
Forecasters do not normally spend a paragraph of a technical discussion on nomenclature. That they did here is a small sign of how much confusion a name can generate — and it is the only part of advisory 1 that reads the same way now that the storm is gone.
How we verified this
🔴 The storm was confirmed to exist before anything else was written. NHC’s machine-readable current-storms feed returned Dolly as active storm al042026 at 35 kt, and an invented filename on the same host returned 404 — so the feed discriminates rather than answering everything the same way. Every figure below then came from the advisory text products, not from the feed alone.
🔴 This page was written one advisory deep, and was rewritten once the record closed. Everything is from advisory 1, issued 15:00 UTC on 27 August 2026, forecaster Blake. NHC reissues every six hours; the next complete advisory was due at 21:00 UTC the same day. A live storm article is a snapshot by construction, and the honest thing is to timestamp it rather than write as though it were settled.
✅ “Will it become a hurricane” is answered from NHC’s probability product, not from the narrative. The wind speed probabilities product lists eleven locations and gives each only a 34 kt row. Its own printing rule states that 50 kt and 64 kt rows appear “when the 5-day 64-kt cumulative probability is at least 1 percent”. No row appears anywhere, so the chance is below 1% at every location in the product.
⚠️ Puerto Rico’s absence from that table is informative, not an omission. The same product prints a location once its five-day cumulative 34 kt probability reaches 3%. Puerto Rico is not printed, which places it below that figure — while NHC separately names Puerto Rico in its rainfall hazard. Low wind risk and real rain risk are not in conflict.
✅ The Leeward Islands longitude on the track chart is derived, not recalled. NHC’s public advisory places the centre “about 1555 mi…2505 km E of the Leeward Islands” while at 13.6N 38.7W, which puts the islands near 61.9°W. NHC’s two distance figures were checked against each other first: 1,555 miles converts to 2,502.5 km against the stated 2,505 km.
⚠️ The ±15 kt band on the intensity chart is NHC’s own stated error, used flat. The advisory says intensity errors “have averaged near 15 kt each day”. It is drawn as a constant band because that is how the sentence reads; it is not a probability distribution, and NHC’s probability product is the better guide to outcomes.
🔴 No forecast on this page is ours. Track positions, intensities, timing, hazards and error figures are all NHC’s. Where this page does arithmetic — the longitude derivation, the gap between 40 kt and 64 kt — it says so.