Tim Cook's Apple Legacy: How Services, Supply Chain & Apple Silicon Built a $4.6 Trillion Giant

- Tim Cook stops being Apple’s CEO today, 1 September 2026, after almost exactly 15 years. John Ternus takes over; Cook becomes executive chairman. Apple announced the handover on 20 April 2026.
- Apple’s June 2026 quarter brought in $109.4 billion. Its entire fiscal 2011 — the year Cook took over — brought in $108.2 billion. One quarter now out-earns that whole year.
- Services is 28% of Apple’s revenue and 42% of its gross profit, because it carries a 75.6% margin against hardware’s 40.1%.
- Apple’s hardware gross margin today, 40.1%, is almost exactly what the entire company earned in fiscal 2011: 40.5%. The company-wide rise to 50.1% is a change in what Apple sells, not better margins on what it makes.
- The share price rose 23.6× under Cook but the company’s value rose 13.2×, from about $350 billion to $4.62 trillion. The gap is buybacks: about 44% of Apple’s shares have been retired.
- The supply chain came first and is the least visible pillar. Cook was hired in 1998 to run operations, and cut Apple’s inventory from roughly a month’s worth to days.
Tim Cook stops being Apple’s chief executive today. John Ternus takes over, Cook becomes executive chairman, and a fifteen-year run that began on 24 August 2011 ends on 1 September 2026.
The number everyone will reach for is the market capitalisation: about $350 billion when he started, $4.62 trillion now. That number is real, and it is also the least informative way to describe what happened. Here is a better one.
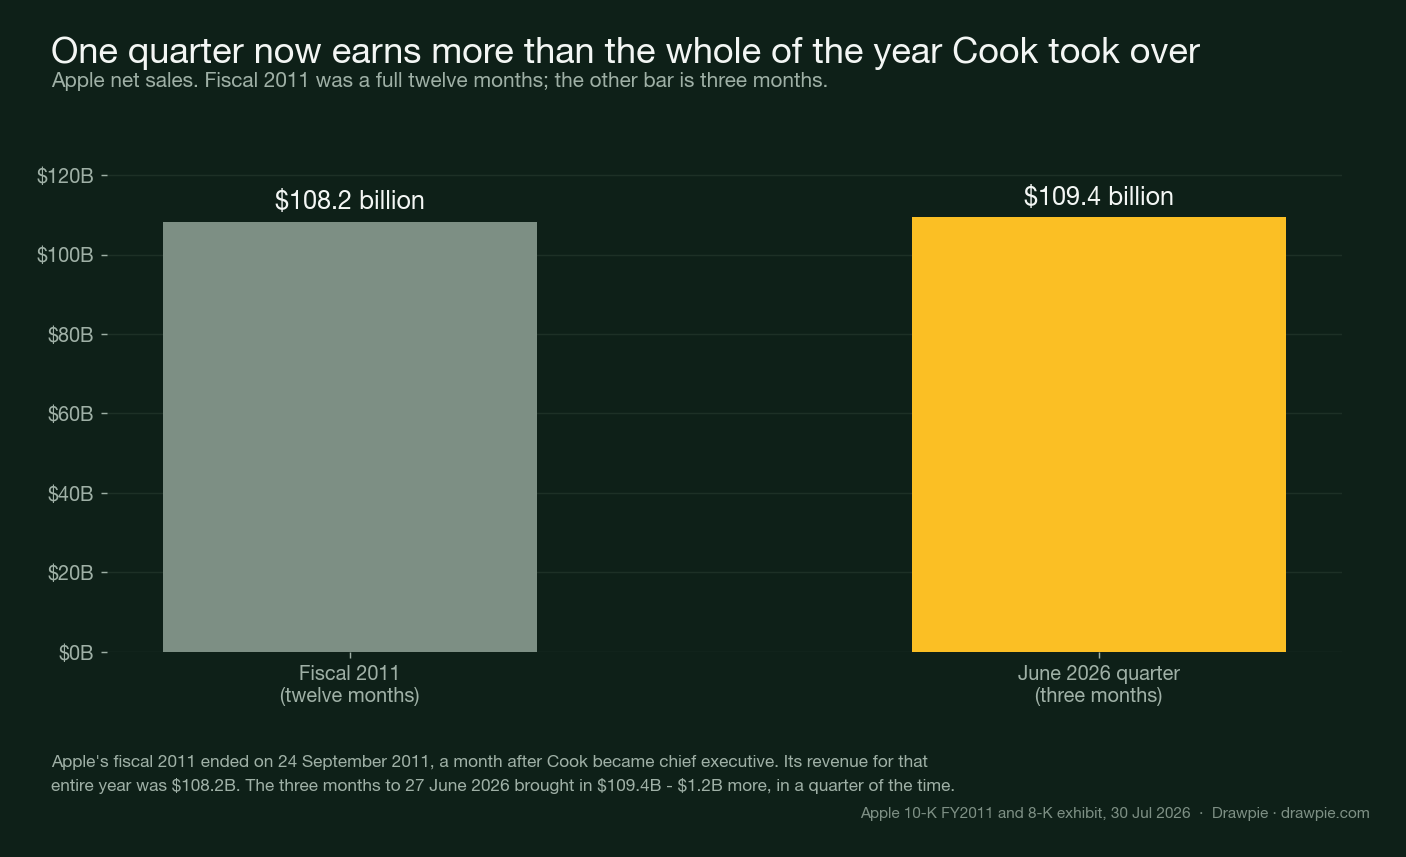
Apple’s revenue in the three months to 27 June 2026 was $109.4 billion. Its revenue for the entire fiscal year that ended a month after Cook became CEO was $108.2 billion. A single quarter now out-earns the whole of the year he inherited.
That is the scale. The interesting question is how, and the honest answer has three parts — plus a fourth that rarely makes the list.
The supply chain, which came first
Cook was not hired to be a visionary. He was hired in March 1998 as senior vice president for worldwide operations, at a company that had nearly run out of money, and his job was inventory.
What he did is the least glamorous item on any list of Apple achievements and probably the most consequential. He closed factories and warehouses and moved production to contract manufacturers. Apple’s inventory fell from roughly a month’s worth to a matter of days — reporting from the period puts it at six days by September 1998 and around two days a year later. Those specific figures come from contemporaneous accounts rather than from a filing, but the direction is not in dispute.
Inventory is a strange thing to build a career on until you notice what it does to a hardware company. Unsold stock in a warehouse is money that has already been spent on components that lose value every week. A company holding two days of it can change what it makes almost immediately, and does not have to discount old stock to clear shelves. Every subsequent Apple product decision — annual iPhone cycles, aggressive component pre-purchases, the ability to move hundreds of millions of units at a fixed margin — runs on that machinery.
It is also the pillar that explains why Cook was the successor. He had already rebuilt the part of Apple that turns designs into deliverable objects.
Services, which changed what Apple is
This is the pillar that did most of the financial work, and the numbers are unambiguous.
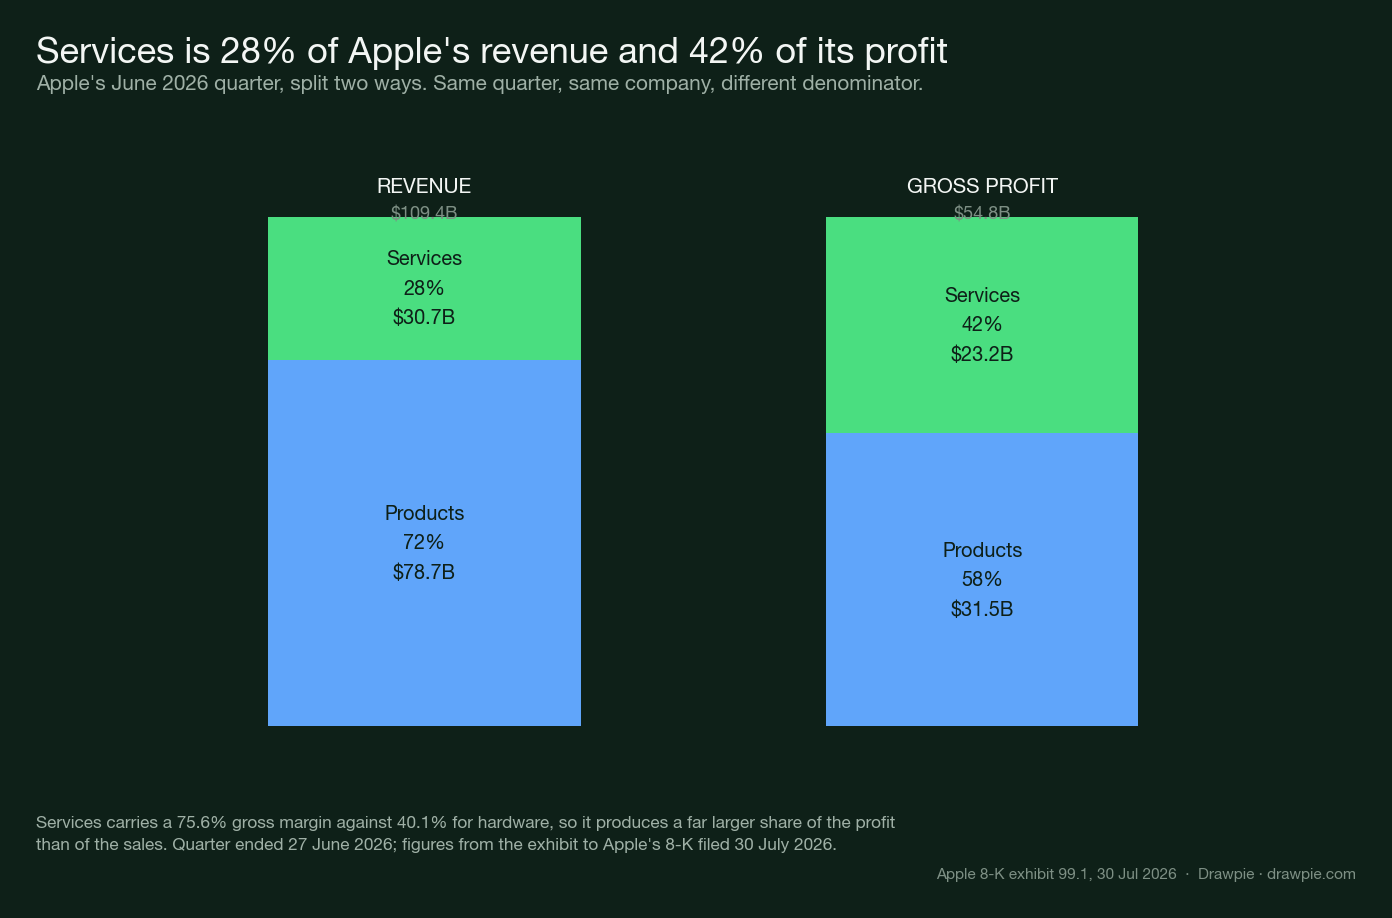
In the June 2026 quarter, Services generated $30.7 billion of Apple’s $109.4 billion in revenue — about 28%. But it generated $23.2 billion of the $54.8 billion in gross profit — about 42%.
The reason is margin. Services runs at a 75.6% gross margin. Hardware runs at 40.1%. Every dollar of services revenue is worth nearly twice as much at the gross line as a dollar of hardware revenue.
Now put that next to where Apple started.
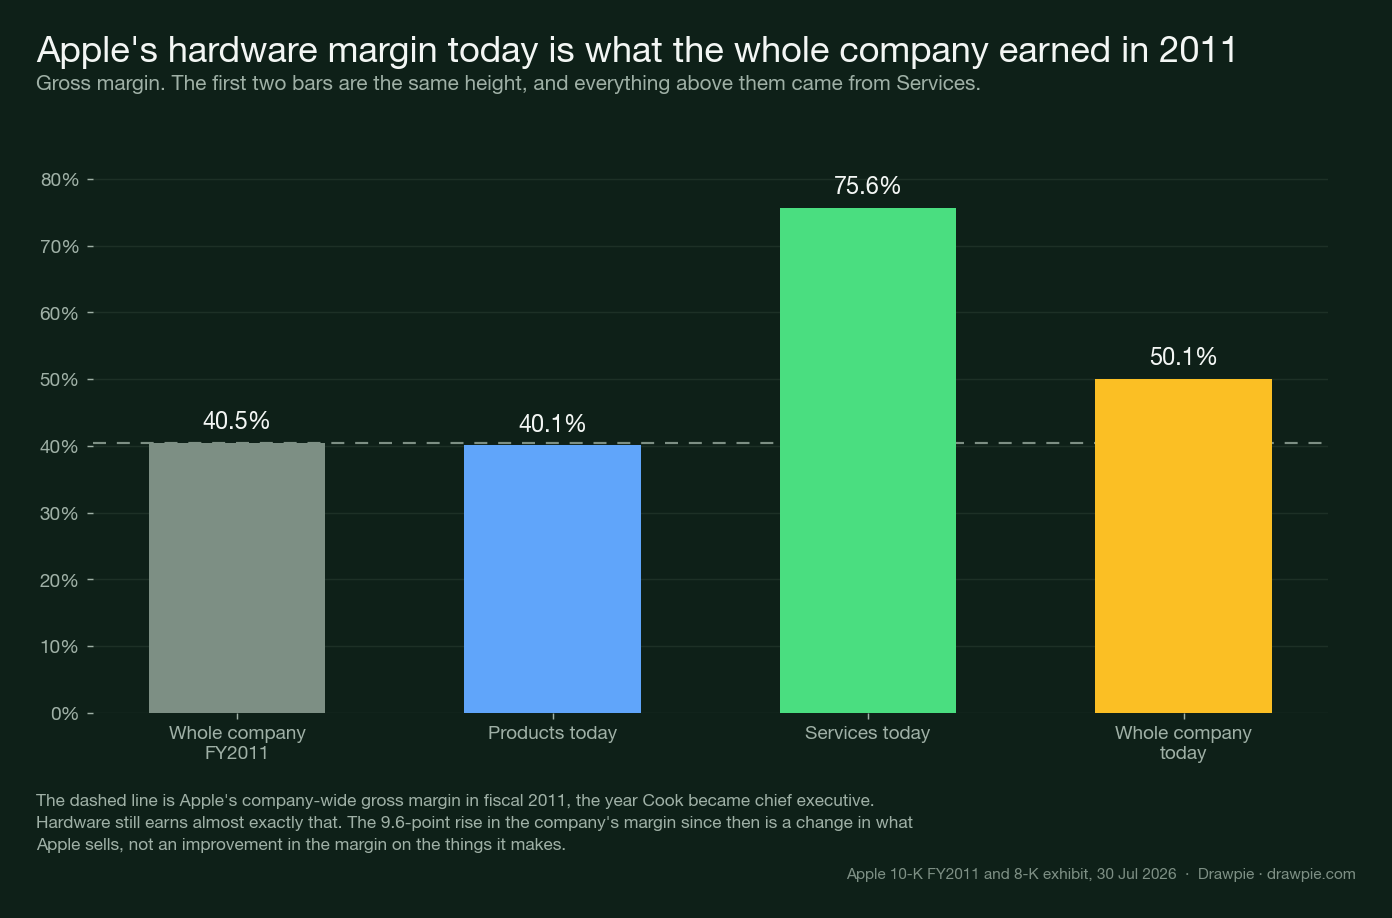
Apple’s company-wide gross margin in fiscal 2011 was 40.5%. Today its hardware margin is 40.1%.
That is the finding worth sitting with. Apple does not make more money per iPhone than it made per iPhone in 2011, at least not at the gross margin line. The company-wide margin rose from 40.5% to 50.1% — nearly ten points — and essentially all of that came from selling a different mix of things, not from making the old things more profitably.
Cook’s Apple did not get better at hardware economics. It attached a much better business to the hardware.
Apple silicon, which secured the hardware
The third pillar is the one Ternus himself helped build.
Apple announced the Mac’s move to its own processors at WWDC in June 2020, promising a two-year transition. The first M1 Macs shipped that November. The transition finished on 5 June 2023, when the Mac Pro arrived with M2 Ultra and the last Intel Mac left the line-up — three years after it began.
The strategic content of this is easy to state and was hard to do: Apple stopped depending on another company’s roadmap for the performance of its computers. Before, a Mac was as fast as Intel’s release schedule allowed and as efficient as Intel’s process permitted. After, both were Apple’s decisions.
It also completed something that had been running since the first custom iPhone chip. By 2023 Apple designed the processors in every product line it sells. Ternus, as the head of hardware engineering, ran the organisation that did it — which is a reasonable clue about where the next few years are pointed.
The pillar that is not in the title: buybacks
There is a fourth thing Cook did, and it accounts for a great deal of the number in most headlines.
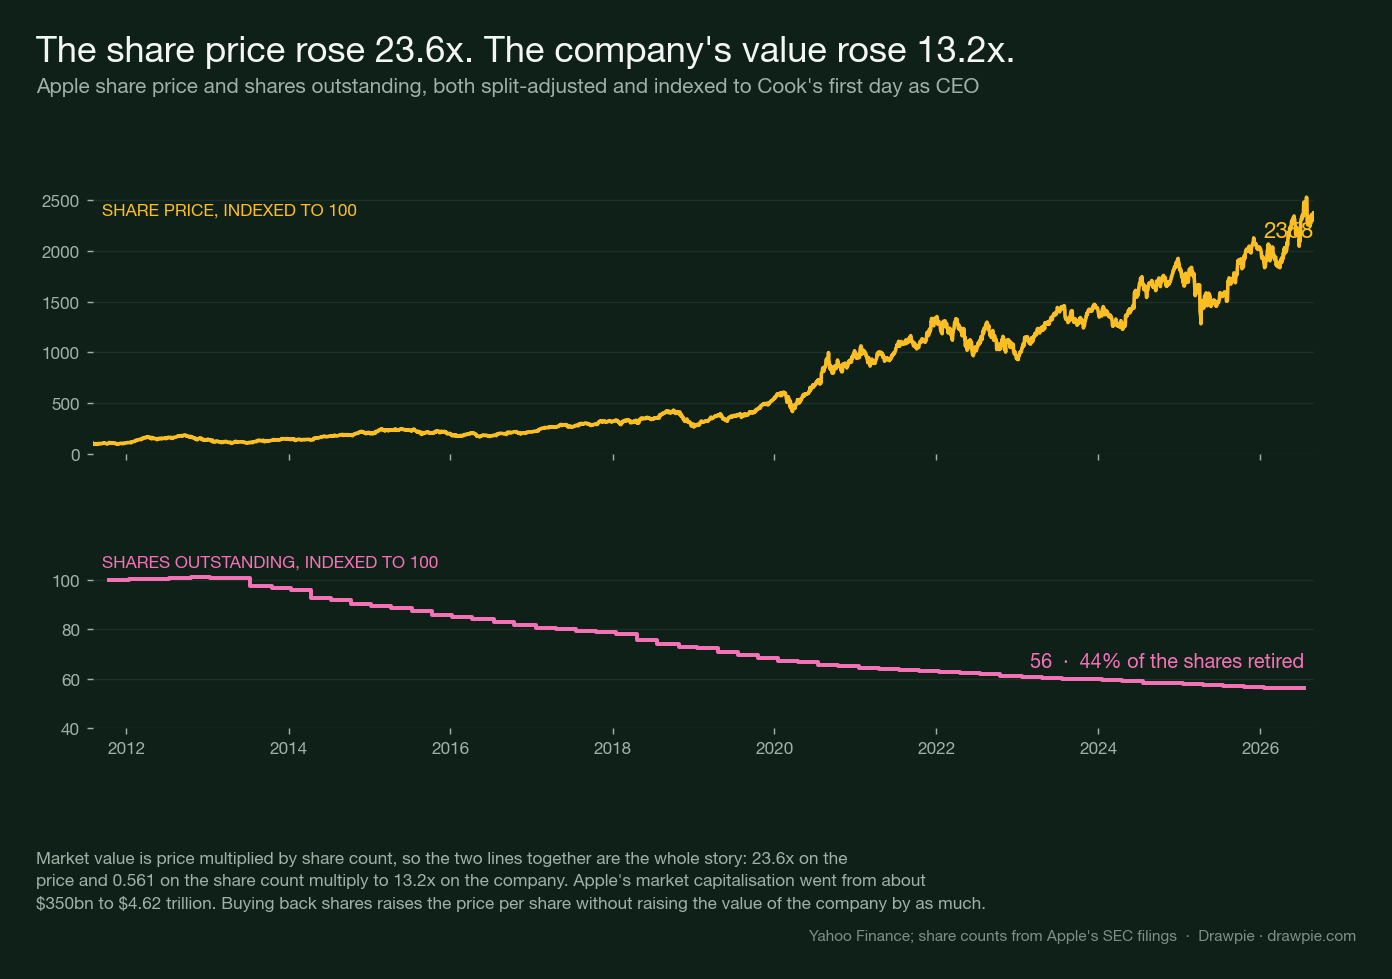
Apple’s share price rose 23.6× under Cook. Apple’s market value rose 13.2×, from about $350 billion to $4.62 trillion.
Those are different numbers because market value is price multiplied by share count, and the share count fell. Apple has retired roughly 44% of its shares — from about 26.0 billion split-adjusted shares in 2011 to 14.6 billion now. Apple began returning capital at scale in 2012, the year after Cook took over, and has been among the largest repurchasers of its own stock in corporate history ever since.
This is not a criticism. Buying back stock when a company generates more cash than it can reinvest is defensible capital allocation. But it does mean that anyone quoting the share-price gain as though it measured how much Apple grew is overstating it by roughly ten times over.
What Cook did not solve
The handover comes with an unfinished item, and Apple’s own commentary points at it. On the June 2026 results call Cook’s quoted remark led with the WWDC26 introduction of “the all-new Siri AI” — a product Apple was widely seen as late to, in a category where rivals moved first and faster.
That is the inheritance. Ternus takes over a company with an extraordinary balance sheet, the best hardware supply chain in consumer electronics, its own silicon in every product, and a services business throwing off 75% gross margins — and an open question about whether it is positioned correctly for the most significant platform shift since the smartphone.
Why is Apple worth 13 times more if the share price rose 23 times?
Because Apple bought back a large fraction of its own shares, and market value is the share price multiplied by the number of shares.
The share count fell from about 26.0 billion split-adjusted shares in 2011 to 14.6 billion today, a reduction of roughly 44%. A share price multiple of 23.6 combined with a share count at 56% of its old level gives a company-value multiple of 13.2. Both numbers are true; they answer different questions. If you held the stock throughout, your return tracks the share price. If you are asking how much bigger Apple got, the market capitalisation is the number.
Did Apple’s hardware become more profitable under Tim Cook?
At the gross margin line, essentially not.
Apple’s products gross margin in the June 2026 quarter was 40.1%. The company’s overall gross margin in fiscal 2011 was 40.5%. The rise in Apple’s total margin to 50.1% comes from Services, which runs at 75.6% and now accounts for 28% of revenue. The hardware business got vastly larger under Cook, and its per-dollar profitability stayed roughly where he found it.
What is Tim Cook’s role at Apple now?
Executive chairman of the board.
Apple’s April announcement says he will assist with “certain aspects of the company, including engaging with policymakers around the world” — a role that reads as government and regulatory relations, which has occupied a growing share of Apple’s attention through antitrust cases, App Store regulation and tariffs. He is not leaving the company.
Who is John Ternus?
Apple’s senior vice president of hardware engineering, and now its chief executive.
He joined Apple in 2001, became vice president of hardware engineering in 2013, and joined the executive team in 2021. His organisation shipped the Apple silicon transition across every Mac, along with hardware for iPhone, iPad, Mac, Apple Watch and AirPods. In Apple’s announcement Cook said Ternus “has the mind of an engineer, the soul of an innovator, and the heart to lead with integrity.”
The bottom line
The three pillars in the headline are real and they are sequential rather than parallel. The supply chain made Apple able to build at scale reliably. Services changed what a unit of Apple revenue is worth. Apple silicon removed the company’s dependence on someone else’s engineering for its own hardware.
The financial signature of all that is a company whose single quarter now exceeds the annual revenue of the company Cook inherited, whose gross margin rose ten points without its hardware margin moving at all, and whose share count is 44% smaller than when he arrived.
What none of it settles is the question Ternus starts with today, which is whether the next platform belongs to Apple in the way the last one did.
Important information
This article is for informational and educational purposes only. It is not investment, financial, legal, or tax advice, and is not a recommendation, offer, or solicitation to buy, sell, or hold any security.
The charts show historical figures drawn from Apple’s SEC filings and historical market data. They do not predict future results. Past performance does not guarantee future results.
This article contains no price forecast and quotes no third-party price target for Apple or anything else. Financial figures are as of the quarter ended 27 June 2026, the most recent period Apple has reported.
The author is not a licensed financial adviser or broker-dealer. Do your own research and consult a qualified, licensed financial professional before making any investment decision. Drawpie and the author accept no liability for any loss arising from the use of this content. Filing data via SEC EDGAR; market data via Yahoo Finance.