Tesla's Q2: Free Cash Flow Went Negative and Operating Margin Fell to 1.4%

- Revenue set an all-time record at $28.24bn, up 26%. Deliveries of 480,126 were a record for a second quarter, though below the 497,099 of Q3 2025.
- Operating margin fell from 4.1% to 1.4% because operating expenses grew 47% while gross profit grew 23%. Most of the squeeze sits below the gross-profit line — though Tesla also names lower selling prices, fewer regulatory credits and energy warranty charges.
- Quarterly free cash flow was −$1.092bn as capex rose 142% to $5.789bn. Trailing twelve-month free cash flow is still about +$5.8bn, and cash and investments stand at $43.5bn.
- $0.22 of the $0.32 GAAP EPS came from an unrealised mark-up on Tesla’s SpaceX stake. Tesla’s own non-GAAP EPS, which excludes it, fell 18%.
Tesla reported Q2 2026 after the closing bell on Wednesday, and three things were true at once: record revenue, a record second quarter for deliveries, and the weakest operating margin in five years.
Revenue rose 26% to $28.24bn on 480,126 vehicles. Operating income fell 57% to $398m. Operating margin went from 4.1% a year ago to 1.4%. Quarterly free cash flow came in at −$1.092bn.
One thing to settle before going further, because “negative free cash flow” invites a bigger conclusion than the numbers support: this is a single quarter. On our arithmetic from Tesla’s own quarterly figures, trailing twelve-month free cash flow is still about +$5.8bn, and cash, cash equivalents and short-term investments finished the quarter at $43.524bn — up 18% year-on-year. Those figures do not indicate near-term liquidity pressure, though the quarter’s own free cash flow was genuinely negative.
What did change is the shape of the business, and it changed in a specific place.
Figures below are from Tesla’s Q2 2026 filing; market data runs through the 22 July regular-session close, the last completed session. After-hours figures are timestamp-dependent and labelled as such. This article is for information and education only. It is not investment advice, and not a recommendation to buy, sell, or hold any security.
What did Tesla actually report?
| Metric | Q2 2025 | Q2 2026 | Change |
|---|---|---|---|
| Total revenue | $22.496bn | $28.236bn | +26% |
| Deliveries | 384,122 | 480,126 | +25% |
| Gross profit | $3.878bn | $4.751bn | +23% |
| Operating expenses | $2.955bn | $4.353bn | +47% |
| Operating income | $0.923bn | $0.398bn | −57% |
| Operating margin | 4.1% | 1.4% | −269bp |
| Capital expenditure | $2.394bn | $5.789bn | +142% |
| Operating cash flow | $2.540bn | $4.697bn | +85% |
| Free cash flow | +$0.146bn | −$1.092bn | — |
| GAAP diluted EPS | $0.33 | $0.32 | −3% |
| Non-GAAP diluted EPS | $0.40 | $0.33 | −18% |
| Cash and investments | $36.782bn | $43.524bn | +18% |
Revenue is an all-time high and operating cash flow grew 85%. Deliveries of 480,126 are a second-quarter record — note that the same table shows 497,099 in Q3 2025, so this is not an all-time delivery high. Tesla also lists a lower average selling price among the drivers of the quarter, so volume alone does not settle the question of pricing power. The market had already made a version of that point on 2 July, when the delivery count was published: Tesla fell that day despite the beat, while Rivian rose on its own numbers .
Why did the profit margin fall?
Mostly, though not entirely, below the gross-profit line. Tesla’s own list of what hurt operating income names four things: higher operating expenses (AI and other R&D, stock-based compensation including the 2025 CEO Performance Award, and SG&A), lower regulatory credit revenue, a lower vehicle average selling price including mix, and higher energy warranty charges. Against those it lists more deliveries, Services growth, a lower average cost per vehicle from lower inbound duties, a $0.1bn currency benefit and higher FSD subscription revenue.
The arithmetic says operating expenses did most of the damage — gross margin fell about 41 basis points while operating margin fell 269 — but ASP is on the company’s own list, and it would be wrong to say pricing played no part:
| Q2 2025 | Q2 2026 | Growth | |
|---|---|---|---|
| Revenue | $22.496bn | $28.236bn | +26% |
| Gross profit | $3.878bn | $4.751bn | +23% |
| Operating expenses | $2.955bn | $4.353bn | +47% |
| Operating income | $0.923bn | $0.398bn | −57% |
Gross profit grew 23%. Operating expenses grew 47%. When the cost line below gross profit grows at twice the rate of the profit line above it, operating income falls even though the business is bigger — and that is exactly what happened.
The gross-margin picture is more mixed than the headline suggests, and worth stating precisely:
| Automotive gross margin | Q2 2025 | Q1 2026 | Q2 2026 |
|---|---|---|---|
| GAAP | 17.2% | 21.1% | 16.9% |
| Excluding regulatory credits | 15.0% | 19.2% | 16.3% |
| Regulatory credit revenue | $439m | $380m | $146m |
Year-on-year, automotive gross margin excluding regulatory credits actually improved, from 15.0% to 16.3%. Against the prior quarter it fell sharply, from 19.2%. And regulatory credit revenue — pure margin, no cost attached — dropped by two thirds, from $439m to $146m.
So the headline “margins declined” is most true at the operating line. At the gross line the year-on-year move is small, and excluding regulatory credits the vehicle business earned a wider margin than a year ago — but Tesla still reports a lower average selling price, so “cars are not selling for less” would overstate it. What the numbers support is narrower: the large part of the compression sits in operating expenses, not in what a car earns at the gross line.
Twenty quarters of operating margin
One quarter tells you very little about a margin. Five years tells you a great deal.
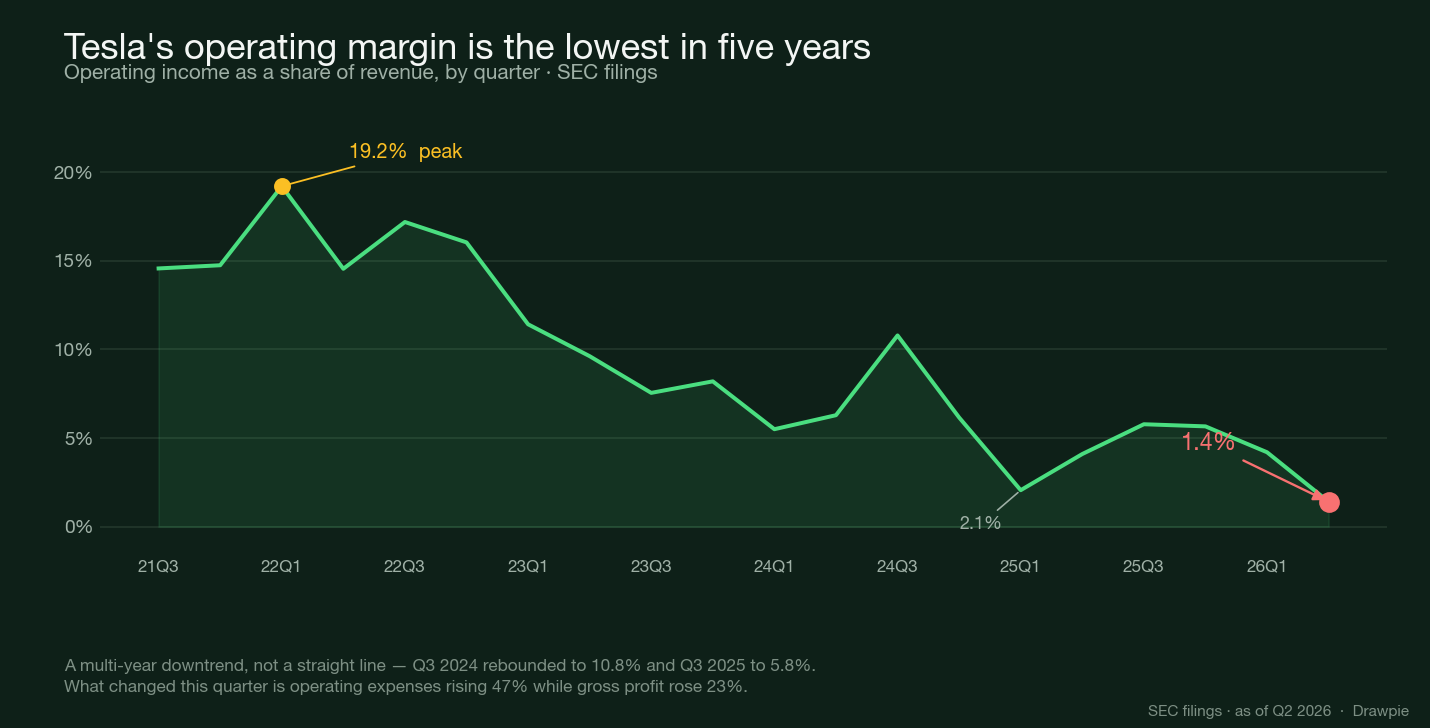
| Quarter | Operating margin | |
|---|---|---|
| Peak of the period | Q1 2022 | 19.2% |
| Prior low | Q1 2025 | 2.1% |
| Recent local high | Q3 2025 | 5.8% |
| Latest | Q2 2026 | 1.4% |
| Median, 20 quarters | — | 7.9% |
Three things this makes visible that the year-on-year comparison hides.
The decline is long-running, not sudden. A chart can show a multi-year downtrend; it cannot on its own establish that the causes are structural. What it does show is that the direction has been downward since Q1 2022 — from 19.2% to single digits by 2023, and into the 2–6% band it has occupied since the start of 2025. That is a direction, not a straight line: Q3 2024 rebounded to 10.8% and Q3 2025 to 5.8%. A reader told only that margin fell from 4.1% to 1.4% might reasonably think something broke this quarter. What actually happened is that a four-year trend reached a new low.
1.4% is the lowest of the twenty. Lower than Q1 2025 (2.1%), which was itself widely described at the time as a trough. That is the fact the single-quarter framing understates.
The line is volatile enough that one quarter is weak evidence. Q3 2024 printed 10.8% between quarters of 6.3% and 6.2%. Q3 2025 recovered to 5.8% from 4.1%. Whatever this quarter is, the series does not support treating any single reading as a new baseline.
Why did free cash flow go negative?
Capital expenditure rose 142%, to $5.789bn — more than the $4.697bn the business generated from operations in the same three months.
Tesla publishes five quarters of this data, and the sequence is more informative than the single quarter:
| Quarter | Operating cash flow | Capex | Free cash flow |
|---|---|---|---|
| Q2 2025 | $2.540bn | $2.394bn | +$0.146bn |
| Q3 2025 | $6.238bn | $2.248bn | +$3.990bn |
| Q4 2025 | $3.813bn | $2.393bn | +$1.420bn |
| Q1 2026 | $3.937bn | $2.493bn | +$1.444bn |
| Q2 2026 | $4.697bn | $5.789bn | −$1.092bn |
Note where the change is. Operating cash flow has been broadly stable to rising — $4.697bn is the second-best of the five quarters shown. Capex sat between $2.2bn and $2.5bn for four consecutive quarters, then more than doubled in one.
Tesla publishes the trailing figure itself, in the same deck:
- Trailing twelve months: operating cash flow $18.685bn less capex $12.923bn = +$5.762bn free cash flow, Tesla’s own disclosed figure
- First half of 2026: +$0.352bn — this one is our arithmetic on the two quarters
The trailing series is worth a second look. Tesla’s disclosed TTM free cash flow ran $6.220bn (Q4 2025) → $7.000bn (Q1 2026) → $5.762bn now. So this is a single quarterly step down from a rising trailing figure, not a run of declines — comfortably positive, but the direction changed this quarter.
That is the context the single quarter needs: one quarter in which capital spending stepped up past cash generation, against a trailing twelve-month figure that remains solidly positive.
Twenty quarters of free cash flow
The five quarters Tesla prints in its deck stop just short of the most useful comparison. Extending the series to twenty finds a precedent — and the precedent is not what the headline implies.
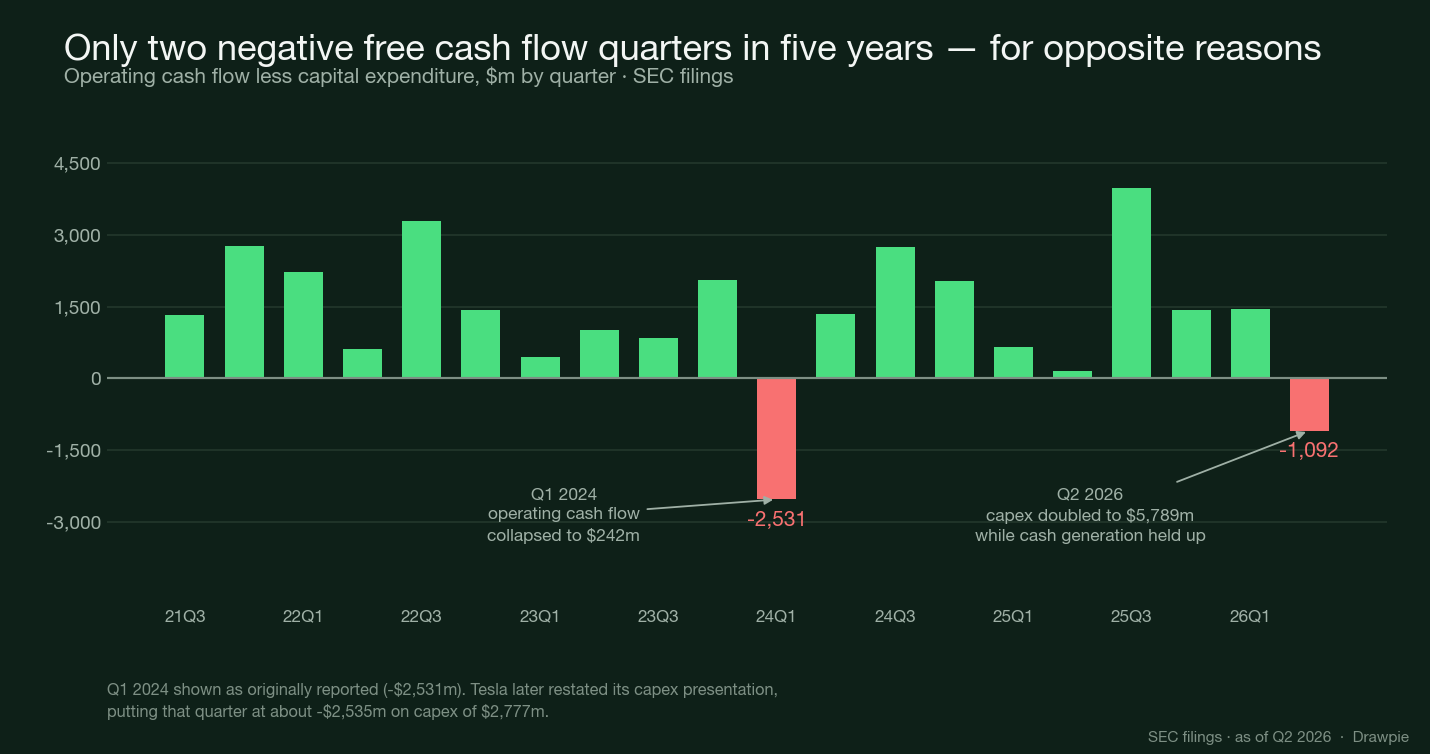
| Q1 2024 | Q2 2026 | |
|---|---|---|
| Free cash flow | −$2,531m | −$1,092m |
| Operating cash flow | $242m | $4,697m |
| Capital expenditure | $2,773m | $5,789m |
| What moved | cash generation collapsed | spending doubled |
(Q1 2024 figures in the table and the chart above are as originally reported. Tesla later restated its capex definition, which puts that quarter at about −$2,535m on capex of $2,777m — a $4m difference that is invisible at this scale but worth noting since the chart is reproduced on its own.)
Only two of the twenty quarters are negative, and they are opposite in kind.
Q1 2024 was the worse one, and the less comfortable one. Free cash flow was more than twice as negative, and it happened because operating cash flow fell to $242m — roughly a tenth of its neighbouring quarters. Capex that quarter was ordinary. That is the shape of a business having trouble generating cash.
Q2 2026 is the reverse. Operating cash flow of $4,697m is the highest second quarter in the whole twenty — above 2025’s $2,540m, 2024’s $3,612m and 2023’s $3,065m. Capex is the highest of all twenty, by a margin — $5,789m against a previous peak of $3,513m. Cash generation did not fail; spending stepped up past it.
Both readings need holding at once. The distinction is real and it matters: one of these is a company that could not generate cash, the other is a company that chose to spend more than it generated. Neither observation tells you whether the spending will pay off — that question is not answerable from a cash flow statement, and this chart does not attempt it.
Where did the GAAP profit come from?
This is the part that repays reading the filing rather than the headline.
GAAP diluted EPS was $0.32, down only 3% year-on-year — which looks resilient next to a 57% fall in operating income. The reconciliation explains why.
| Per share, after tax | Q2 2026 |
|---|---|
| GAAP diluted EPS | $0.32 |
| + Stock-based compensation | $0.29 |
| + Digital assets unrealised loss | $0.02 |
| − Unrealised gain on the SpaceX investment | −$0.22 |
| − Certain tax items | −$0.08 |
| = Non-GAAP diluted EPS (Tesla’s own measure) | $0.33, −18% YoY |
Tesla recorded a $1.005bn unrealised gain on its SpaceX equity investment — $763m after tax, $0.22 per share. That is roughly two thirds of the entire GAAP earnings per share for the quarter.
Three things worth being precise about:
- Tesla bought that stake one quarter earlier. The cash flow statement shows a $2.002bn SpaceX equity investment in Q1 2026 and no comparable line before it; the 10-Q puts the holding at a $3.007bn fair value at quarter end — roughly a 50% mark-up within a single quarter. ⚠️ That valuation is not simply the listed price times the share count: the 10-Q classifies it as Level 2 and applies a discount of about $238m for transfer restrictions, so it sits between a quoted price and a modelled one. ⚠️ SpaceX listed publicly in June 2026, so this is a marked-to-market holding in a listed company rather than a private-company valuation — which makes the mark-up more observable, and also more likely to move again.
- It is an unrealised mark-up, and Tesla says so. No cash changed hands. It can reverse.
- Tesla’s own non-GAAP measure excludes it, which is why non-GAAP EPS fell 18% while GAAP EPS fell 3%. In this quarter the adjusted number is the less flattering one — the opposite of the usual pattern, and a reasonable signal of which one carries more information about operations.
For contrast, Alphabet reported the same week with a $99.031bn net gain on equity securities that added $6.26 to its EPS . That is a portfolio-wide figure across many holdings, not a single position like Tesla’s — but it is the same accounting effect at much larger scale, at a company running the same capex-heavy playbook.
How did the stock react?
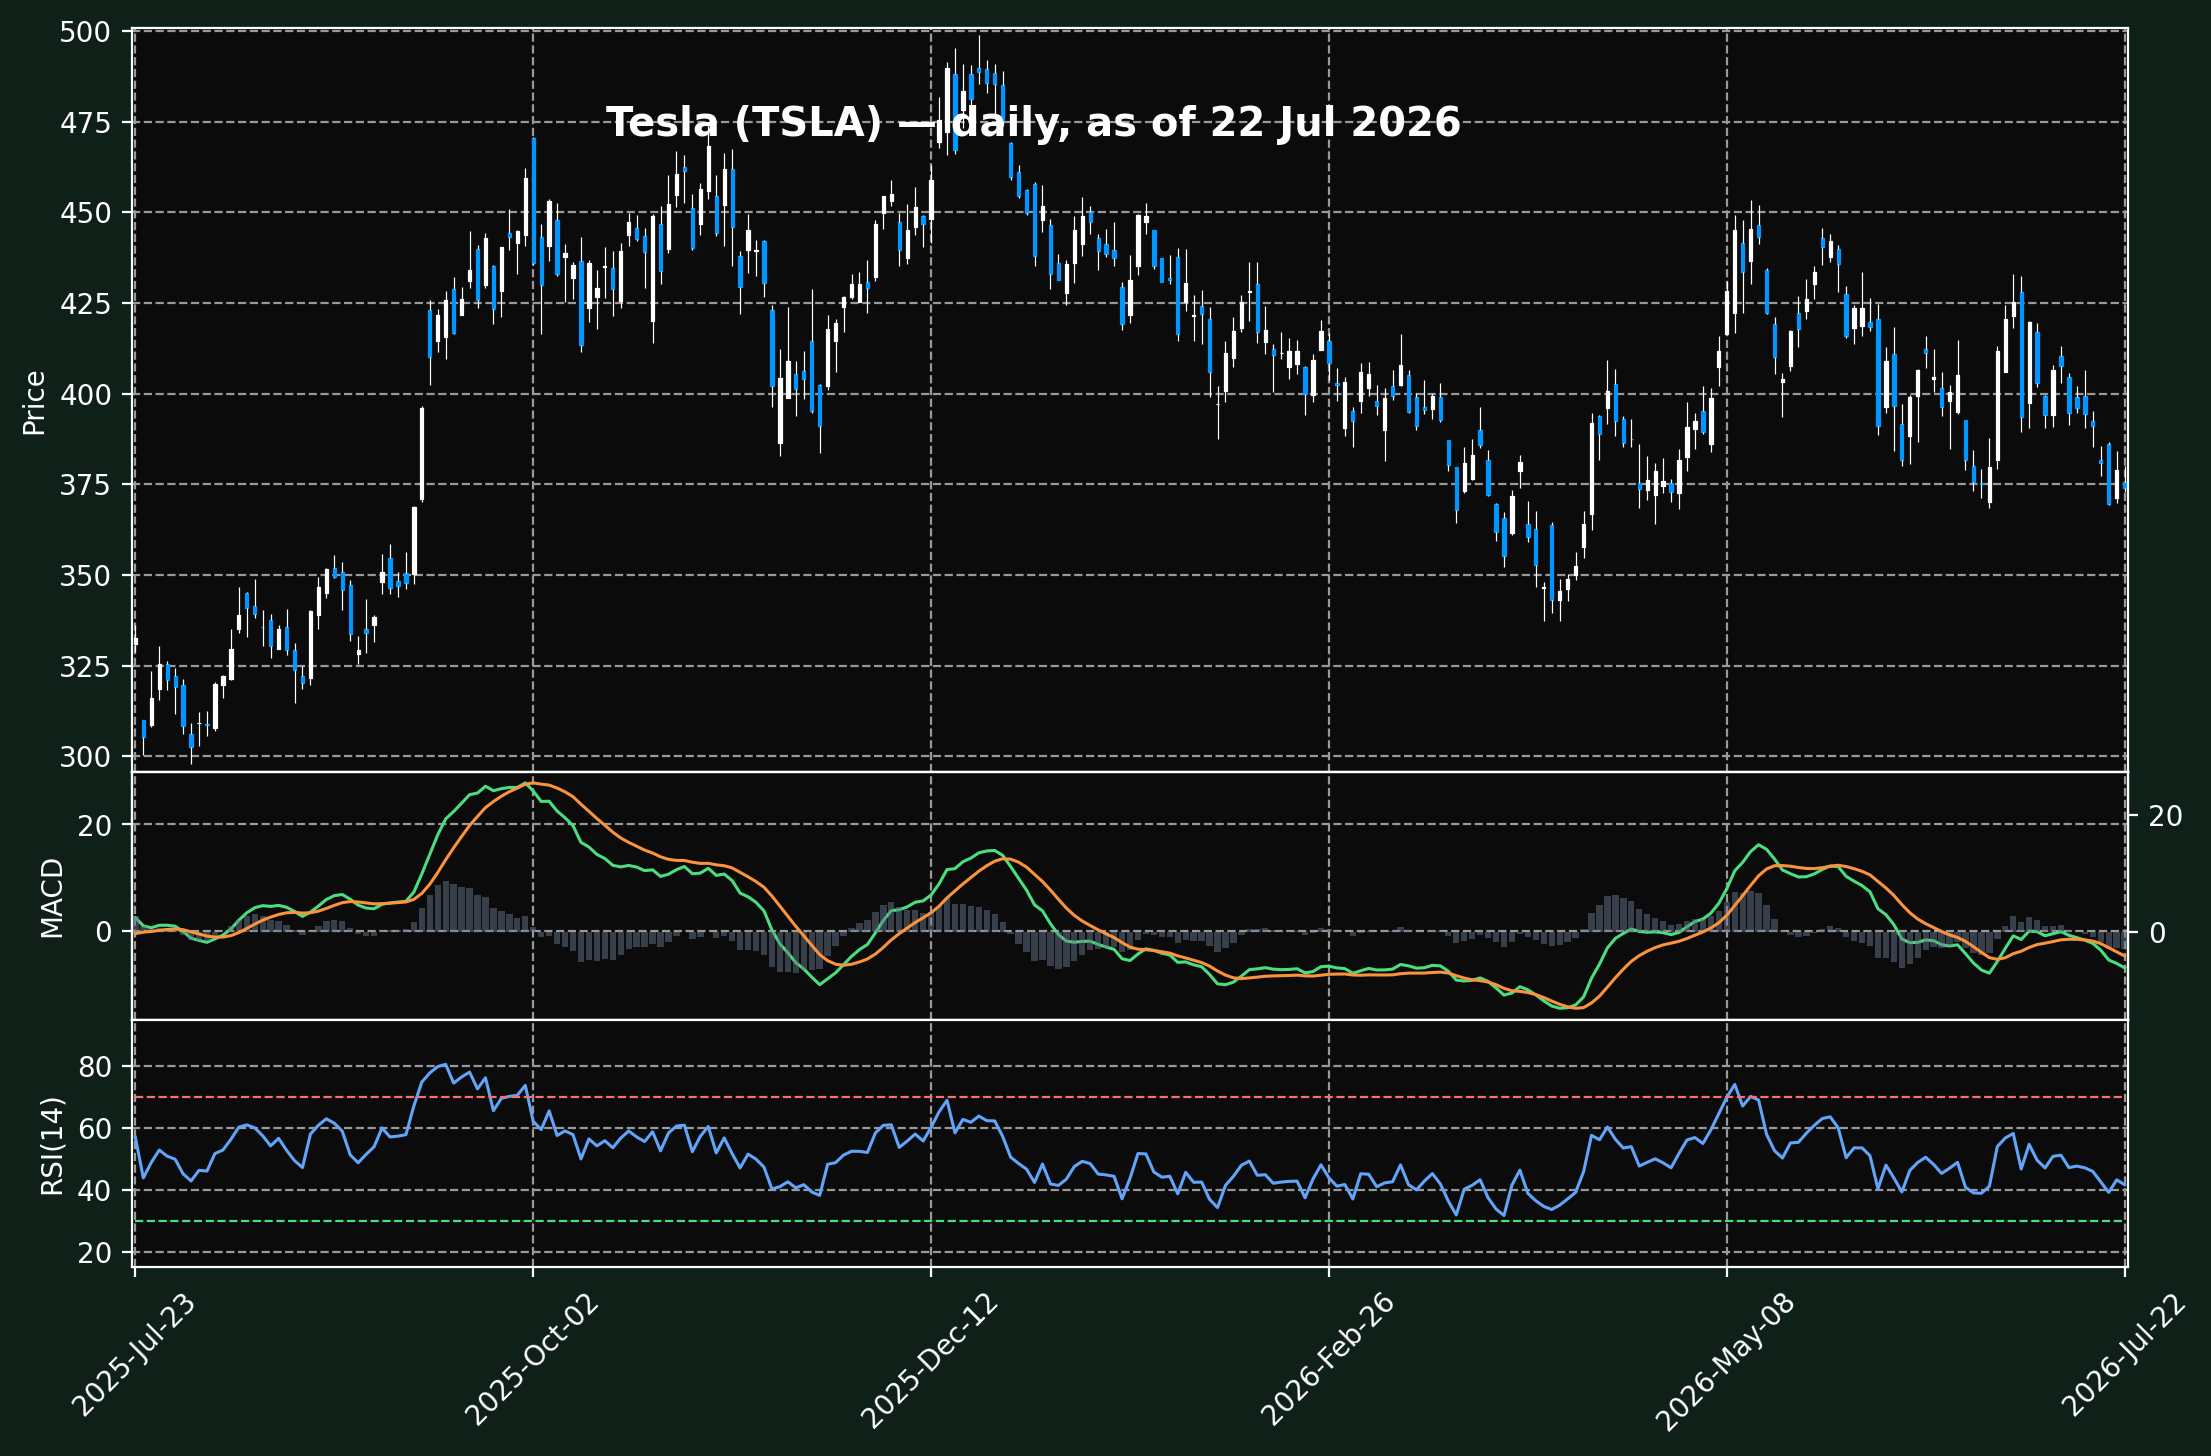
| Reading (to the 22 July close, the last completed session) | Value |
|---|---|
| Close, 22 Jul (before results) | $374.01, −1.3% |
| After-hours, shortly after the release | about −3% |
| After-hours, by the end of the earnings call | about −4% |
| Move, past five sessions | −5.2% |
| 52-week high | $498.83 |
| Distance from that high | −25.0% |
| RSI (14) | 41.7 |
| Markers meeting our filters (▼ / ▲) | none in the period |
Technical illustration based on historical prices to the 22 July 2026 close — the last completed session. MACD and RSI are lagging indicators, frequently produce false signals, do not predict future prices, and are not trading signals.
Method, so the markers can be reproduced: indicators are calculated on adjusted closes from Yahoo Finance; MACD is EMA(12) − EMA(26) with a 9-period signal line, EMAs seeded from the first observation (adjust=False); RSI is the Wilder 14-period form. A ▼ requires a bearish MACD cross with RSI above 65, a ▲ a bullish cross with RSI below 35. Indicators are computed on two years of data and then trimmed to the plotted year, because EMA and Wilder RSI are seeded from the first observation and the opening weeks of any series are warm-up artefacts — an earlier version of this chart printed a ▲ on 8 August 2025 off an unconverged RSI of 15.7, where the converged value is about 56 and there is no crossover at all.
The sequence matters. Tesla released the results after the close, so the 1.3% decline during the regular session on 22 July happened before the market had seen any of it. Extended trading showed roughly −3% shortly after the release and about −4% by the end of the earnings call.
⚠️ Everything in the table above stops at the 22 July close, which is the last completed session at the time of writing. The 23 July session was still open when this was published and the stock was trading sharply lower — but an in-progress price is not a close, and we do not quote one as if it were. The figures here will need updating once 23 July settles.
Analyst consensus for non-GAAP EPS is quoted at $0.51–$0.53 by third-party data providers, while Tesla’s own compiled consensus, published on 17 July, put it at $0.55. Against the $0.33 reported — a substantial miss on the earnings line alongside a revenue beat. Tesla also guided to continued heavy capital spending, and the scale of the second-day decline suggests the market read that as the more consequential message.
What is actually unresolved
Setting out what the filing supports, without recommending an action either way.
The spending is disclosed and attributed. Tesla attributes the operating-expense increase to AI and other R&D, stock-based compensation including the 2025 CEO Performance Award, and SG&A. That tells you where the money went; it does not by itself establish that none of it was overspend, and an earnings deck is not the kind of document that could show that either way.
Whether it converts is the open question, and this quarter cannot answer it. The same question hangs over every large capex programme currently being run on AI infrastructure: the spending is booked now, the returns are argued about later. For the sellers of the hardware it is already revenue: Dell’s AI-server boom made it one of the market’s biggest stories of 2026 , whichever way the buyers’ returns land.
Two things could restore free cash flow, and they are not equally within Tesla’s control: operating cash flow growing faster than capex, or capex stepping back down from the $5.8bn level. Neither is predictable from one quarter’s figures, and it would be overstating it to say free cash flow must stay negative — it depends on which line moves.
The margin question has a narrower answer than the headline. Vehicle economics excluding regulatory credits improved year-on-year. The 1.4% operating margin is what happens when a 47% opex increase meets a 23% gross-profit increase. If opex growth moderates, the operating margin arithmetic changes quickly.
Regulatory credits are a genuine headwind, and separate. $439m to $146m is a $293m reduction in essentially pure-margin revenue, which on its own is a meaningful share of the $525m fall in operating income.
Frequently asked questions
Is Tesla burning cash?
Not on a twelve-month view. The negative figure is for the June quarter alone. On our arithmetic from Tesla’s quarterly disclosures, trailing twelve-month free cash flow is about +$5.8bn, first-half 2026 free cash flow is +$0.352bn, and cash and investments stood at $43.524bn at quarter end, up 18% year-on-year.
Why did Tesla’s operating margin fall to 1.4%?
Operating expenses grew 47% year-on-year while gross profit grew 23%. Operating income is what is left after the first is subtracted from the second, so it fell 57% even though revenue rose 26%.
Did Tesla’s gross margin fall?
Automotive gross margin was 16.9% on a GAAP basis, against 17.2% a year earlier and 21.1% in the prior quarter. Excluding regulatory credits it was 16.3%, which is higher than the 15.0% of a year earlier but below the prior quarter’s 19.2%.
What was the SpaceX gain in Tesla’s results?
An unrealised gain of $1.005bn ($763m after tax, $0.22 per share) on Tesla’s SpaceX equity investment, which the cash flow statement shows was purchased for $2.002bn in the first quarter of 2026. It is excluded from Tesla’s own non-GAAP figures.
Why is Tesla’s GAAP EPS higher than its adjusted EPS?
Because the SpaceX mark-up and certain tax items are included in GAAP but excluded from Tesla’s non-GAAP measure, while stock-based compensation is expensed in GAAP and added back in non-GAAP. This quarter the first group outweighed the second.
Important information
This article is for informational and educational purposes only. It is not investment, financial, legal, or tax advice, and is not a recommendation, offer, or solicitation to buy, sell, or hold any security. Nothing here is tailored to your individual circumstances.
The technical analysis shown — candlesticks, MACD (12, 26, 9), RSI, and any “tops” or “bottoms” — is one interpretation of historical price data. These indicators are heuristic and lagging, frequently produce false signals, and do not predict future prices. Past performance does not guarantee future results.
Prices and indicator values are as of the date stated and change continuously; this content may be out of date by the time you read it. All investing involves risk, including the possible loss of principal.
The author is not a licensed financial adviser or broker-dealer. Do your own research and consult a qualified, licensed financial professional before making any investment decision. Drawpie and the author accept no liability for any loss arising from the use of this content. Price data via Yahoo Finance; financial data from Tesla’s SEC filings.