Social Security Insolvency Explained: Trust Fund Dates, Benefit Cuts, Taxes and Reform Options
Update log (1)
- — Added the two things the page was missing: how benefits are taxed, and what the reform options are. Both use primary sources — SSA's own consumer pages and IRS Topic 423 for taxation, and SSA's Office of the Chief Actuary for the scored provisions, which are published in the same unit as the shortfall so options can be compared without this page choosing among them. Two methodological cautions are stated rather than glossed: the scores are OASDI combined while this page's headline deficit is OASI alone, and SSA's payroll tax provisions are still on the 2025 baseline where the gap was smaller, so last year's percentages must not be pasted onto this year's shortfall. The exact benefit-taxation bands above the first threshold are deliberately not printed, because they could not be read from a primary source. Retitled to match the widened scope; the URL is unchanged.

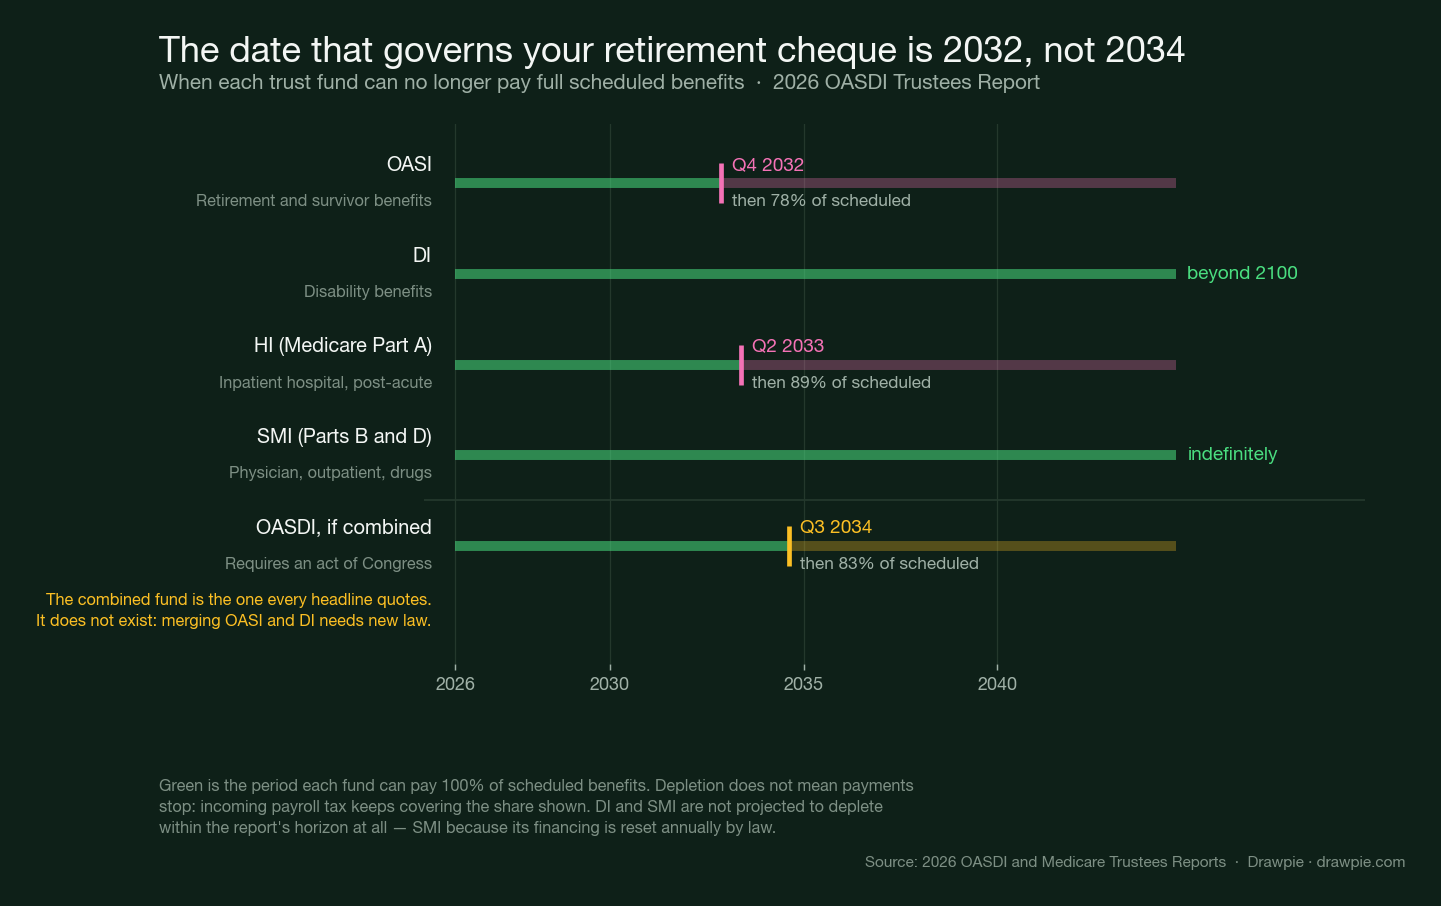
- The fund that pays retirement and survivor benefits — OASI — is projected to be depleted in the fourth quarter of 2032. That is about six years away, and it is one quarter earlier than last year’s report said.
- Depletion does not mean payments stop. Payroll tax keeps arriving, and the Trustees project it covers 78% of scheduled OASI benefits at that point — so the question is the size of a shortfall, not whether cheques arrive.
- The 2034 date in most headlines is a different fund. It is the hypothetical combined OASDI figure, and the report states plainly that OASI and DI cannot be combined without a change in the law. No such law exists.
- 78% is the starting point, not the floor. The Trustees project the OASI payable share falling to 62% by 2100. On the combined basis it falls from 83% to 65%.
- The disability fund is the opposite story: DI can pay full benefits through at least 2100 and is the only one of the four funds with a positive 75-year balance, at +0.13% of taxable payroll against OASI’s −4.55%.
- Removing the payroll tax cap does not fix it. SSA’s actuaries score it at 67% of the long-range shortfall if the new earnings earn no extra benefit, and 48% if they do — and only 54% and 28% respectively in the 75th year.
- Benefits become taxable above $25,000 of combined income filing individually and $32,000 jointly, with up to 85% of a benefit reachable. The taxable maximum is wage-indexed every year; those thresholds are published as flat dollar amounts.
The retirement fund is projected to run short in late 2032 — about six years from now. At that point the Trustees project incoming payroll tax would cover 78% of scheduled benefits.
That is not the number in most headlines. Most say 2034 and 83%, and those figures describe a fund that does not legally exist.
Here is what the 2026 Trustees Report actually says, fund by fund.
When does Social Security run out of money?
It depends which fund you mean, and that is the whole problem with the question. There are four, they are legally separate, and they are in very different shape.
| Fund | Pays for | Full until |
|---|---|---|
| OASI | Retirement, survivors | Q4 2032, then 78% |
| DI | Disability | at least 2100 |
| HI | Medicare Part A | Q2 2033, then 89% |
| SMI | Medicare Parts B and D | indefinitely |
| OASDI combined | hypothetical fund | Q3 2034, then 83% |
If you are asking about your retirement cheque, the answer is OASI, and the answer is the fourth quarter of 2032 — roughly six years away, and one quarter earlier than the 2025 report projected.
If you are asking about disability benefits, there is no depletion date in the projection at all. DI can pay full scheduled benefits through at least 2100, which is the end of the report’s horizon. Last year’s report said 2099, so it improved.
Does “depletion” mean Social Security stops paying?
No, and this is the most consequential misunderstanding in the whole subject. “Depleted” means the reserve is exhausted — not that income stops.
Social Security is funded mainly by payroll tax on current workers. That tax keeps arriving after the reserve is gone. What the reserve does is cover the gap between what comes in and what is scheduled to go out; once it is empty, the programme can only pay out what comes in.
So the question at depletion is not whether cheques arrive. It is how much smaller they are:
- OASI at depletion: 78% of scheduled benefits. A benefit scheduled at $2,000 would be about $1,560 on those projections, absent legislation.
- HI at depletion: 89% of scheduled Part A benefits.
There is also no automatic mechanism for how a shortfall would be applied. The law does not specify whether it would fall as an across-the-board percentage cut, a delay, or something else — that would be a decision, and it has not been made.
Why does everyone say 2034 when the report says 2032?
Because 2034 is the number for a fund that would require an act of Congress to exist.
The Trustees do publish a combined OASDI projection, and it is genuinely useful as a summary of the programme’s overall shape. But the report’s own sentence introducing it contains the caveat, and the caveat is usually what gets cut:
The two funds could not actually be combined unless there were a change in the law.
No such law has been passed. OASI and DI are separate by statute, each pays only what it is permitted to pay, and money cannot move between them. Congress has authorised temporary reallocations before — most recently in 2015 — but each one required legislation, and none is in force now.
The practical consequence is a two-year difference in the date and a five-point difference in the cut:
| OASI | If combined | |
|---|---|---|
| Depletion | Q4 2032 | Q3 2034 |
| Payable then | 78% | 83% |
| Payable by 2100 | 62% | 65% |
Neither figure is wrong. The combined one just answers a question about a fund nobody has created.
How much would benefits be cut, and for how long?
78% is where it starts, not where it settles. The Trustees project the OASI payable share continuing to fall after depletion, reaching 62% by 2100.
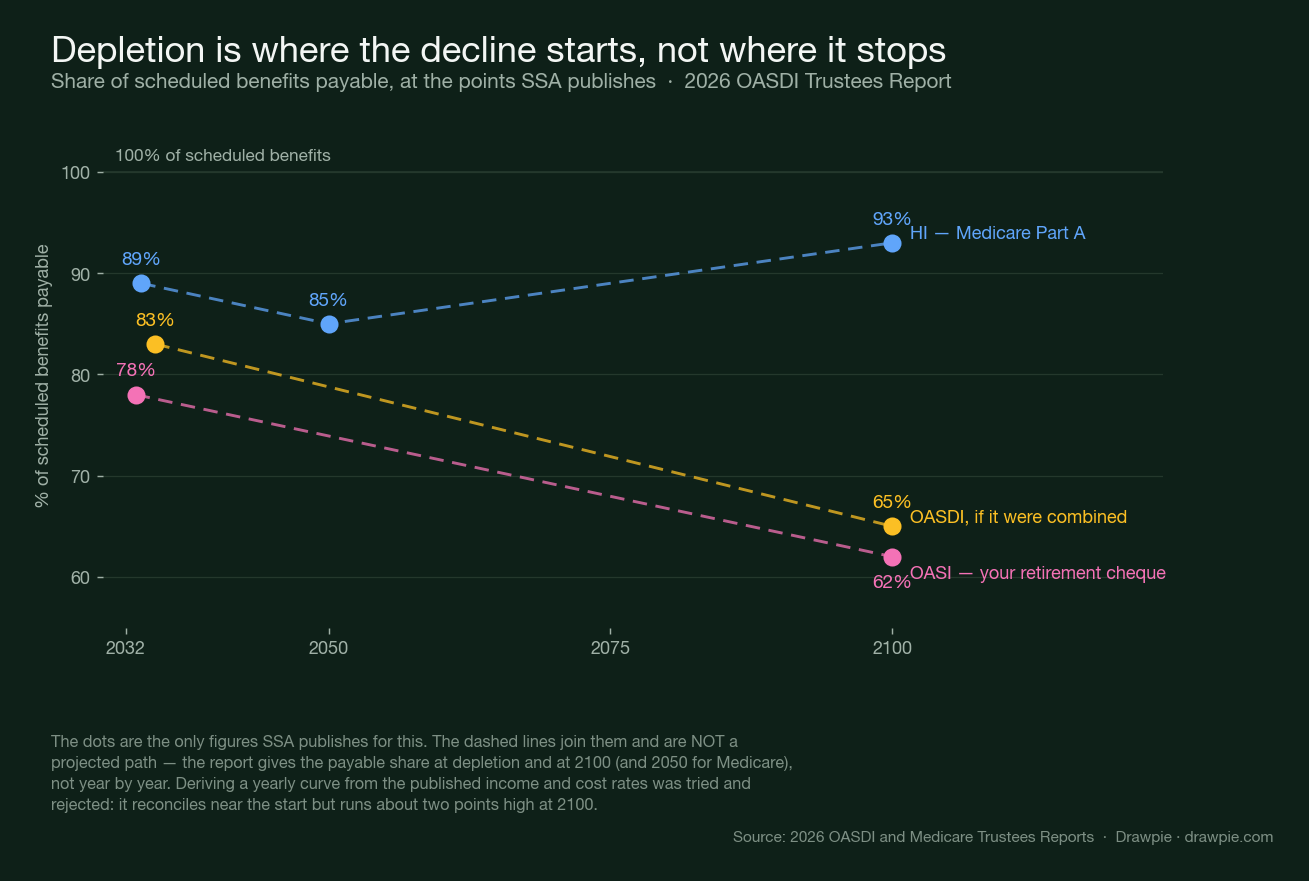
Medicare Part A goes the other way in the long run — down to 85% by 2050, then back up to 93% by 2100.
The reason the two diverge is demographic rather than financial. The report attributes the rise in cost rates for both programmes mainly to the decline in fertility rates and the resulting ageing of the population, an effect its assumptions have stabilising after 2080. Health costs and Social Security costs respond to that differently over the very long run.
The underlying gap for Social Security is a persistent one, not a spike:
| OASDI as a whole | 2026 | Long run |
|---|---|---|
| Cost, % of taxable payroll | 15.37% | 20.45% by 2085 |
| Income, % of taxable payroll | 12.91% | 13.45% by 2100 |
Costs rise by about five points of payroll; income rises by about half a point. That divergence is the entire story, and it is why the shortfall does not close on its own.
Is Medicare in the same position?
Part A is, on a similar timetable. Parts B and D are not, and the reason is structural rather than a matter of better health.
HI (Part A) is funded much like Social Security, from a dedicated payroll tax, and it faces the same kind of squeeze: depletion in Q2 2033, one quarter earlier than last year, and 89% payable at that point.
SMI (Parts B and D) is described by the Trustees as adequately financed into the indefinite future — but not because it is cheap. It is because its financing is reset every year by law: beneficiary premiums and a general-revenue contribution are set annually at whatever level covers projected costs. A fund that is topped up by design cannot deplete. The cost shows up as higher premiums and a larger general-revenue draw instead.
You can see that in the 2026 numbers: the standard Part B premium is $202.90 a month, with an income-related surcharge starting above $109,000 of modified adjusted gross income for single filers and $218,000 for joint filers, adding between $81.20 and $487.00 a month. The Part D base beneficiary premium is $38.99.
What has changed since last year’s report?
Modestly worse for the two payroll-funded funds, modestly better for disability:
| 2026 report | vs last year | |
|---|---|---|
| OASI depletion | Q4 2032 | one quarter earlier |
| HI depletion | Q2 2033 | one quarter earlier |
| OASDI combined | Q3 2034 | unchanged |
| DI full benefits through | 2100 | one year later (was 2099) |
The “vs last year” column is the report’s own wording. The 2025 dates themselves are not quoted here, because “one quarter earlier” is what the 2026 report states and back-calculating a prior-year date from it would be our arithmetic presented as SSA’s.
There is also a procedural signal worth knowing about. When a fund’s assets are projected to fall below 20% of annual cost within ten years, the Trustees are required to notify Congress. Those letters have been sent, to the President of the Senate and the Speaker of the House, and they are published alongside the report.
And the short-range measure has been failing for years: OASI has not been adequately financed on the Trustees’ short-range test since 2019. Its trust fund ratio was 153% at the start of 2026 and is projected to fall below 100% by the start of 2029 — meaning reserves would no longer cover even a single year of benefits.
How big is the gap, in one number?
4.55% of taxable payroll, for OASI over 75 years. That is the actuarial deficit: the size of the permanent annual gap between what the fund is projected to take in and what it is scheduled to pay out, expressed as a share of all wages subject to Social Security tax.
| Fund | 75-year actuarial balance |
|---|---|
| OASI | −4.55% |
| DI | +0.13% |
| HI | −0.56% |
| OASDI combined | −4.42% |
Two things stand out. DI is the only one of them in surplus — the disability programme is not the part under strain, despite being the part most often described that way. And the combined deficit is smaller than OASI’s alone, precisely because DI’s surplus offsets part of it — which is another way of seeing why the combined figure flatters the retirement picture.
What that number does not do is prescribe anything. A gap of 4.55% of payroll can be closed from the revenue side, the benefit side, or both, in an unlimited number of combinations. Choosing among them is a political question, and this page does not have an opinion on it.
How your benefits are taxed
This is a separate question from solvency, and it is the one that lands on an actual household.
Social Security benefits are subject to federal income tax once your income passes a threshold. SSA states it as $25,000 a year filing individually and $32,000 filing jointly, measured on combined income rather than on your benefit alone.
The mechanics, per the IRS: you take your modified adjusted gross income, add half of the benefits you received, and compare the total against the base amount for your filing status. Under current law, up to 85% of benefits can end up in taxable income — that ceiling is written into SSA’s own description of current law in its reform menu.
This page is not going to print the exact bands, because the figures published on SSA’s own consumer pages stop at the first threshold and the IRS refers the calculation to Publication 915 and the Form 1040 worksheet rather than tabulating it. Those are the authorities for what you personally would owe.
If you want the tax taken as you go rather than in a lump at filing, SSA lets you withhold 7%, 10%, 12% or 22% of a monthly payment.
The detail almost nobody mentions
The taxable maximum moves every year. The benefit-taxation thresholds do not appear to.
Put SSA’s two pages side by side and the contrast is stark. The contribution and benefit base — the ceiling on earnings subject to payroll tax — is explicitly described as changing annually with the national average wage index, and for 2026 it is $184,500. The benefit-taxation thresholds are published as flat dollar amounts with no such mechanism attached.
There is a second piece of evidence, from an unexpected place: SSA’s own catalogue of reform proposals. One option would raise the thresholds to $50,000 and $100,000; another sets out a year-by-year schedule of increases; a third specifies that its new thresholds would be updated for wage growth in later years. A proposal only needs to specify indexing if current law does not already do it.
That is an inference rather than a quoted statement, and it is labelled as one. But the consequence is arithmetic: if wages and benefits rise while a dollar threshold sits still, the share of beneficiaries who cross it rises on its own, without anyone voting for it.
What the reform options actually are
The gap can be closed many ways, and there is a genuinely non-partisan way to look at the menu: SSA’s Office of the Chief Actuary scores individual proposals in the same unit the Trustees use for the shortfall — percent of taxable payroll — and publishes how much of the gap each one closes.
That is why this section uses the actuaries rather than any advocacy group’s arithmetic. It means options can be compared without anybody here choosing between them.
The office groups them into ten categories: cost-of-living adjustment, the level of monthly benefits, retirement age, benefits for family members, payroll taxes including the taxable maximum, coverage of employment and other revenue sources, investment in marketable securities, taxation of benefits, individual accounts, and combinations of all of them.
Would taxing earnings above the cap fix it?
No — and the answer is more interesting than that.
Today, earnings above $184,500 are not subject to the 12.4% Social Security payroll tax. “Scrap the cap” is the most-discussed single fix there is. SSA’s actuaries have scored it both ways:
| Provision | Long-range shortfall closed | In the 75th year |
|---|---|---|
| Eliminate the taxable maximum, no benefit credit for the new earnings | 67% | 54% |
| Eliminate the taxable maximum, with benefit credit for the new earnings | 48% | 28% |
Neither closes the gap. The larger version gets about two-thirds of the way over 75 years, and only just over half of the way in the final year — which matters, because a fix that fades is a fix that has to be revisited.
And the gap between the two rows is the part worth sitting with. Whether those newly taxed earnings also count towards the payer’s future benefit nearly halves the repair. That is a design choice buried inside a slogan, and it is worth more than a third of the effect.
Two cautions on those numbers
They are OASDI combined, not OASI alone. Everything in the scoring above is measured against the two funds together. The headline number on this page — the 4.55% deficit — is the retirement fund on its own. The combined figure is 4.42%. Mixing the two would overstate how much any option achieves.
They sit on different baselines. SSA is midway through updating its provision estimates to the 2026 Trustees Report. The taxation-of-benefits options are already on the 2026 basis; the payroll tax options, including the two in the table above, are still on the 2025 report, where the combined current-law balance was −3.82% rather than −4.42%. The gap has widened since. The same provisions would close a somewhat smaller share of the larger 2026 gap, and any table that pastes last year’s percentages onto this year’s shortfall is quietly wrong.
That is not a reason to distrust the figures. It is a reason to read the date on them — which is the same discipline the rest of this page runs on.
What this page cannot tell you
What your own benefit will be. These are projections about a fund, not about a person. Nothing here models an individual benefit, and it should not be used to decide when to claim.
What Congress will do. Every projection here assumes current law continues unchanged, which is the one assumption almost certain to be wrong over six years — the programme has been amended repeatedly, usually close to a deadline. The report projects a scenario; it does not forecast politics, and neither do we.
Whether the intermediate assumptions are right. SSA also publishes low-cost and high-cost scenarios with materially different dates. This page uses the intermediate set, which the Trustees label their best estimate, and does not average across them or argue for one.
The dates will move again. The Trustees Report is annual. OASI’s date moved a quarter earlier this year, and HI’s did too. A year from now there will be a 2027 report, and the honest expectation is that these numbers will be slightly different again.
Sources
| Source | Used for |
|---|---|
| Summary of the 2026 Annual Reports (SSA) | Every depletion date and payable percentage, Table 1’s actuarial balances, the combined-fund caveat, the cost and income rate trajectories, the trust fund ratio, the fertility-rate attribution and the 2026 Medicare premium figures |
| The 2026 OASDI Trustees Report (SSA) | The report itself, and the statutory letters to Congress on fund assets falling below 20% of annual cost |
| Table IV.B1 — Annual Income Rates, Cost Rates, and Balances | The annual rate series used to test, and then reject, a derived payable-share curve |
| Individual Changes Modifying Social Security (SSA OACT) | The ten categories of scored reform provision, and which categories sit on the 2026 baseline against the 2025 one |
| Provisions Affecting Payroll Taxes, 2025 basis (SSA OACT) | The two taxable-maximum options and their scored effect: 67% and 48% of the long-range shortfall, 54% and 28% in the 75th year |
| Provisions Affecting Taxation of Benefits (SSA OACT) | Current law allowing up to 85% of benefits in taxable income, and the proposals whose stated feature is raising or indexing the thresholds |
| Contribution and Benefit Base (SSA) | The 2026 taxable maximum of $184,500, and that it is wage-indexed annually |
| Request to withhold taxes (SSA) | The $25,000 and $32,000 combined-income thresholds and the 7/10/12/22% withholding options |
| Topic no. 423 (IRS) | That the test is modified AGI plus half of benefits against a base amount, and that the exact computation lives in Publication 915 rather than on the topic page |
How we verified this
Every figure is from the 2026 OASDI Trustees Report and its official summary, published by the Social Security Administration and read on 28 August 2026. SSA output is a work of the US federal government, so it carries no copyright and can be redistributed and charted freely — which is why it is the only source used here. No think-tank summary, advocacy estimate or news report is relied on for any number.
🔴 A derived curve was built, checked against SSA’s own published figures, and thrown away. SSA publishes the payable share only at anchor points, not year by year. Table IV.B1 gives annual income and cost rates, so income divided by cost looks like it should reproduce the payable share. It does not reconcile:
| derived ratio | SSA publishes | gap | |
|---|---|---|---|
| OASI 2033 | 78.9% | 78% | +0.9 |
| OASI 2100 | 63.9% | 62% | +1.9 |
| OASDI 2035 | 83.4% | 83% | +0.4 |
| OASDI 2100 | 67.2% | 65% | +2.2 |
The ratio runs systematically high at the far end, because income includes revenue from taxing benefits and that revenue falls when benefits are cut — a feedback SSA’s calculation carries and a naive ratio does not. Matching near the start is not validation when the far end is off by more than two points, so the chart plots only SSA’s published anchors and labels the lines between them as connectors rather than as a projected path.
⚠️ The distinction this page turns on is the report’s own, quoted rather than inferred. The summary says that if the two funds “were combined, the resulting projected fund (designated OASDI) would be able to pay 100 percent of total scheduled benefits until the third quarter of 2034”, and immediately adds: “The two funds could not actually be combined unless there were a change in the law”. Both halves of that sentence come from the same paragraph; the second half is the one that usually gets dropped.
Quarters are reported as SSA reports them. The report gives depletion by calendar quarter, not by date. Where this page converts to “about six years”, it is measured from 28 August 2026 to the start of the stated quarter, and that is an approximation of a quarter-resolution projection — not a day.
⚠️ These are projections under one set of assumptions, and the report says so. The non-health assumptions were set in February 2026 under the intermediate (“best estimate”) scenario. SSA also publishes low-cost and high-cost scenarios with materially different dates, which this page does not use and does not average.
⚠️ Nothing here is financial advice, and no page can tell you what your own benefit will be. This describes a published government projection about a fund. It does not model any individual’s benefit, does not recommend when to claim, and makes no prediction about what Congress will or will not do.