Silver Price 2026: Latest Price, Fed Outlook & Supply Deficit

- Silver’s front-month COMEX future settled at $69.47 on 21 August 2026, the last completed session before this was written. That is 1.0% below its 31 December 2025 close of $70.13 — a full year of movement that has arrived back where it began.
- The path there was violent. Silver closed at $115.08 on 26 January 2026, fell 51.4% to $55.9 by 16 July 2026, and has since recovered 24.3%.
- It is still 39.6% below the January high. A 51% fall needs a 106% rise to undo, which is the arithmetic most drawdown coverage skips.
- The Fed has not cut this year. At its July meeting it held the target range at 3.50–3.75% on a 9–3 vote, with all three dissenters wanting a hike rather than a cut.
- The supply-deficit figures in circulation do not agree with each other. Coverage of the same 2026 projection cites both 46.3 million ounces and 215 million ounces, and the Silver Institute’s own site did not surface either number to us.
Silver settled at $69.47 an ounce on 21 August 2026, and that is almost exactly where it started the year. The front-month COMEX future closed 2025 at $70.13; it is now 1.0% below that. A flat year, on the face of it.
The face of it is misleading. Getting back to flat took a 51.4% collapse and a 24.3% recovery, and silver is still 39.6% below the high it set in January.
What is the silver price right now?
$69.47 per troy ounce, the settled close on 21 August 2026 — the last completed session before this was written.
That figure is the front-month COMEX futures contract, not spot silver. The two track each other but do not print the same number, so if a quote you are comparing against differs by a few tens of cents, that is usually why rather than either being wrong.
What has silver done in 2026?
A round trip. It closed at $115.08 on 26 January 2026, its high for the year so far. By 16 July 2026 it had closed at $55.9 — a fall of 51.4% in under six months. Since that low it has recovered 24.3%.
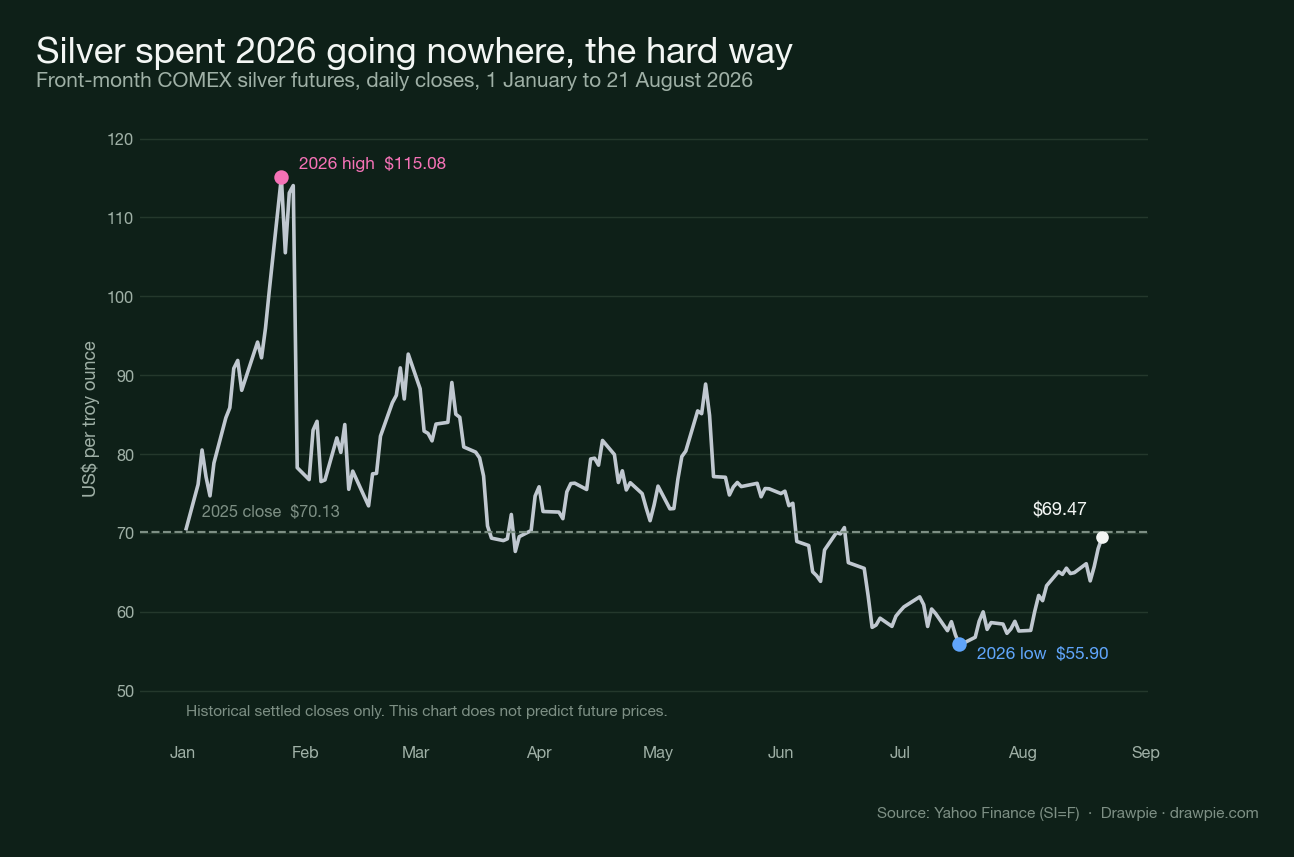
The dashed line on that chart is the 2025 close. The year’s entire drama sits either side of it, and the price has ended up back on it.
Why does being 40% below the high matter more than being 1% below the year’s start?
Because the two numbers describe different problems. Down 1.0% on the year sounds like nothing happened. Down 39.6% from the high is the number that matters to anyone who bought in the first quarter.
The arithmetic is worth stating plainly, because coverage of drawdowns routinely skips it: a 51.4% fall requires roughly a 106% gain to get back to where it started. Silver has done 24.3% of that work. Percentages down and percentages up are not symmetrical, and the gap widens the deeper the fall.
How does 2026 compare with 2025?
2025 was the year of the move; 2026 has been the year of the round trip. Silver traded between $29.12 and $77.37 during 2025 and finished at $70.13. In other words it roughly doubled over that year.
Set against that, January’s $115.08 looks less like a new plateau and more like the last leg of the prior year’s run. The subsequent fall took silver back inside the 2025 range rather than below it.
The month-end closes make the shape clearer than any single statistic. Silver ended January at $78.29, February at $92.68, and then spent March to May in the seventies — $74.69, $73.53, $75.62 — before June and July took it to $59.48 and $57.59. August has brought it back to $69.47. Five of the eight months closed within about ten dollars of each other; the year’s story is two sharp moves and a lot of chop between them.
What has the Fed actually done this year?
It has not cut. At the July FOMC meeting the Committee held its target range at 3.50–3.75%, and did so on a 9–3 vote in which all three dissenters wanted a quarter-point hike.
That is worth stating precisely because “Fed outlook” is usually shorthand for an expected cut. The most recent decision on the record went the other way in its dissents. What the next meeting does is not something this article will guess at; what the last one did is a matter of record, and the direction of the dissent is part of it.
The link between rates and precious metals is real but looser than it is usually drawn. Higher rates raise the opportunity cost of holding an asset that pays nothing, which is the standard argument for why metals fall when the Fed is hawkish. Silver’s own year does not track it cleanly: the biggest fall came through June and July while policy sat still, and the recovery since has come with no change in the target range at all.
Is silver really running a supply deficit?
The industry’s own body says the market has run consecutive annual deficits, and that claim is not seriously disputed. What is disputed — or at least inconsistent — is the size.
Coverage of the Silver Institute’s 2026 projection cites a deficit of 46.3 million ounces in some places and 215 million ounces in others. Those cannot both be describing the same quantity. The Institute’s own supply-and-demand page carries historical background rather than a current balance, and its news pages did not surface either figure when we looked.
Why do the deficit numbers disagree?
We do not know, and that is the honest answer. The plausible explanations are mundane — different definitions of the balance, different treatment of exchange stocks and investment demand, or one figure being a cumulative drawdown rather than a single year — but we could not confirm which applies without the underlying survey.
What we will not do is pick the more dramatic number because it makes a better sentence. If you need the figure for anything that matters, go to the survey itself rather than to any article, this one included.
There is also a point about what a deficit does and does not tell you. A physical shortfall is met from above-ground stocks, and those stocks are large; a market can run a deficit for years without running out of metal. That is why a multi-year deficit is a supply-and-demand fact rather than an argument about price, and why this page reports it as one.
What should you watch from here?
The things that are dated and checkable, rather than the things that are predicted.
| What to watch | Why it is checkable |
|---|---|
| FOMC decisions | The target range and the vote split are published |
| The Silver Institute survey | It is the source everyone paraphrases |
| Exchange stock reports | Physical flows are reported, not forecast |
| The 2026 high and low | $115.08 and $55.9 are fixed reference points |
This article does not forecast the silver price and does not carry anyone else’s price target. What it can do is set out what has already happened precisely enough that you can read the next headline against it.
Important information
This article is for informational and educational purposes only. It is not investment, financial, legal, or tax advice, and is not a recommendation, offer, or solicitation to buy, sell, or hold any security or commodity. Nothing here is tailored to your individual circumstances.
The chart shows historical settled front-month COMEX silver futures closing prices. It is an illustration of what has already happened and does not predict future prices. Past performance does not guarantee future results.
This article contains no price forecast, and quotes no third-party price target, for silver or for anything else. It also contains no “key levels”, support, or resistance framing, because those are price calls in another vocabulary.
Prices are as of the dates stated and change continuously; this content may be out of date by the time you read it. All investing involves risk, including the possible loss of principal.
The author is not a licensed financial adviser or broker-dealer. Do your own research and consult a qualified, licensed financial professional before making any investment decision. Drawpie and the author accept no liability for any loss arising from the use of this content. Price data via Yahoo Finance.