Nike Spent Years Moving Sales In-House. Its Own Numbers Show That Reversing

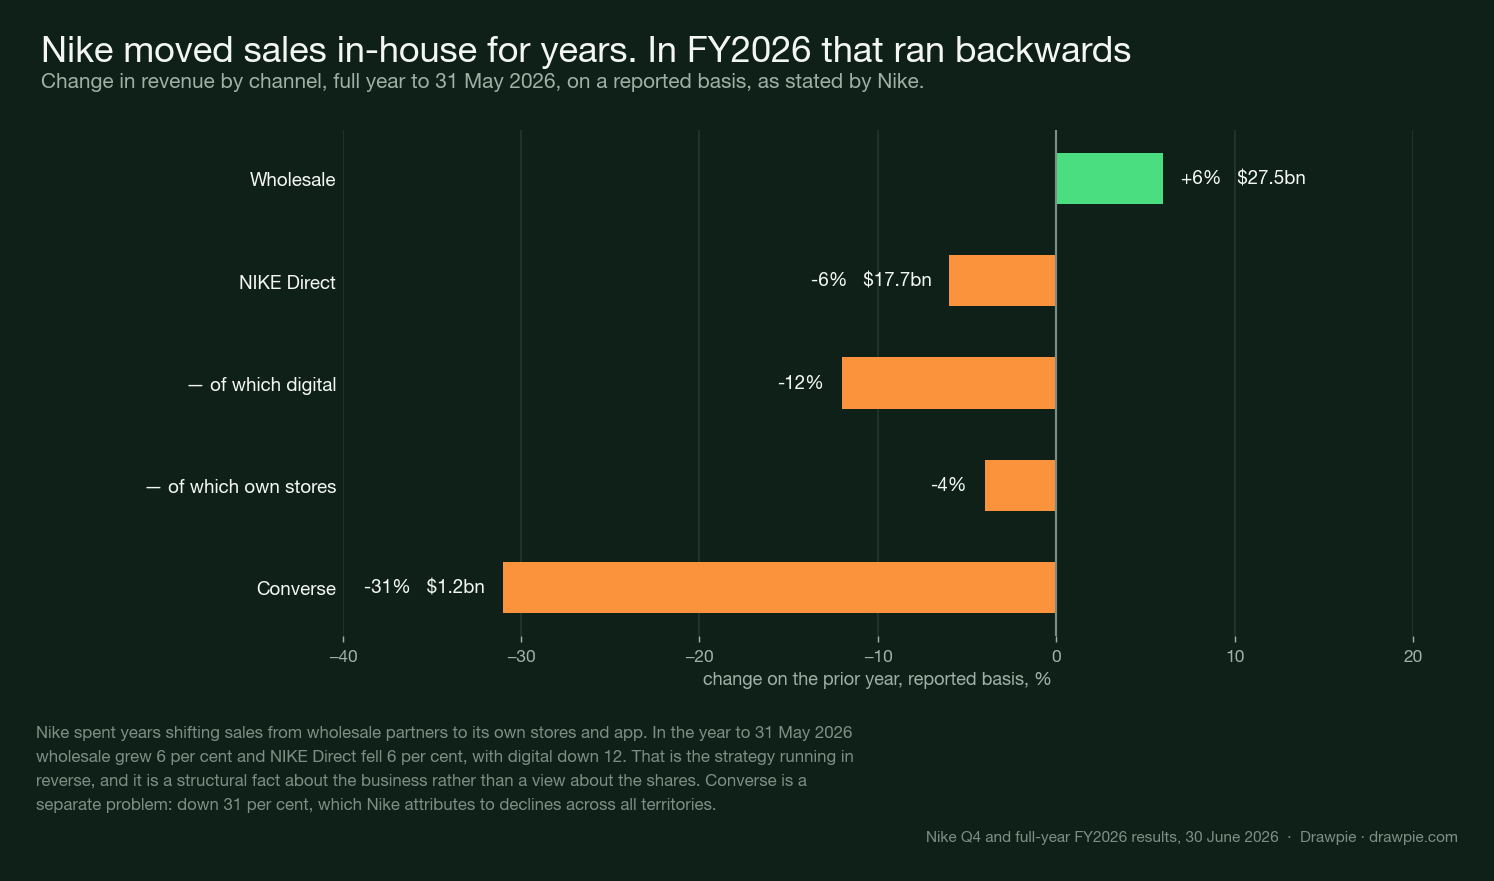
- In the year to 31 May 2026, Nike’s wholesale revenue rose 6% while NIKE Direct fell 6% and NIKE Brand Digital fell 12%. The direct-to-consumer shift ran backwards.
- Full-year revenue was $46.4 billion — flat on a reported basis, down 2% currency-neutral.
- Net income was $3.1 billion, down 3%, and diluted EPS was $2.10, also down 3%.
- Compare quarters year on year and revenue is within a point or so each time while net income falls by a third or more.
- Fourth-quarter profit rose 407% and gross margin rose 890 basis points to 49.2%. Nike states that about 900 of those basis points came from an expected tariff recovery of $986 million.
- Of the quarter’s $0.72 diluted EPS, Nike says $0.52 was that tariff benefit.
- Converse revenue fell 31% for the year, which Nike attributes to declines across all territories.
- The shares closed the last five calendar years lower each time and are about 78% below their late-2021 weekly high.
In the year to 31 May 2026, Nike’s wholesale business grew 6% and its own direct channel shrank 6%. Digital fell 12%.
That is the strategy Nike spent the best part of a decade building — selling more through its own stores and app, less through other people’s shops — running in reverse. It is also the clearest thing in the filings, and it is not what most of the commentary is about.
Direct down, wholesale up
| Channel, FY2026 | Revenue | Change, reported |
|---|---|---|
| Wholesale | $27.5bn | +6% |
| NIKE Direct | $17.7bn | −6% |
| — of which NIKE Brand Digital | −12% | |
| — of which NIKE-owned stores | −4% | |
| Converse | $1.2bn | −31% |
Digital falling 12% in a year is the number to sit with. Nike’s direct model was built on the idea that it could own the customer relationship and keep the retailer’s margin. In FY2026 the channel that was supposed to grow shrank fastest, and the one it was moving away from grew.
Nike attributes the NIKE Brand decline primarily to Greater China and EMEA, partially offset by growth in North America — for both the quarter and the year.
What the share price has done
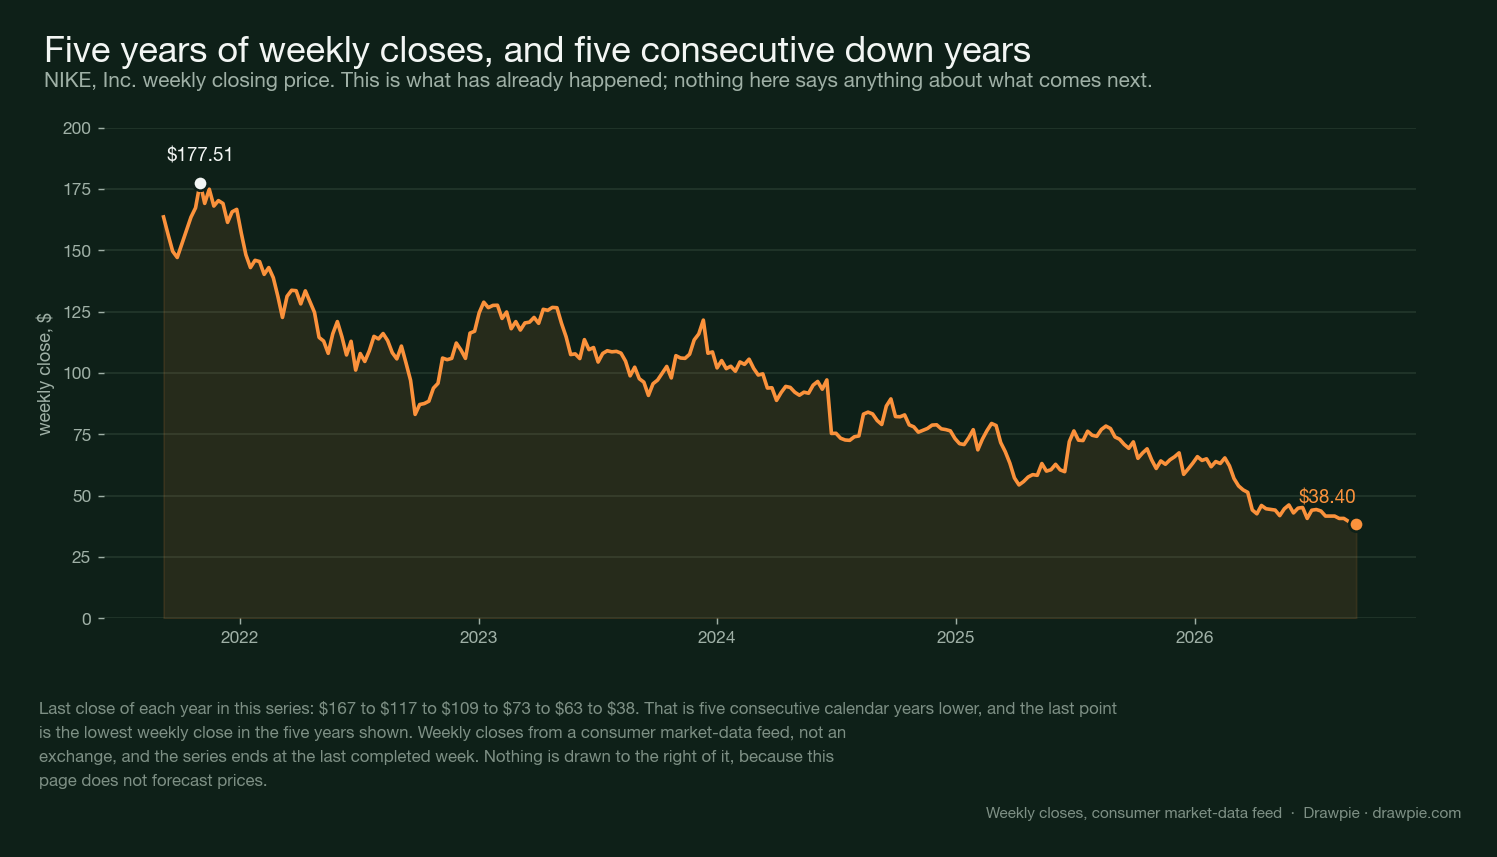
Five consecutive calendar years lower. Last close of each year in the series:
| Year | Close |
|---|---|
| 2021 | $166.67 |
| 2022 | $117.01 |
| 2023 | $108.57 |
| 2024 | $73.31 |
| 2025 | $63.28 |
| 2026, to 5 September | $38.40 |
The weekly high in the five years shown is $177.51, in the week of 1 November 2021. The most recent weekly close is about 78% below it.
We checked that against a split before quoting it. A fall that size can be an unadjusted stock split rather than a decline. It is not: the largest single-week fall in the series is 22.4%, in the week of 24 June 2024, and the rest is spread across five years.
Revenue flat, profit down
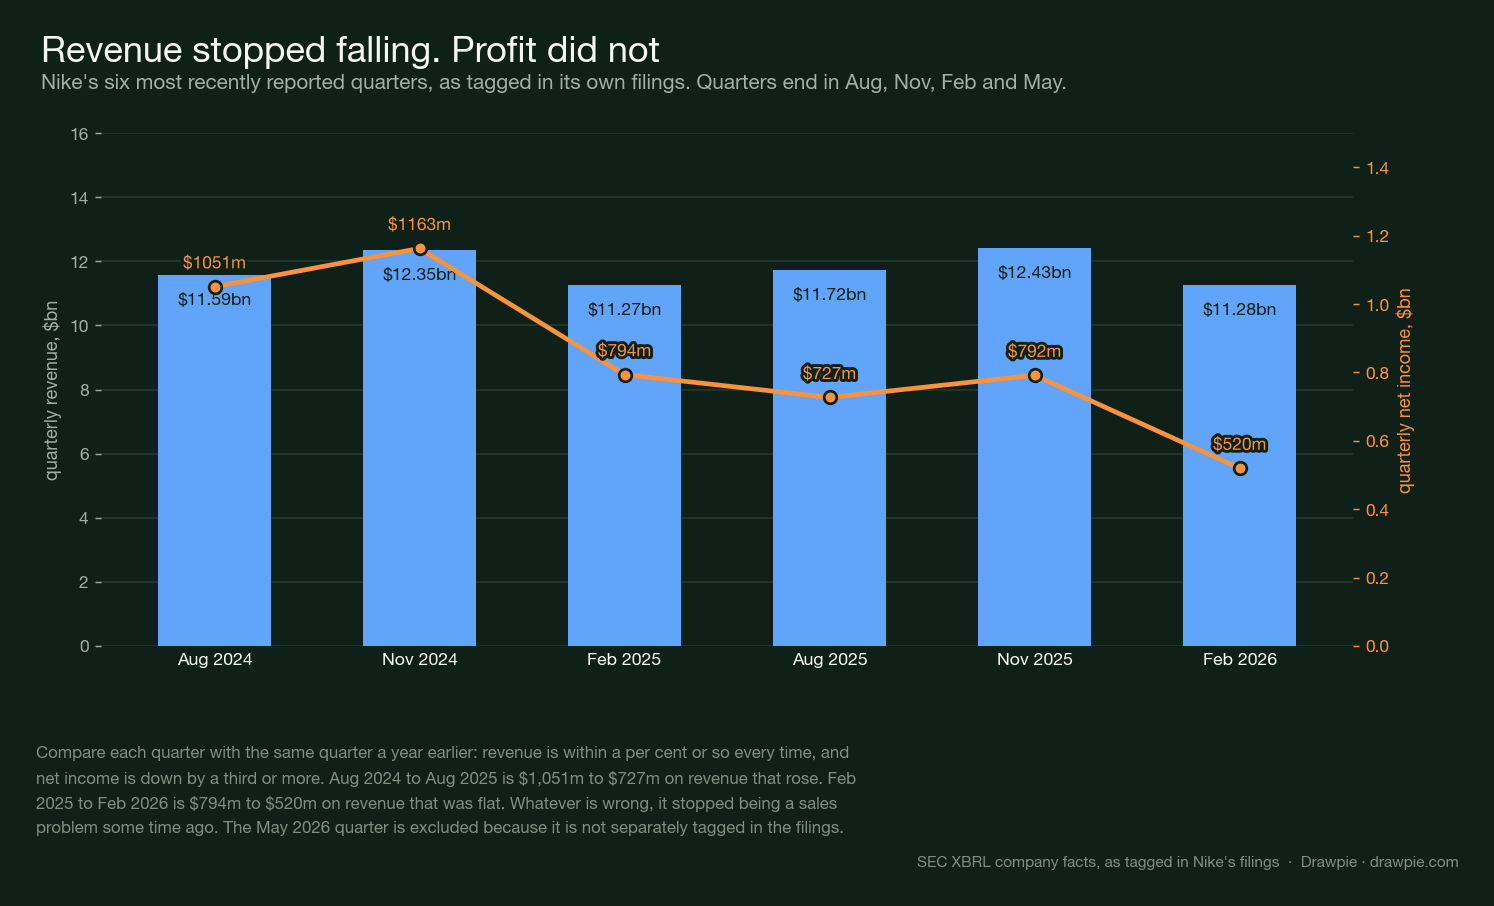
This is the part that reframes the question.
| Quarter ending | Revenue | Net income |
|---|---|---|
| Aug 2024 | $11.59bn | $1,051m |
| Aug 2025 | $11.72bn | $727m |
| Nov 2024 | $12.35bn | $1,163m |
| Nov 2025 | $12.43bn | $792m |
| Feb 2025 | $11.27bn | $794m |
| Feb 2026 | $11.28bn | $520m |
Line up each quarter against the same quarter a year before. Revenue is within about a percent every time — in two of the three it actually rose. Net income is down roughly a third in each pair.
So whatever is wrong stopped being a sales problem some time ago. Nike is selling about the same amount of product and keeping considerably less of it. For the full year: revenue $46.4bn, flat reported and down 2% currency-neutral; net income $3.1bn, down 3%; diluted EPS $2.10, down 3%.
The company’s own framing. CFO Matthew Friend described “an increasingly challenging operating environment, where sell-through remains challenged”. CEO Elliott Hill said Nike had “taken decisive actions to strengthen the foundation” while continuing to “face top-line headwinds”.
The tariff one-off
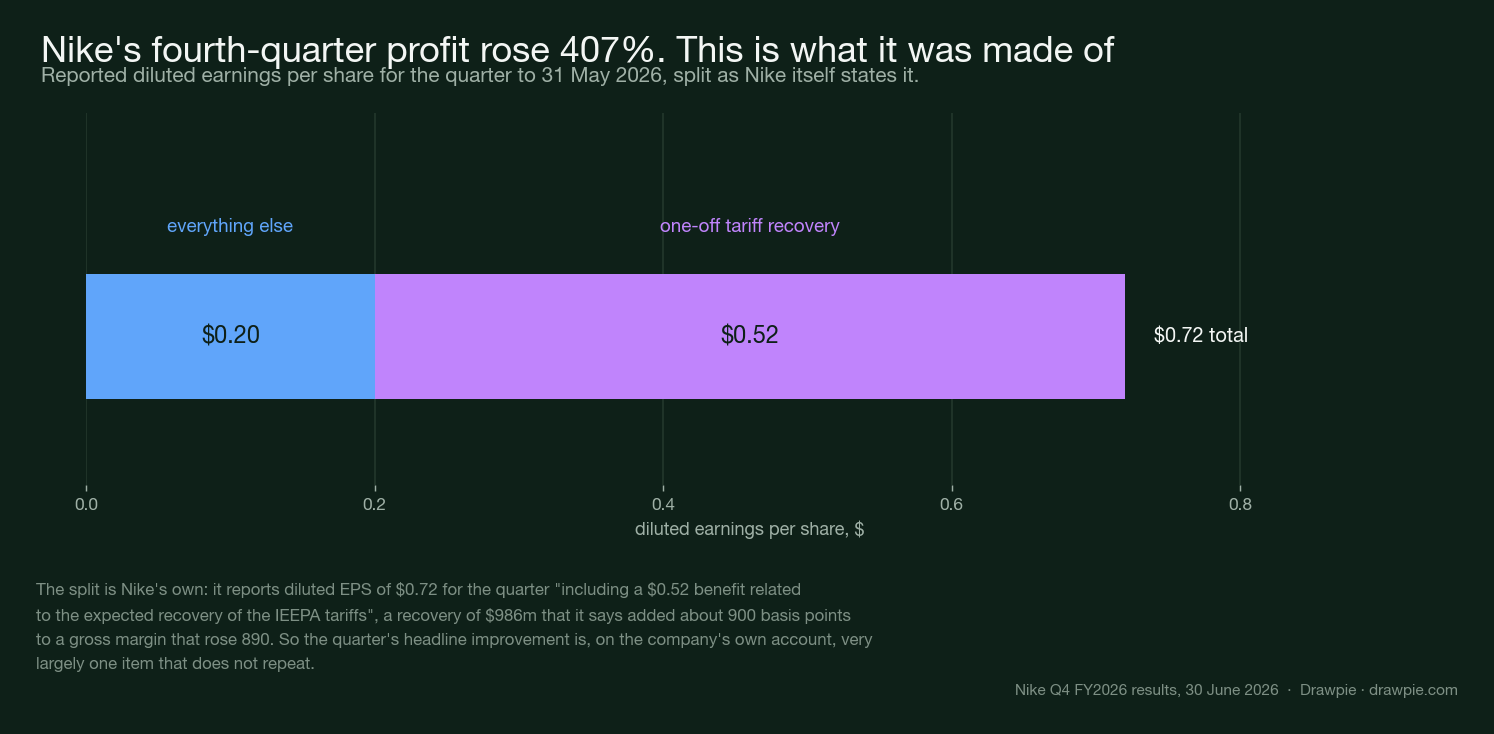
Nike’s fourth quarter looked like a turnaround. Gross margin up 890 basis points to 49.2%. Net income up 407%.
Here is what was in it, in Nike’s own words. The release states that the margin increase was “primarily due to the expected recovery of the IEEPA tariffs”, and that this recovery — $986 million — “increased gross margin by approximately 900 basis points.”
The margin rose 890 basis points. About 900 of them came from that one item.
The same applies to earnings per share. Nike reports diluted EPS of $0.72 for the quarter, “including a $0.52 benefit related to the expected recovery of the IEEPA tariffs”.
$0.72 in total. $0.52 of it a recovery that does not repeat. That is the company’s own split, not our reconstruction of it.
And the quarter’s revenue still fell — $11.0bn, down 1% reported and down 4% currency-neutral, with NIKE Direct down 7% and Converse down 32%.
The effective tax rate also helped: 19.6% for the quarter against 33.6% a year earlier.
Converse
Down 31% for the full year, to $1.2 billion. Down 32% in the fourth quarter alone, to $244 million.
Nike attributes this to declines across all territories — not a regional problem, and not one the wider portfolio is masking. It is now a small enough part of the group that it does not move the headline, which is itself the story of what has happened to it.
What we are not telling you
Whether any of this makes Nike shares cheap, dear or anything else. This page carries no forecast, no target price, no rating and no view on what the stock does next — not because the question is uninteresting, but because that is the one thing we will not publish about anything you can buy.
What it does say is what the filings say, which is narrower and more checkable: the direct channel is shrinking while wholesale grows, revenue has stopped falling without starting to grow, profit is falling anyway, and the most flattering quarter in two years was very largely one tariff line.
The next real information is the first quarter of FY2027, covering the three months to 31 August 2026, normally released in late September. That is when it becomes clear whether the wholesale-versus-direct reversal was a one-year event or a direction.
Figures from Nike’s FY2026 Form 10-K filed 15 July 2026, its Q4 and full-year results released 30 June 2026, and the SEC XBRL company-facts API. Share prices are weekly closes from a consumer market-data feed. This describes what was published. It is not investment advice.