New Hampshire Home Prices Hit a Record: Where It Costs Less
Update log (1)
- — July 2026 figures, from a report whose data is current as of 5 August 2026. Monthly housing figures are revised as late sales are recorded, and August's report will restate some of this.

- The statewide median single-family sale price was a record $580,000 in July 2026, up 5.5% on July 2025, on 1,532 sales. Sales volume in dollars rose 20.6%.
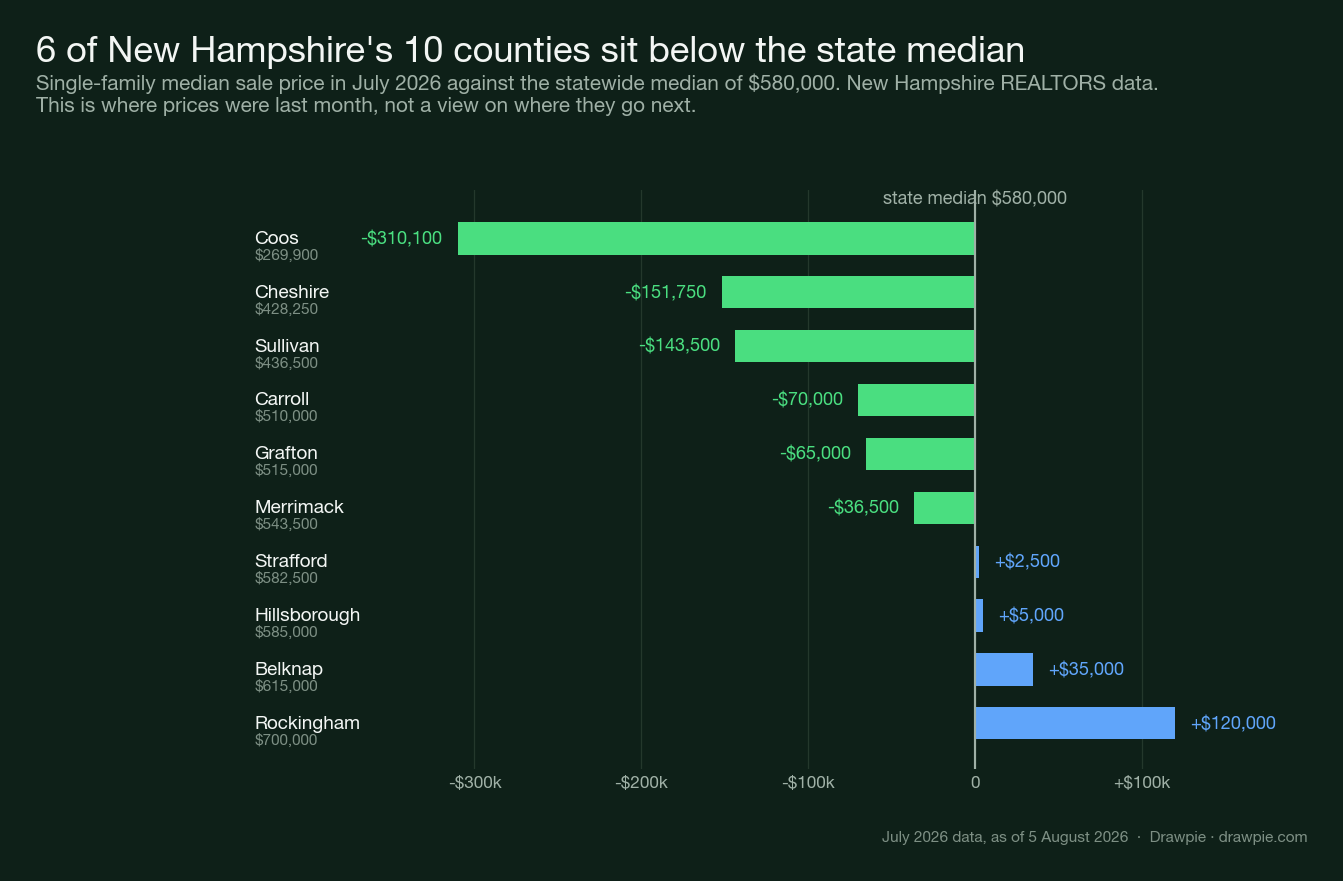
- Six of the ten counties sold below that statewide median. Coös was furthest below at $269,900, which is $310,100 under the state figure; Rockingham was furthest above at $700,000.
- The record is an average of markets moving in opposite directions. Hillsborough, the largest by sales at 387, was down 0.1% on the year, while Belknap was up 33.0% on 93 sales.
- The two cheapest counties are also the two slowest to sell. Coös took a median 54 days and Cheshire 39, against 23 for the state and 16 in Hillsborough.
- Affordability is the tightest number in the report. The state’s affordability index was 53, meaning a median household income was 53% of what is needed to qualify for the median-priced home.
New Hampshire’s median single-family home sold for a record $580,000 in July 2026, up 5.5% on a year earlier. That is the statewide number, and it is the least interesting one in the report.
Underneath it, six of the state’s ten counties sold below that median, the largest county in the state was flat on the year, and the biggest percentage rise came from a county that recorded 93 sales all month. This article sets out where prices actually sat in July. It does not forecast prices and takes no view on where any of these markets goes next.
How much did New Hampshire home prices rise in July 2026?
To a record $580,000, on more sales and more listings than a year earlier.
| Metric | July 2026 | Year-on-year |
|---|---|---|
| Median sale price | $580,000 | +5.5% |
| Closed sales | 1,532 | +10.4% |
| Sales volume | $1,075.0m | +20.6% |
| Homes for sale | 2,992 | +15.6% |
| New listings | 1,917 | +9.7% |
| Days on market | 23 | +9.5% |
| Months supply | 2.7 | +8.0% |
| Pct of list received | 100.3% | −0.2% |
Two of those rows are worth pausing on. Supply genuinely improved — inventory up 15.6%, new listings up 9.7%, homes taking two days longer to sell. And yet the price still set a record, because 2.7 months of supply is a long way from the five-to-six months usually described as balanced.
The last row is the one that settles any argument about whether July was a buyer’s month: at 100.3% of list price received, the typical home in New Hampshire still sold for slightly more than its asking price.
Josh Greenwald, president of the New Hampshire Association of Realtors, put the cause this way: “The persistent shortage of available homes, especially starter homes, continues to place upward pressure on prices.”
Which New Hampshire counties cost the least?
Coös, Cheshire and Sullivan, in that order — and six of the ten counties sold below the state median.
| County | Median | vs state |
|---|---|---|
| Coös | $269,900 | −$310,100 |
| Cheshire | $428,250 | −$151,750 |
| Sullivan | $436,500 | −$143,500 |
| Carroll | $510,000 | −$70,000 |
| Grafton | $515,000 | −$65,000 |
| Merrimack | $543,500 | −$36,500 |
| Strafford | $582,500 | +$2,500 |
| Hillsborough | $585,000 | +$5,000 |
| Belknap | $615,000 | +$35,000 |
| Rockingham | $700,000 | +$120,000 |
The spread from bottom to top is $430,100, which is more than the median price of a house in Cheshire County. Coös, in the far north, is the only county with a median under $300,000.
What that table is not is a ranking of value. A cheaper median can mean smaller houses, older stock, longer commutes or fewer of the things that make a place expensive. It records what sold, not what it was worth.
Where do homes take longest to sell?
In the two cheapest counties, which is the same fact from the buyer’s side.
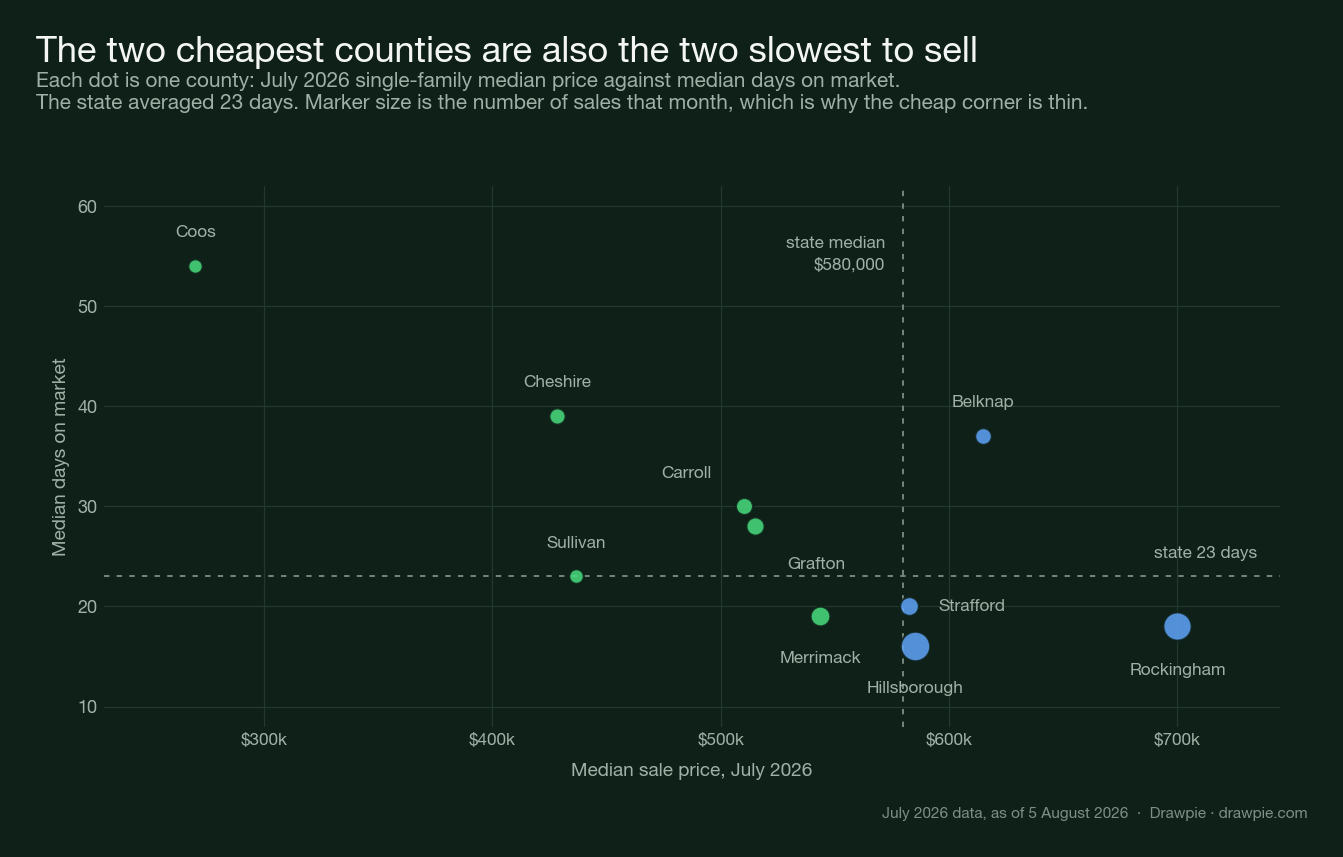
Coös homes took a median of 54 days to sell in July and Cheshire 39, against 23 for the state as a whole. At the other end, Hillsborough sold in 16 days and Rockingham in 18 — the two biggest and most expensive markets are also the fastest.
For anyone shopping rather than reading, that gap is the practically useful part of the whole report. Days on market is a rough proxy for how much room there is to negotiate, and it is the one measure where the cheaper half of the state is not simply “the same market, less money”.
The caveat sits in the dot sizes on that chart. Coös recorded 58 sales in the month and Cheshire 86, against 387 in Hillsborough. Thin markets are slow markets partly because there are fewer buyers in them, which is a reason for the longer wait rather than a discount waiting to be collected.
Did every county set a record?
No. The biggest market in the state was down on the year.
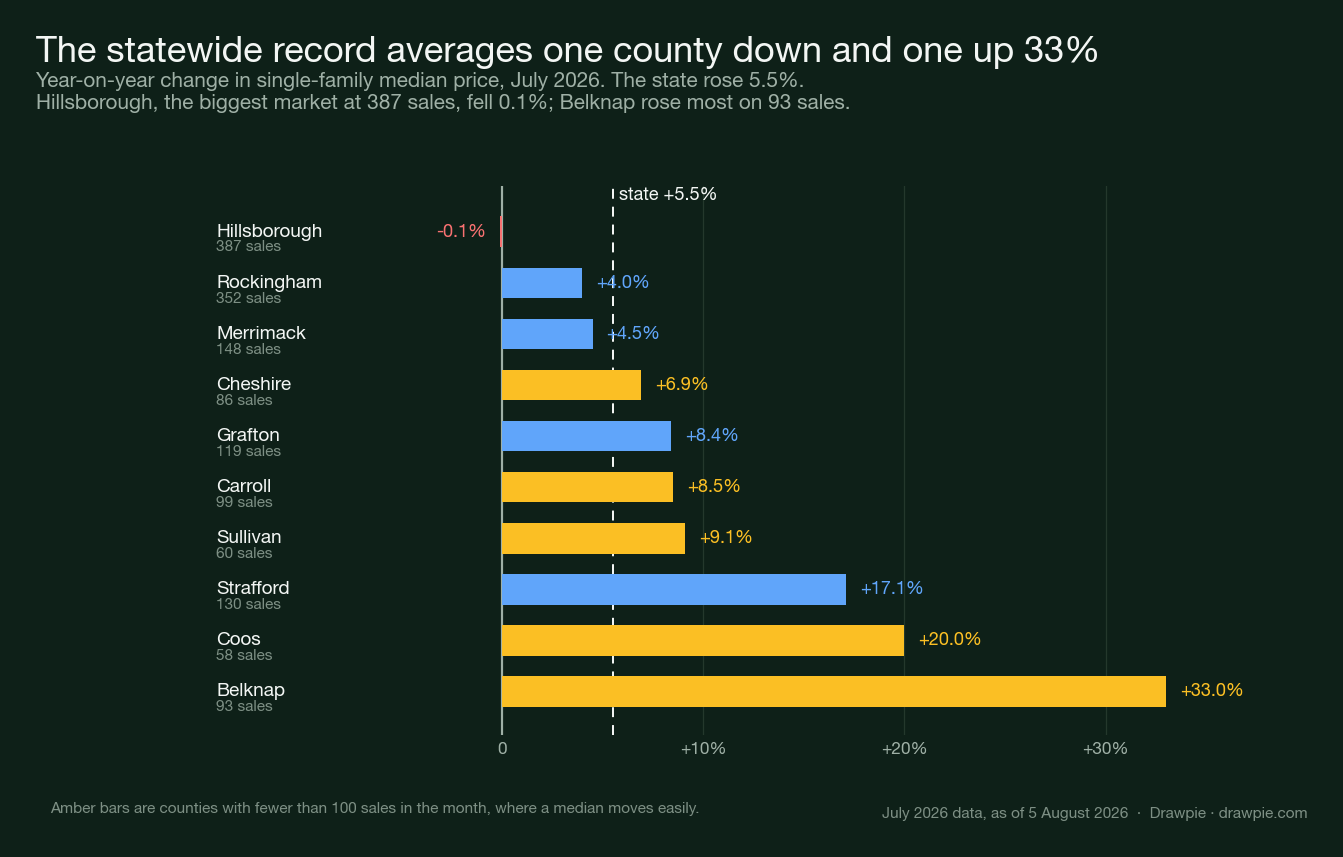
Hillsborough County — Manchester, Nashua, more than a quarter of the state’s sales — had a median of $585,000 in July, 0.1% below July 2025. Rockingham, the second-largest, rose 4.0%. Between them those two counties account for 739 of the state’s 1,532 sales, and neither of them matched the statewide 5.5%.
The counties that did the lifting were the small ones. Belknap rose 33.0% on 93 sales, Coös 20.0% on 58, Strafford 17.1% on 130. A median drawn from 58 transactions moves whenever the mix of what sold changes; one unusually expensive month in a small county can produce a number like that without anything having changed for a buyer on the ground.
That is why the statewide record and the county detail can both be true and feel contradictory. The record is real. It is also an average of ten markets, two of which are large and roughly flat.
Can a typical household afford the median home?
On the association’s own measure, no — and by a wide margin.
The report includes a housing affordability index, which it defines plainly: an index of 120 means the median household income is 120% of what is needed to qualify for the median-priced home under prevailing interest rates. Higher is more affordable.
New Hampshire’s single-family index in July 2026 was 53, down from 55 a year earlier. On that definition, the median household earned a little over half of what was needed to qualify for the median-priced house. The condo index was 71, and the twelve-month average across all property types was 57.
That number, rather than the record price, is the one that explains why inventory can rise 15.6% and prices can still set a record.
How does New Hampshire compare with the rest of the US?
Dearer, rising faster, and with a good deal less on the market.
| Measure | NH | US |
|---|---|---|
| Median price | $580,000 | $440,600 |
| Year-on-year | +5.5% | +1.8% |
| Months supply | 2.7 | 4.6 |
| Days on market | 23 | 28 |
The national figures are National Association of REALTORS numbers for existing homes, quoted in the same New Hampshire report. The US median was itself a record at $440,600, the 36th consecutive month of annual increases — but New Hampshire’s median is 32% higher and rose roughly three times as fast, on little more than half the months of supply.
That is the sense in which New Hampshire is bucking a national trend: not that prices are rising when others fall, but that they are rising at a very different speed.
What this does not tell you
Where prices go next, what any individual house is worth, or whether a cheaper county is cheap for a good reason.
It does not tell you where prices go next, and nothing here should be read as suggesting that a county selling below the state median is due to catch up. Cheap can stay cheap for decades, for reasons that have nothing to do with the market: where the jobs are, how far it is to a hospital, what the winters do to a road.
It is one month. Monthly medians are volatile, especially at county level, and the association’s own report is revised as late sales are recorded. A single month is a reading, not a trend.
It says nothing about any individual house. A median is the middle of what sold, and what sold is not a fixed basket — if bigger houses happened to change hands in a county this July, its median rises without any individual property being worth more.
And it covers only what goes through the multiple listing service used by New Hampshire REALTORS. Private sales, new-build transactions handled directly by builders and anything sold outside that system are not in these numbers.
Sources
Checked on 11 August 2026.
| Source | What it supports here |
|---|---|
| New Hampshire REALTORS — Monthly Indicators, July 2026 | Every New Hampshire figure in this article: the statewide table, all ten county medians and their year-on-year changes, closed sales, days on market, the affordability index and its definition, the condo and all-property medians, and the National Association of REALTORS figures quoted in its commentary |
| Concord Monitor — N.H. home prices have hit a new record high | The quote from Josh Greenwald, president of the New Hampshire Association of Realtors, and the county medians that differ slightly from the association’s own report |
The association’s report is a PDF and was read directly rather than through coverage of it; the county table in it was checked by confirming the ten counties’ sales sum to the statewide total. Both URLs were requested alongside a deliberately wrong path on the same domain. The newspaper returned a clean 404 for the wrong path; the statistics host returned “200” for it, so that one was distinguished by what came back instead — 834KB of PDF for the real report against 5KB of HTML for the invented one.
How we verified this
This article contains no forecast of house prices and carries no view on where any market goes next. Every figure describes July 2026 or earlier. Where it identifies counties selling below the state median, that is a statement about last month’s recorded sales, not a suggestion that those places will rise, fall or catch up.
The figures come from the New Hampshire REALTORS Monthly Indicators report itself, extracted from the published report rather than retyped from news coverage of it. The report states its data is current as of 5 August 2026 and is sourced to New Hampshire REALTORS and PrimeMLS.
The county numbers were checked against the state total before use. The ten counties’ closed sales sum to exactly 1,532, which is the statewide figure in the same report. A transcription error would have broken that sum, and the chart script asserts it.
Everything headline here is single-family only. The $580,000 record is the single-family median. The same report puts the median across all property types, including condos and manufactured homes, at $535,000, and the condo median at $429,950. Those are different measurements and are not mixed.
County medians reported elsewhere differ slightly from these. At least one newspaper account of the same month gives Rockingham at $710,000 and Cheshire at $422,000 against the report’s $700,000 and $428,250. We have used the association’s own report throughout rather than reconciling the two, and have not mixed sources within a table.
Small-county medians move on very few sales. Coös recorded 58 sales in the month and Belknap 93. A median drawn from that many transactions swings on the mix of what happened to sell, which is why the year-on-year chart marks those counties separately rather than presenting a 33% rise as comparable to Hillsborough’s 387-sale reading.