MSFT Stock Jumps as Capex Guidance Stops Climbing and Free Cash Flow Rebounds

- Microsoft’s stated capital spending figure came down for the first time, and nothing was added to the plan. In October 2025 it lifted the fiscal-2026 growth rate; in April 2026 it put a number on calendar 2026 at roughly $190bn, of which about $25bn was component-price inflation. On 29 July that became roughly $175bn — with the CFO attributing the whole reduction to leases reclassifying and calling the underlying investment expectation unchanged.
- Free cash flow was $19.6bn in the quarter, against a $5.9bn trough in the December quarter. The four quarters of fiscal 2026 run $25.7bn, $5.9bn, $15.8bn, $19.6bn. The recovery is not a lease-accounting effect — it is operating cash flow pulling away from cash capex, $35.8bn to $46.7bn to $55.4bn.
- Free cash flow beat outside forecasts even as it fell year-over-year, though the size of the beat depends on the provider: about 46% above Visible Alpha’s $13.44bn estimate via Reuters, about 13% above FactSet’s $17.4bn via MarketWatch. Microsoft itself claimed beats on revenue, operating income and EPS — not on cash.
- The 10-K discloses $329.1bn of additional leases, mostly datacentres, that had not yet commenced at 30 June, some conditional, scheduled to start between fiscal 2027 and fiscal 2033 with terms of up to 20 years. It is a multi-year commitment pipeline, not a second capex number — but it is the reason the classification question matters far beyond this year’s $15bn.
- The accounting change cuts against free cash flow rather than helping it. Finance leases were never inside the cash line Microsoft subtracts to get free cash flow, so moving leases to operating classification shrinks reported capex while pushing the whole rent payment into operating cash outflows — which lowers operating cash flow, and free cash flow with it, as payments fall due. Fiscal 2027 free cash flow is guided only to ‘remain positive’.
Microsoft’s estimate of its own capital spending has only moved one way since late 2025. On 29 July 2026 it moved the other way — for a reason that is not a spending cut. The calendar-2026 figure went to roughly $175 billion from roughly $190 billion three months earlier, and free cash flow, which had fallen to $5.9 billion in the December quarter, came back to $19.6 billion.
The stock was up about 10% in pre-market trading the next morning. What follows is which parts of that hold up.
What changed about the capex guidance?
The direction. Every previous move in the past year was upward or absent.
| Call | What was said about capital spending |
|---|---|
| Oct 2025 (Q1 FY26) | “We now expect the FY26 growth rate to be higher than FY25” |
| Jan 2026 (Q2 FY26) | No annual figure; only that Q3 capex would decrease sequentially |
| Apr 2026 (Q3 FY26) | “For calendar year 2026, we expect to invest roughly $190 billion in capital expenditures which includes approximately $25 billion from the impact of higher component pricing” |
| Jul 2026 (Q4 FY26) | “the shift from finance to operating leases adjusts our expectation to approximately $175 billion” — and, separately, that the investment expectation itself is unchanged |
Read the April line again, because it is the one this quarter breaks. The $190 billion was not just a build plan; roughly $25 billion of it was memory and component prices going up. That is the shape of a number that keeps getting revised for reasons outside the company’s control.
Note what January did and did not do: it gave no annual figure at all, only a warning that the March quarter’s capex would dip sequentially. So the honest version of the claim is not that Microsoft went a year without raising the number — it is that this is the first time the number has come down, and the first time in this sequence that nothing new was added to it.
In July, nothing was added. The figure went down, and Amy Hood was explicit about why:
Outside of this useful life impact, our calendar year 2026 CapEx investment expectations remain unchanged. However, the shift from finance to operating leases adjusts our expectation to approximately $175 billion.
The “useful life impact” is a separate change announced in the same breath: from the start of fiscal 2027 Microsoft is extending the assumed useful lives of its datacentres and office buildings from 15 to 25 years. That pushes more future datacentre leases from finance classification into operating classification — and, as she put it, “Finance leases are included in capital expenditures while operating leases are not.”
So the $15 billion is not a cut. It is the same spending, sitting in a different line. The genuinely new information is narrower and better: the plan behind the number stopped growing.
It is worth being precise about how far that goes, because it is not a slowdown. Fourth-quarter capex was $41 billion against $31.9 billion the quarter before — the same measure in both quarters. Next quarter is guided to “over $50 billion”, though that one is on the new lease classification and so is not strictly the same measure as the $41 billion. Full-year fiscal 2027 capex “will grow year-over-year”. The spending is still climbing — what stopped climbing is the estimate of how much it will climb.
What happened to free cash flow?
It fell off a cliff two quarters ago and has climbed back twice since.
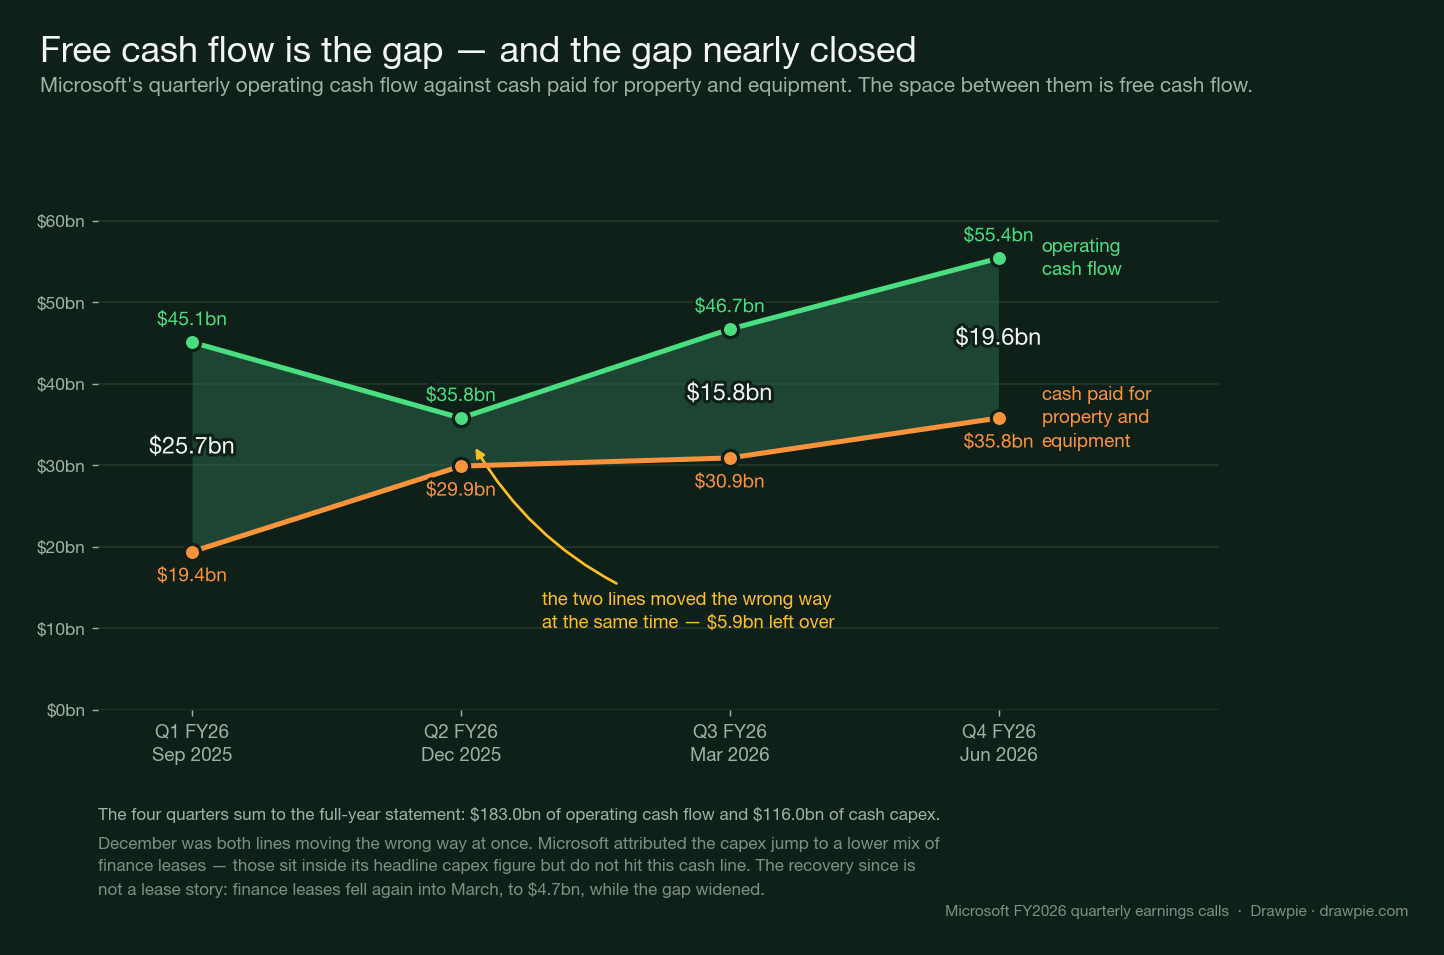
Free cash flow, on Microsoft’s definition, is just the distance between those two lines: operating cash flow less cash paid for property and equipment. Drawing it that way shows what happened rather than asserting it.
The December quarter is the one to understand, because it explains why this quarter reads as a relief. Both lines moved the wrong way at once. Operating cash flow fell from $45.1 billion to $35.8 billion, and cash paid for property and equipment rose from $19.4 billion to $29.9 billion. What was left was $5.9 billion.
Microsoft’s explanation for the capex half was mechanical: free cash flow “decreased sequentially reflecting the higher cash capital expenditures from a lower mix of finance leases.” Finance leases count inside its headline capital expenditure figure but do not hit cash paid for property and equipment in the quarter they are signed — so the September quarter, with $11.1 billion of them, converted most of its operating cash flow into free cash flow, and December, with $6.7 billion, did not.
The recovery since is not that story. Finance leases fell again into the March quarter, to $4.7 billion, and free cash flow rose anyway — to $15.8 billion, then $19.6 billion. What is doing the work is operating cash flow pulling away from cash capex: $35.8 billion to $46.7 billion to $55.4 billion, against capex of $29.9 billion, $30.9 billion and $35.8 billion. The full year came in at $67.0 billion.
So was free cash flow better than expected?
Against outside forecasts, yes — comfortably. Microsoft itself never said so.
Those are two different questions and both have answers. The company claimed beats: adjusting for the discrete items in the quarter it says it “exceeded expectations across revenue, operating income, and diluted earnings per share”, and it called Microsoft Cloud gross margin of 65% better than expected. Free cash flow was not on that list. Hood’s only characterisation of the number was that it “reflect[ed] higher capital expenditures.”
External forecasts confirm a beat on cash, though its size depends heavily on whose forecast you use. Visible Alpha, as cited by Reuters, estimated $13.44 billion. FactSet, as cited by MarketWatch, put consensus at $17.4 billion. The reported $19.6 billion is therefore about 46% above the first and about 13% above the second — a spread wide enough that “how big a beat” has no single answer.
Capital expenditure for the quarter also came in slightly light: $41 billion against market estimates of $42.37 billion, again via Reuters citing Visible Alpha.
The September-quarter guidance needs more care than it has generally been given. Reuters treated it as approximately $50 billion and set it against a $56.02 billion estimate. But Microsoft’s actual wording was “over $50 billion” — an open-ended lower bound, and $56.02 billion is itself over $50 billion. The company’s wording alone does not establish a below-consensus capex guide, however it was read on the day.
One further caution on the capex comparisons. They are partly a measurement question rather than a spending surprise: forecasts built on the old lease classification were modelling a number Microsoft has since redefined downward.
The figures from the company itself are less dramatic and worth holding alongside. Free cash flow fell 23% year-over-year, from $25.6 billion, in a quarter when cash paid for property and equipment more than doubled. Across the full year that cash capex line rose 80% — $64.6 billion to $115.9 billion — while free cash flow fell only about 6% and operating cash flow gained $46.8 billion. Beating a forecast and shrinking year-over-year are both true here. For the version of that trade-off where the line actually crossed zero, see Tesla’s quarter .
One number to be careful with, since both versions circulate: the 80% is growth in cash paid for property and equipment. On the headline definition that includes finance leases, the four quarters sum to about $145 billion and the growth rate is lower. The two measures do not share a growth rate any more than they share a level.
Where the argument gets weaker
In the same accounting change — and it cuts against free cash flow rather than for it.
The reclassification is easy to read as a cosmetic tidy-up that flatters capex without consequence. It has a consequence, and the consequence points down.
Start from what free cash flow actually subtracts. Microsoft’s definition is operating cash flow less cash paid for property and equipment — the $35.8 billion, not the $41 billion. Finance leases have never been in that subtraction. Signing one is largely a non-cash event: it puts a right-of-use asset and a matching liability on the balance sheet, and the payments that follow are split, with the principal portion going to financing activities and only the interest touching operating cash flow.
An operating lease behaves differently. The whole payment runs through operating cash flow.
So when a lease moves from finance to operating classification, three things happen. The headline capex figure falls, because finance leases were counted inside it. The number free cash flow subtracts does not move, because finance leases were never counted there. And operating cash flow picks up an outflow it did not previously carry.
That makes reported free cash flow worse, not better — for a given lease, compared with what the same lease would have done under finance classification, as its payments fall due. Free cash flow is operating cash flow minus cash capex; this change leaves the second term alone and shrinks the first.
Two things that does not mean. It is not a prediction that fiscal 2027 free cash flow falls year-over-year — operating cash flow is growing fast enough to swamp an effect this size, and Microsoft is guiding to positive. And nothing lands on reclassification day: a lease reclassified today affects cash flow only as rent is actually paid, spread across the term.
Microsoft has been flagging the effect for two quarters already, in the same sentence structure both times: operating cash flow growth “partially offset by an increase in operating lease payments” in the March quarter, and again in June. Extending useful lives from 15 to 25 years pushes more future datacentre leases into that category.
And the fiscal 2027 guidance is careful in a way worth noting. Microsoft says it expects “to remain free cash flow positive in FY27.” A company that generated $67 billion of free cash flow last year is guiding to a sign, not a number.
The number that makes the $15 billion look small
There is a figure in the 10-K’s leases note that puts the whole argument in proportion, and it is not in the press release or the call.
As of June 30, 2026, we had additional leases, primarily for datacenters, that had not yet commenced of $329.1 billion, with some arrangements subject to certain contractual conditions being met. These leases will commence between fiscal year 2027 and fiscal year 2033 with lease terms of 1 year to 20 years.
$329.1 billion, signed but not started, mostly datacentres, some of it conditional on contract terms being met.
Be careful what that is and is not. It is not comparable with the $175 billion calendar-2026 capex expectation: one is a single year of spending, the other a multi-year pipeline of lease arrangements. Fiscal 2033 is the last year in which these leases are scheduled to commence, not to end — with terms running up to 20 years, payments extend well beyond it. And nothing lands at $329.1 billion: when a lease commences, the asset and liability recognised are discounted, so the figure will never appear one-for-one in capex or on the balance sheet.
What it does establish is scale. Microsoft has committed to a lease pipeline of that order, and none of it is on the balance sheet today.
That is why the classification question matters well beyond the $15 billion it moved this quarter. As each lease commences, the accounting rules applied to its terms determine its classification. A finance lease enters Microsoft’s headline capital expenditure and is recognised in property and equipment with a matching finance-lease liability. An operating lease stays outside headline capex — but it does not stay off the balance sheet: it still creates an operating-lease right-of-use asset and an operating-lease liability, and its cash payments run through operating cash flow.
Both sides of that are already visible. Finance-lease liabilities rose from $46.2 billion to $66.6 billion during fiscal 2026. Operating-lease liabilities ended the year at $21.9 billion, against operating-lease right-of-use assets of $24.2 billion.
Management estimates feed those rules rather than override them, and the useful-life extension is one such estimate: Hood’s own account is that it will cause “more of our future datacenter leases [to] shift from finance leases to operating leases.” The $15 billion is one year’s visible effect of an input that shapes how a commitment of this size gets reported over the next seven years and beyond.
One thing this is not: hidden. It is a required disclosure, sitting in the notes where these things live.
What did the quarter actually look like?
Strong, with a one-off in the earnings line.
Revenue was $90.0 billion, up 18%, and operating income $40.6 billion, up 18%. GAAP net income rose 31% and GAAP diluted EPS 32%, to $4.81 — but on a non-GAAP basis, which strips out the impact of Microsoft’s investments in OpenAI, net income grew 22% and EPS 23%, nine points lower on both. Microsoft also says discrete items produced a $0.27 benefit to diluted EPS against its own April guidance, including a $3.2 billion gain on its investment in Anthropic and lower-than-expected Voluntary Retirement Program costs, partly offset by severance and Xbox impairment charges. The Anthropic gain sits below the operating line, so it lifts EPS without touching operating income.
| Segment | Q4 revenue | Change |
|---|---|---|
| Productivity and Business Processes | $37.8bn | +14% |
| Intelligent Cloud | $39.3bn | +32% |
| More Personal Computing | $12.9bn | −4% |
Azure and other cloud services grew 43%, and Azure passed $100 billion of annual revenue for the first time, up 41%. Microsoft Cloud revenue was $59.3 billion, up 27%. Microsoft 365 Copilot passed 30 million paid seats. Commercial remaining performance obligation grew 84% to $678 billion — or 25% excluding OpenAI, both figures Microsoft’s own.
More Personal Computing is the drag and is guided to get worse: operating income there fell 14%, and for fiscal 2027 Microsoft expects Windows OEM and Devices revenue to decline in the high teens on weak PC demand, component costs raising device prices, and elevated inventory.
How the stock actually moved
In two stages, and the 29 July close is not part of it.
Microsoft closed the regular session on 29 July at $390.54, which was down 0.71% on the day — and set before anyone had seen the results, which came out after the close. The move happened in extended hours:
- 16:05, press release out: to roughly $401–403, about +3%
- 16:30 to 17:55: almost two hours in a $396–405 band, including the start of the call at 17:30
- 18:00: one five-minute bar from $397 to $417
- through 19:55: holds $419–425
- 30 July, 07:50 pre-market: $429.50, about +10% on the 29 July close
The outlook section of the call — where the capex figure and the guidance live — falls in that 18:00 window. That is a coincidence of timing, and it is as far as the evidence goes: no timestamped transcript is published, so nothing here establishes that one sentence caused one move. The most that can be said is descriptive: the shares rose roughly 3% after the release, then moved higher again while the outlook was being delivered.
Three caveats on the extended-hours numbers, which are the weakest data in this article. The feed reports no volume at all for the after-hours session. Four of its five-minute bars carry low prices that contradict their own closes, so only closes are used above. And this granular a series comes from one consumer feed and cannot be checked against a second source — what is corroborated more broadly is the shape: an initial move of a few per cent, widening to high single digits during the outlook.
Even at $429.50, the stock is about 20.8% below its 52-week high close of $542.07 from 28 October 2025. The 29 July close was 28.0% below it. The de-rating over those nine months coincided with the market’s argument about AI capital spending, which is the most plausible reason a capex line moves this stock more than a revenue line — though that is an interpretation of what investors were worried about, not something the numbers prove.
For the same tension resolving the other way at another hyperscaler, see our piece on Alphabet’s free cash flow turning negative for a quarter . And Meta selling its “excess” AI compute is a different attempt at the same problem.
What to watch
The 30 July close. Everything above is pre-market. The first complete session after results is what goes on the record.
The lease disclosures, and the right ones. The tempting number is the operating lease right-of-use asset balance — $24.2 billion at 30 June against $24.8 billion a year earlier. It is the wrong test. A closing balance is net of new leases, amortisation, terminations and everything else, so it can sit still while a great deal moves underneath it. The figures that actually show the reclassification are further down the note: right-of-use assets newly obtained in the period, cash paid for amounts included in the measurement of lease liabilities, the liabilities themselves — finance lease liabilities went from $46.2 billion to $66.6 billion over the year — and, above all, the commitments not yet on the balance sheet at all — the $329.1 billion described above.
The fiscal Q1 capex print, late October 2026. Guided to over $50 billion. Read it carefully rather than straight: it is the first quarter on the new lease classification, and the $41 billion just reported is on the old one, so the two headline figures are not the same measure. The like-for-like comparison is the cash-paid-for-property-and-equipment line, $35.8 billion this quarter, or whatever bridge Microsoft provides between the two bases.
Whether the plan stays put. The single new thing this quarter is an expectation that did not rise. One quarter is not a trend, and April’s $25 billion of component-price inflation is a reminder of how the number moved last time.
Sources
Every figure above comes from one of these. Each link was checked on 30 July 2026.
| Source | What it supports here |
|---|---|
| Microsoft FQ4 FY2026 press release (Exhibit 99.1 to the 8-K, 29 July 2026) | Revenue $90.0bn, operating income $40.6bn, GAAP and non-GAAP net income and EPS, the $0.27 discrete-item benefit and the $3.2bn Anthropic gain, segment revenues, Azure +43%, Microsoft Cloud $59.3bn, commercial RPO $678bn, and the cash flow and balance sheet statements |
| FQ4 FY2026 earnings call transcript | The $41bn capex figure, $5.6bn finance leases, $19.6bn free cash flow, the useful-life extension, the ~$175bn calendar-2026 expectation, the over-$50bn Q1 guide, “FY27 capital expenditures will grow”, “remain free cash flow positive”, and the 65% cloud gross margin called better than expected |
| FQ3 FY2026 earnings call transcript | April’s “roughly $190 billion” including “$25 billion from the impact of higher component pricing”, capex $31.9bn, finance leases $4.7bn, cash PP&E $30.9bn, free cash flow $15.8bn |
| FQ2 FY2026 earnings call transcript | The $5.9bn free cash flow trough, capex $37.5bn, finance leases $6.7bn, cash PP&E $29.9bn, and the finance-lease-mix explanation |
| FQ1 FY2026 earnings call transcript | Free cash flow $25.7bn up 33%, capex $34.9bn, finance leases $11.1bn, cash PP&E $19.4bn, and the October upward revision to the fiscal-2026 growth rate |
| Microsoft FY2026 Form 10-K (filed 29 July 2026) | The audited fiscal 2026 statements, and the leases note: the $329.1bn of leases not yet commenced and their fiscal 2027–2033 commencement window, finance lease liabilities of $66,594m against $46,172m, operating lease liabilities of $21,925m, and the cash flow classification of finance versus operating lease payments |
| Reuters, “Microsoft says cash will keep flowing from AI, shares rise” (29 July 2026, read via syndication) | The Visible Alpha analyst estimates: $13.44bn for free cash flow, $42.37bn for the quarter’s capex, $56.02bn for the September-quarter capex guide |
| MarketWatch live coverage | The FactSet free cash flow consensus of $17.4bn |
Share prices and the 52-week high are from a consumer market-data feed (Yahoo Finance via the yfinance library) and are described in the verification note above.
How we verified this
All Microsoft figures come from the company’s own disclosures: the fourth-quarter fiscal 2026 press release filed as Exhibit 99.1 to the 8-K on 29 July 2026, the cash flow and segment statements inside it, and the transcripts of all four fiscal-2026 earnings calls published on Microsoft’s investor relations site. Quotations attributed to CFO Amy Hood are from those transcripts. Microsoft’s fiscal year ends 30 June, so the fourth quarter is the three months to 30 June 2026.
Two capex measures appear here and they are not interchangeable. Microsoft’s public figure — $41bn for the quarter — is capital expenditure including finance leases. The cash flow statement line, “additions to property and equipment”, was $35.8bn. Finance leases in the quarter were separately stated at $5.6bn. Those three figures do not close arithmetically, and we have not implied that they do: the $41bn is itself a rounded figure, and Microsoft attributes the gap between total capex and cash paid to finance leases together with timing differences between goods being received and paid for — its own wording in an earlier quarter was that the finance-lease impact was “partially offset by differences between the receipt of goods and payment”. Each measure is labelled where it appears.
The quarterly free cash flow figures are Microsoft’s own, stated on each call. They were cross-checked rather than assumed: $25.7bn plus $5.9bn plus $15.8bn plus $19.6bn is $67.0bn, and computing the full year independently from the cash flow statement gives $182,935m less $115,948m, or $66,987m — the same number by a different route. That is why the full-year figure is quoted here even though Microsoft did not state one.
Two separate questions about “beating expectations” are kept apart. Microsoft’s own claims are that, adjusting for discrete items, it exceeded expectations on revenue, operating income and diluted EPS, and that cloud gross margin was better than expected; it made no such claim about cash, characterising free cash flow only as reflecting higher capital expenditures. Outside forecasts are a different matter and are third-party estimates, not issuing-body data. The Visible Alpha figures — $13.44bn for free cash flow, $42.37bn for the quarter’s capex, $56.02bn for the September quarter’s — come from a Reuters wire report read at source, in syndication, rather than taken from a summary. The FactSet consensus of $17.4bn is as reported by MarketWatch. Both are given because they differ by enough to change the answer to “how big a beat”, and both are attributed to the data provider rather than presented as a single market number. An earlier version of this article said no verifiable consensus figure existed, which was a statement about our own searching rather than about the record.
Microsoft’s September-quarter capex guidance is described here as the open-ended lower bound it is. The company said “over $50 billion”; a $56.02bn estimate also satisfies “over $50 billion”, so the guidance wording on its own does not put the company below consensus, whatever the market made of it on the day.
The $329.1bn of leases not yet commenced, the lease liability balances on both sides and the cash flow classification of lease payments were read directly from the leases note in the Form 10-K rather than from any coverage of it. Note that an operating lease is outside Microsoft’s headline capital expenditure but not off the balance sheet: it recognises a right-of-use asset and a lease liability like a finance lease does, and the article says so. At 30 June 2026 operating-lease right-of-use assets were $24,177m and operating-lease liabilities $21,925m, against finance-lease liabilities of $66,594m.
The description of what the lease reclassification does to free cash flow follows the cash flow classification in Microsoft’s own lease disclosures rather than an intuition about capex. Finance lease principal payments are financing activities and only the interest portion is operating, and the right-of-use asset is acquired without passing through cash investing — which is why finance leases sit inside Microsoft’s headline capex figure but outside the cash paid for property and equipment that free cash flow subtracts. Operating lease payments run wholly through operating cash flow. The consequence is stated in the direction that follows from that, which is downward for reported free cash flow, and Microsoft’s own commentary on operating lease payments as a drag on operating cash flow in both the March and June quarters is consistent with it.
Prices are from a consumer market-data feed, not an exchange. The 29 July close of $390.54 is a completed regular session and pre-dates the results, which came out after the close. Extended-hours data from this feed carries no volume at all and four of its after-hours bars have low prices that contradict their own closes, so only closing levels are used and no volume is claimed. The 30 July level is pre-market and timestamped; that session had not opened at the time of writing. This article describes what was published. It is not investment advice.