Money News August 2026: Stocks, Inflation, Rates and Investing

- US payrolls fell 23,000 in July, and the previous two months were revised down by 103,000 between them. May went from +129,000 to +63,000 and June from +57,000 to +20,000. The unemployment rate did not move, at 4.1%.
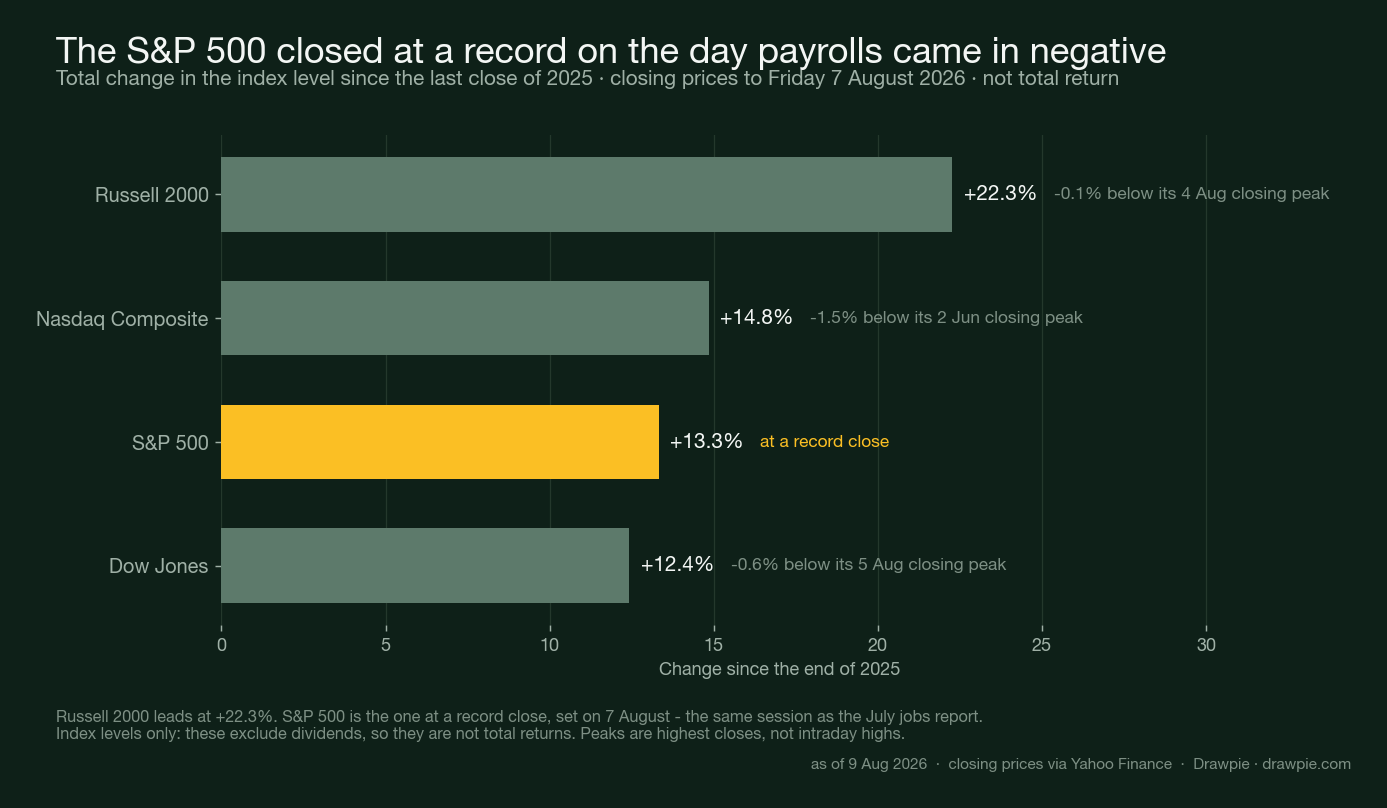
- On the same day that report landed, the S&P 500 closed at a record 7,757.64, up 13.3% since the end of 2025. The Russell 2000 leads the big four indices at +22.3%.
- Inflation is still above target on every measure, and the measure the Fed’s 2% goal is actually defined on — the overall PCE price index, not core — is the highest of the four at 3.7% in the year to June. Core PCE was 3.3%, headline CPI 3.5%, and the June CPI fall was almost entirely energy.
- The Fed held at 3.50–3.75% on 29 July, but three officials voted to raise rates. Its next decision is 15–16 September. July CPI lands on 12 August.
The first week of August produced two facts that do not obviously belong in the same month. US payrolls went negative in July, and the two months before it were revised down by 103,000 jobs between them. On the very same day that report was published, the S&P 500 closed at an all-time high.
Neither of those is a prediction about anything. Both have already happened. Here is where jobs, inflation, rates and markets actually stand, and what is on the calendar for the rest of the month.
What happened to US jobs in July 2026?
Payrolls fell by 23,000, and the two months before that got much worse in hindsight. The Bureau of Labor Statistics published the July employment report on 7 August.
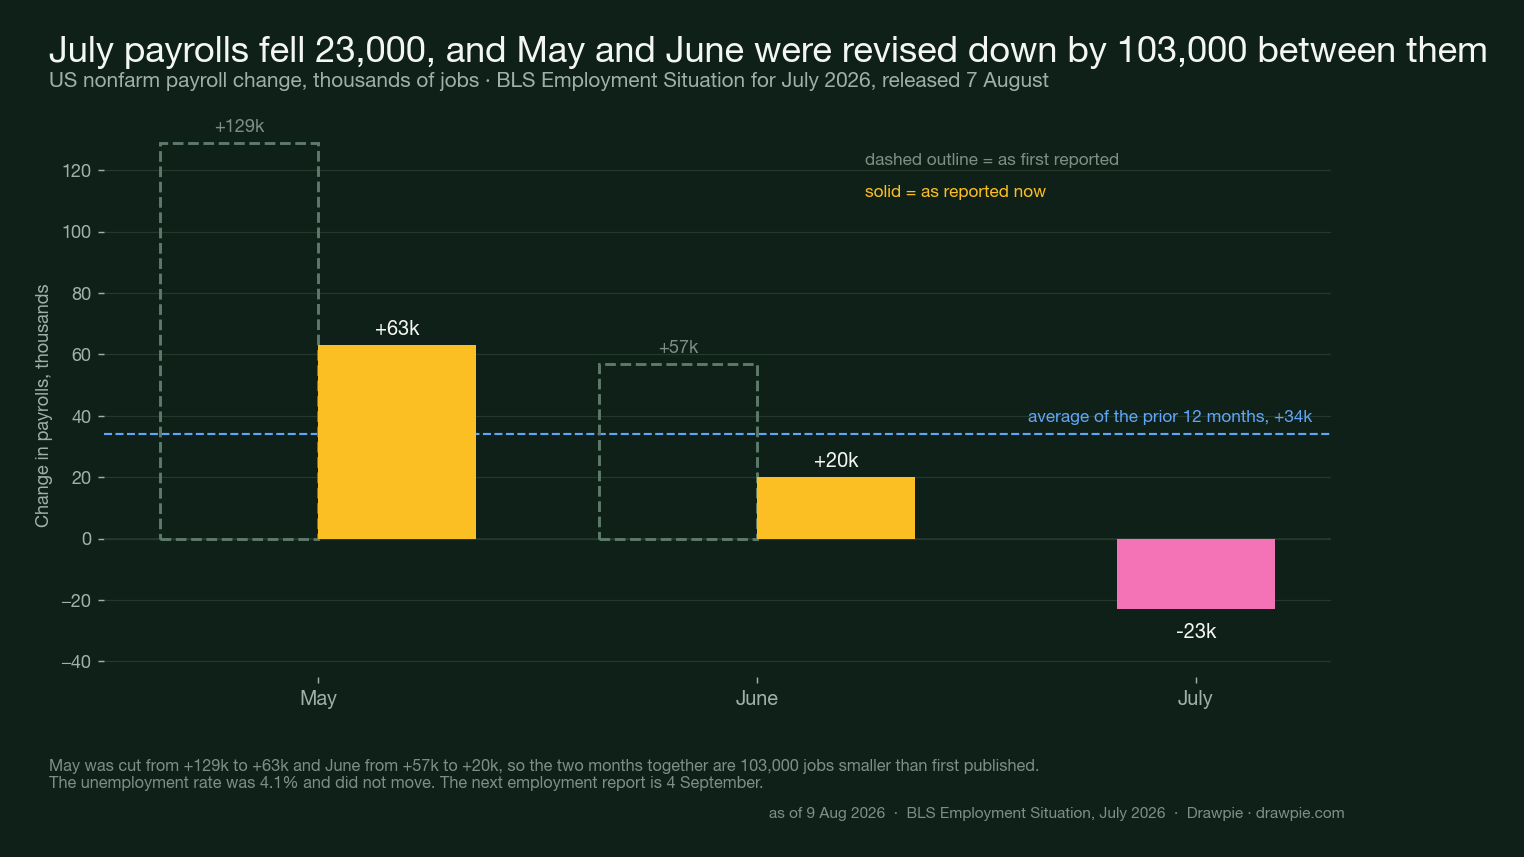
The revisions are the part that got less attention than the headline:
| Month | First reported | Now |
|---|---|---|
| May | +129,000 | +63,000 |
| June | +57,000 | +20,000 |
| July | — | −23,000 |
That is 103,000 jobs removed from two months that were already published. The release states both figures itself, so this is not a reconstruction — BLS says May was cut by 66,000 and June by 37,000.
For scale, the release also gives the average monthly gain over the prior twelve months: 34,000. That is the bar the last three months were measured against, and it is itself low.
Underneath the headline:
- The unemployment rate did not move, at 4.1%, with 6.9 million people unemployed.
- Local government education lost 50,000 jobs and retail trade lost 19,000.
- Financial activities fell 14,000, and is now down 121,000 from a peak in May 2025.
- Health care is still adding, at +22,000, but more slowly than its own 12-month average of +36,000.
- Temporary layoffs rose 153,000 to 921,000.
- Average hourly earnings were $37.62, up 3.2% over the year.
Two quieter numbers are worth keeping: the labour force participation rate is 61.4%, down 0.7 points since January, and the employment-population ratio is 58.9%, down 0.5. A stable unemployment rate alongside a falling participation rate describes something different from a stable labour market.
Where does inflation actually stand right now?
Above target on every measure, including the one the Fed’s target is defined on.
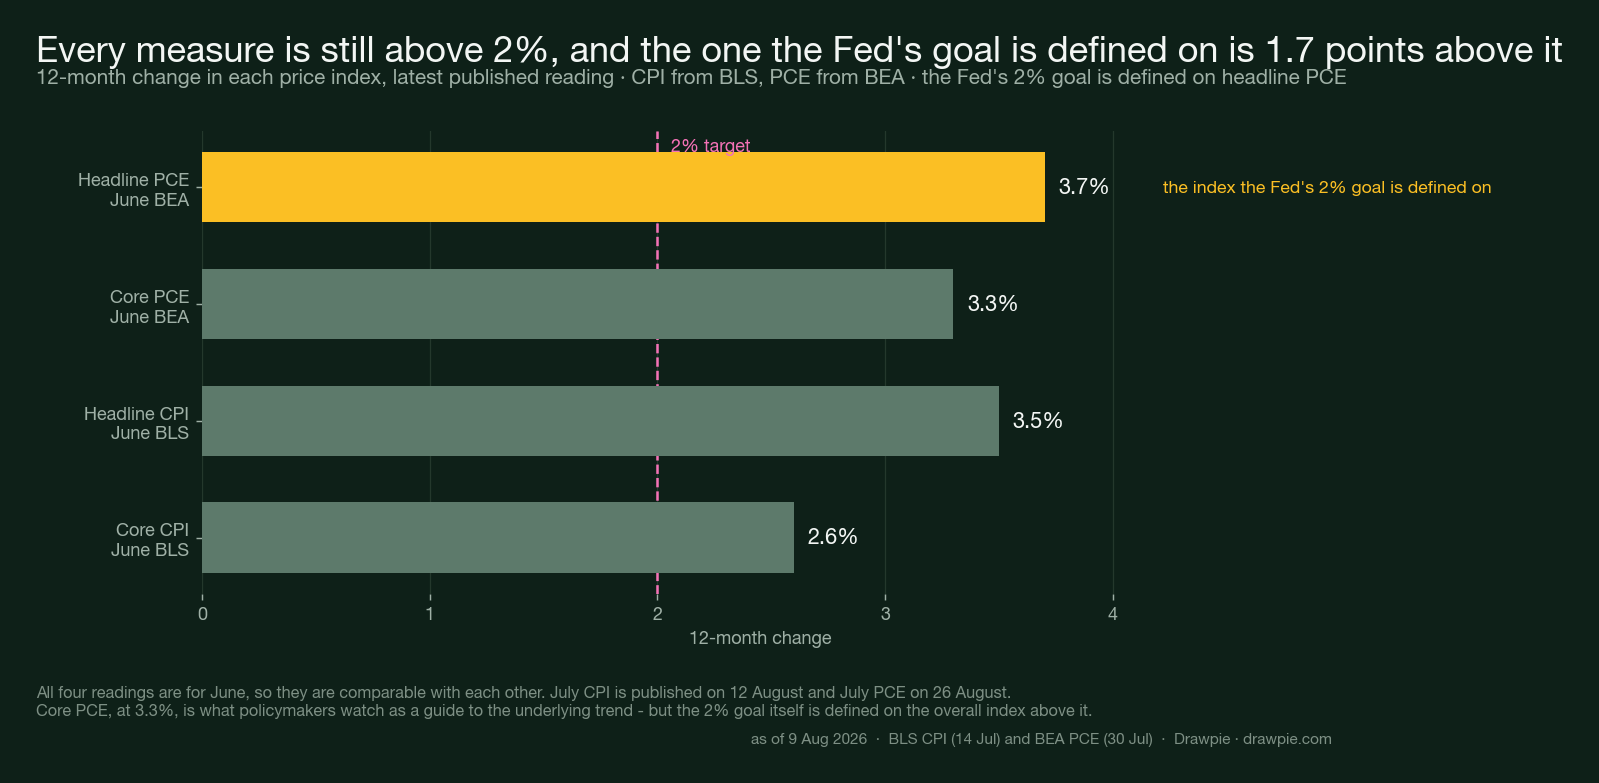
| Measure | 12 months to June | Source |
|---|---|---|
| Headline PCE | 3.7% | BEA |
| Core PCE | 3.3% | BEA |
| Headline CPI | 3.5% | BLS |
| Core CPI | 2.6% | BLS |
It is worth being exact about which index the target is. The FOMC’s goal is 2% “as measured by the annual change in the price index for personal consumption expenditures” — the overall PCE index, not the core one. That measure is 3.7%, 1.7 points above target, and it is the highest of the four.
Core PCE, at 3.3%, is not the target. It is what policymakers lean on as a guide to the underlying trend, because it strips out the food and energy prices that move the headline around — which is a different job from being the goalpost. Both numbers matter, for different reasons.
There is one genuinely new thing in that core figure. Our July piece on the Fed documented core PCE climbing in six of the seven months to May, reaching 3.41%. The June reading, published on 30 July, was 3.3% — the first fall in that run. One month is one month, but it is the first time that series has bent.
The headline CPI fall in June was energy, not a broad cooling. All items fell 0.4% on the month, the largest one-month drop since April 2020, and the energy index fell 5.7%. Core CPI, which excludes energy, was 2.6% over the year and barely moved. Over twelve months energy is still up 15.7%.
The next reading lands on Wednesday 12 August, when BLS publishes July CPI at 8:30 a.m. Eastern. July PPI follows on the 13th and July PCE on the 26th.
What did the Fed do, and when does it next decide?
It held, and three officials voted to raise rates. On 29 July the FOMC kept the target range at 3.50–3.75% by 9 votes to 3, with Beth Hammack, Neel Kashkari and Lorie Logan all preferring a quarter-point increase.
The direction of that dissent is the thing to register. These were not calls for a cut. We covered the decision and the inflation curve behind it in full here .
Remaining 2026 meetings:
| Meeting | Dates | Projections |
|---|---|---|
| Next | 15–16 September | yes |
| — | 27–28 October | no |
| — | 8–9 December | yes |
Meanwhile the market’s own borrowing costs moved without the Fed. The US 10-year Treasury yield closed at 4.66% on 7 August, against 4.16% at the end of 2025 — 50 basis points higher so far in a year in which the policy rate itself has not moved at all. The last change to the target range took effect on 11 December 2025.
What have stocks actually done this year?
All four major indices are up double digits, and one of them set a record on the day the jobs report landed.
| Index | 7 Aug close | YTD |
|---|---|---|
| Russell 2000 | 3,034.49 | +22.3% |
| Nasdaq Composite | 26,690.62 | +14.8% |
| S&P 500 | 7,757.64 | +13.3% |
| Dow Jones | 54,036.93 | +12.4% |
The S&P 500’s 7,757.64 was a record close, beating the 7,736.52 it set three sessions earlier on 4 August. It is worth being precise about which record that is: the index has still not regained the 7,793.68 it reached intraday on 5 August, so on that measure it was approaching a high rather than setting one — which is how some coverage described it that week. The Russell 2000, the small-cap index, is the year’s leader and sits a tenth of a percent below its own 4 August peak. The Nasdaq is the laggard of the four relative to its own high, 1.5% below the peak it set back on 2 June.
Volatility has been unremarkable: the VIX closed at 14.90, essentially where it ended 2025. It is easy to forget it reached 31.05 on 27 March.
Gold is the outlier. COMEX futures settled at $4,399.70 on 7 August — up just 1.7% on the year, and still 17.3% below the $5,318.40 peak of 29 January. It rose 3.7% on 7 August itself, in the session after the jobs report — and that single session flipped its sign for the year, from down 1.9% at Thursday’s close to up 1.7% at Friday’s. Our gold piece was written before that session settled and correctly reports the 6 August close of $4,242 and a year-to-date fall; the two articles differ because the day in between moved 3.7%, not because either is wrong.
What is on the calendar for the rest of August?
No policy decision — but the Fed is not absent from the calendar.
| Date | What |
|---|---|
| Wed 12 Aug | July CPI, 8:30 a.m. ET |
| Thu 13 Aug | July PPI |
| Tue 18 Aug | July import and export prices |
| Wed 26 Aug | July PCE; Q2 GDP second estimate |
| Thu 27–Sat 29 Aug | Jackson Hole symposium |
| Fri 28 Aug | Preliminary benchmark revision to payrolls |
| Mon 31 Aug | Employment cost index, Q2 |
| Fri 4 Sep | August employment report |
| 15–16 Sep | FOMC decision, with projections |
Two things there are easy to miss. The Kansas City Fed’s Jackson Hole symposium runs 27 to 29 August, on the theme “Financial Innovation: Implications for Payments and Policy” — not a policy meeting, but the one August event at which senior central bankers speak at length.
And on 28 August the BLS publishes its preliminary estimate of the annual benchmark revision to payroll employment. Given that this month’s story is two months being revised away by 103,000 jobs, a scheduled revision to the whole level is worth a note in the diary.
So: no rate decision until mid-September, but “quiet month” would be the wrong description.
What does none of this tell you?
Where any of it goes next. This article does not forecast the level of an index, the path of inflation, or what the Fed will do in September, and it does not repeat anyone else’s forecast of those things. That is a standing rule here rather than a hedge for this particular month.
It is worth being blunt about why, because August 2026 is a good illustration. A falling payroll count, a record equity close and a core inflation rate above 3% all landed within a week of each other. Any story that makes those three fit together neatly is doing so by choosing which one to emphasise.
What the published data does support is narrower and more durable:
- The labour market produced 60,000 jobs across three months, and that figure is only known because two of those months were revised down after publication. Revisions are not noise; they changed the picture.
- Inflation has not returned to target on any measure, and the index the Fed’s goal is actually defined on — overall PCE — is the furthest above it of the four, at 3.7%.
- The policy rate has not moved since December 2025, while the 10-year yield has risen 50 basis points.
If you want the structural version of the investing question rather than the monthly one, our look at whether a US private pension is actually worth it covers who the workplace retirement system reaches and who it misses — a question the monthly data never answers.
Sources
Checked on 9 August 2026. Market figures are closes from Friday 7 August, the most recent settled session.
| Source | What it supports here |
|---|---|
| BLS — Employment Situation, July 2026 (USDL-26-1291) | The −23,000 payroll change, the 4.1% unemployment rate, the May and June revisions and their stated sizes, the industry detail, average hourly earnings, participation and the 4 September release date |
| BLS — Consumer Price Index, June 2026 (USDL-26-1191) | Headline CPI 3.5% and core CPI 2.6% over 12 months, the −0.4% monthly fall and that it was the largest since April 2020, and the 5.7% energy decline |
| BEA — Personal Income and Outlays, June 2026 | Headline PCE 3.7% and core PCE 3.3% over 12 months, and the monthly changes |
| BLS — CPI release schedule | July CPI on 12 August and August CPI on 11 September, both 8:30 a.m. |
| Federal Reserve — FOMC calendar | The remaining 2026 meeting dates and which carry projections |
| Drawpie — Fed rate decision, July 2026 | The 29 July hold at 3.50–3.75%, the 9–3 vote and the three named dissenters |
Index and commodity closes are from Yahoo Finance daily data, taken after Friday’s settlement. Year-to-date changes are our own arithmetic on those closes against each series’ last close of 2025.
How we verified this
This article contains no forecast. It does not predict a price, a level, an index, a rate decision or a direction, and it does not carry anyone else’s prediction of any of those. Every number in it is either something that has already been published or a date that has already been scheduled. That is a deliberate constraint on this site, not an omission.
It is also not investment advice. Nothing here is a recommendation to buy, sell or hold anything, and no security is assessed as cheap, expensive or attractive.
Market figures are settled closes, not live quotes. This was written on Sunday 9 August 2026, so the most recent close is Friday 7 August and every level is final. Year-to-date figures are measured from each index’s last close of 2025. They are index levels, so they exclude dividends and are not total returns. “Below its peak” means below the highest closing level of 2026, not the highest intraday print.
The S&P 500’s record here is a closing record, and its intraday record is higher. The index closed at 7,757.64 on 7 August, above its previous closing high of 7,736.52 on 4 August, and that is the highest close in its history. It has not regained the 7,793.68 it touched intraday on 5 August — which is why some coverage that week described it as approaching a record rather than setting one. Both statements are true of different measures. Every peak in this article is a closing peak, on every index.
Index closes were checked against a second source. The four closes are as published by CNBC’s quote pages for 7 August 2026 as well as by the daily data used to build the charts: S&P 500 7,757.64, Nasdaq 26,690.615, Dow 54,036.93, Russell 2000 3,034.494.
The two inflation indices are on the same reference month here, deliberately. All four readings are for June. CPI figures are BLS’s own published 12-month rates from the June release; PCE figures are BEA’s from Personal Income and Outlays for June. An earlier article on this site computed the same CPI series to two decimals from BLS index levels and shows 3.53% and 2.59% where this one shows BLS’s published 3.5% and 2.6%. Same data, different rounding.
One number here updates that earlier piece. It reported core PCE rising in six of the seven months to May 2026, reaching 3.41%. June, published on 30 July, came in at 3.3% — the first fall in that run.
Payroll revisions are quoted from the release’s own revisions paragraph, which states the previous and current figures for both months explicitly, rather than being reconstructed by comparing two releases.
A correction made before publication. An earlier draft of this article, and of its inflation chart, treated core PCE as the measure the Fed’s 2% goal is defined on. It is not. The FOMC’s goal is 2% “as measured by the annual change in the price index for personal consumption expenditures” — the overall index, which was 3.7% in the year to June, 1.7 points above target. Core PCE is what policymakers watch as a guide to the underlying trend. The chart’s subtitle had it right while its own annotation had it wrong, which is how the error survived a first check.
The calendar section was corrected before publication. An earlier draft said the rest of August held “two data releases and no Fed meeting”, and that the next four weeks were “about data rather than about the Fed”. Both were wrong as completeness claims. BLS alone publishes PPI, import and export prices and the employment cost index in that window, BEA publishes a second GDP estimate alongside July PCE, and the Kansas City Fed’s Jackson Hole symposium runs 27 to 29 August. The table now lists them, taken from the BLS and BEA release calendars and the Kansas City Fed’s own page.
Where this article and our gold piece appear to disagree, both are right. That article, written on 7 August before the session settled, has gold down 1.9% on the year and 20% below its January peak; this one has it up 1.7% and 17.3% below. The gap is one trading session: gold rose 3.7% on 7 August, which was enough to flip its year-to-date sign. Each figure is correct as of the close it names.
Every agency figure was re-extracted from the source release and matched to its own sentence, so each number is bound to the subject it describes rather than merely appearing somewhere on the page. That check confirmed, among others, that the +36,000 figure is health care’s own 12-month average and that “largest 1-month decrease since April 2020” refers to the all-items CPI. The 26 August date is from BEA’s published schedule, which names that release as covering July 2026.