Microsoft vs Meta Free Cash Flow: 30 Quarters Compared

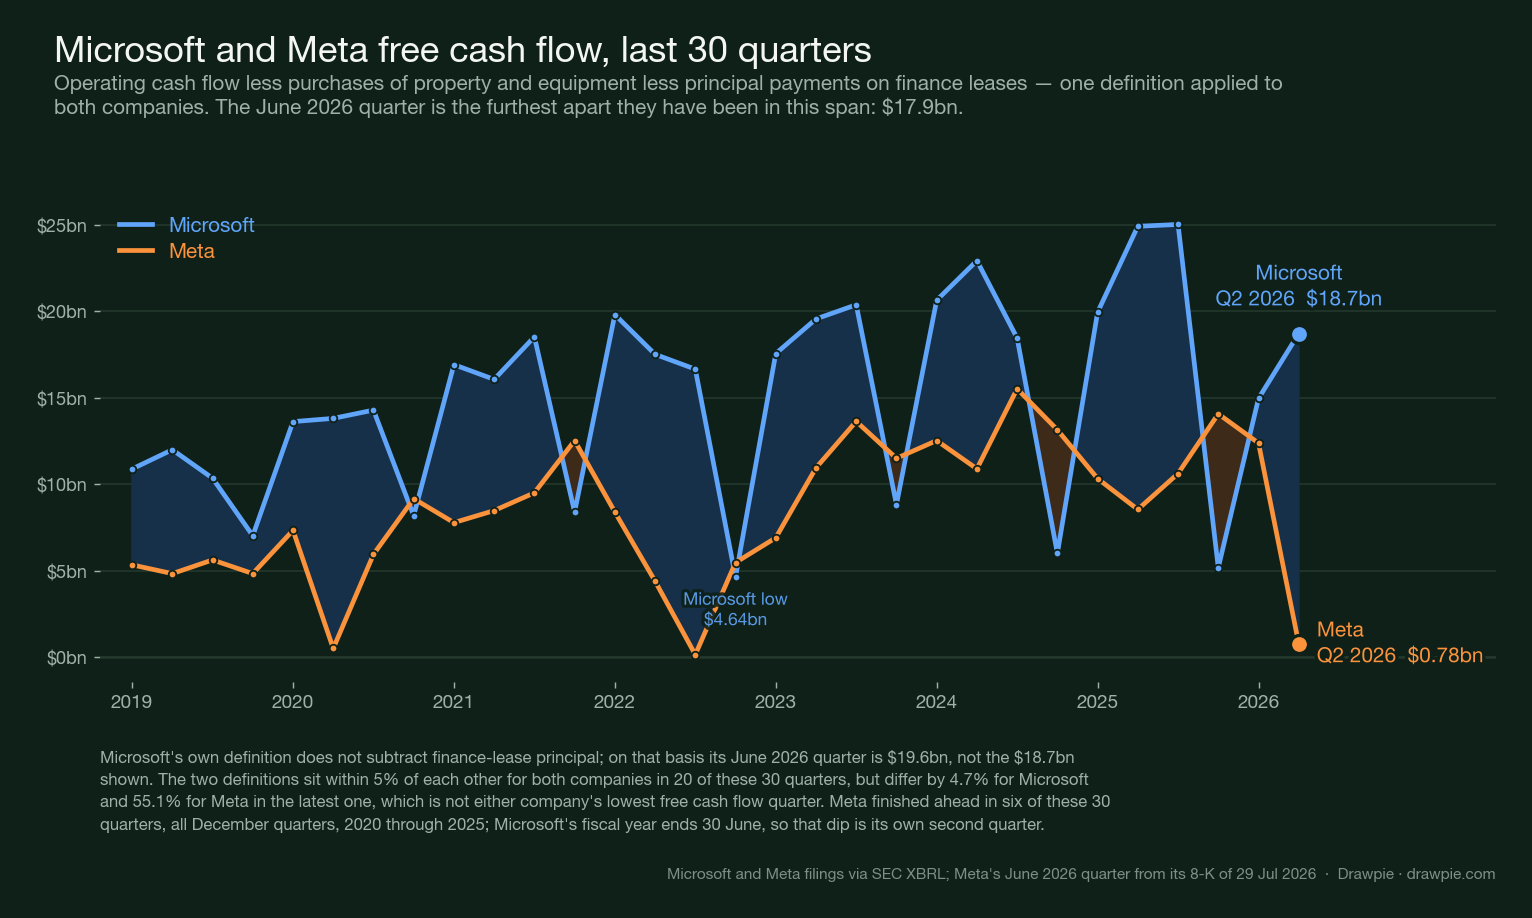
- In the June 2026 quarter Microsoft generated $18.7 billion of free cash flow and Meta generated $784 million — $17.9 billion apart, the widest gap in the 30 quarters since the start of 2019. The obvious explanation is the wrong one: Microsoft’s capital spending grew faster than Meta’s over the year, not slower.
- The difference is intensity, not size. Meta spent 97.5% of its operating cash flow on property, equipment and finance-lease principal in the quarter. Microsoft spent 66.2%. Against 30-quarter medians of 43.2% and 33.8%, both roughly doubled — but only one of them ran out of room.
- Meta has been here once before. Its only other quarter above 90% was Q3 2022, at 98.4%, when free cash flow fell to $154 million. Intensity then fell for four straight quarters and free cash flow recovered to $13.6 billion by Q3 2023 — but mostly because operating cash flow rose 111% over that stretch, not because spending fell 29%.
- Over the trailing four quarters the gap is far less dramatic: $63.9 billion for Microsoft against $37.9 billion for Meta. One quarter is not a trend: Microsoft’s own worst reading in this span, $4.6 billion in December 2022, is lower than every quarter Meta posted from early 2023 until this one.
In the quarter ended 30 June 2026, Microsoft generated $18.7 billion of free cash flow and Meta generated $784 million. That is $17.9 billion apart — the widest the two have been in the 30 quarters since the start of 2019, and wider than the $16.5 billion gap of the third quarter of 2022, which had held the record.
The explanation that suggests itself is that Meta is spending more aggressively on AI infrastructure. Over the year to June 2026, it is not what the filings show. Microsoft’s capital spending grew 107.2%; Meta’s grew 82.7%. The company whose free cash flow survived is the one that increased its spending faster.
Why did Meta’s free cash flow collapse when Microsoft’s held up?
Because free cash flow is a subtraction, and what matters is not how much a company spends but how much of its own operating cash flow the spending consumes.
| June 2026 quarter | Operating cash flow | Capital spending | Share consumed |
|---|---|---|---|
| Microsoft | $55,441m | $36,724m | 66.2% |
| Meta | $31,862m | $31,078m | 97.5% |
Capital spending here is purchases of property and equipment plus principal payments on finance leases, the same basis on both rows.
Meta spent 97.5 cents of every dollar of operating cash flow it generated. Microsoft spent 66.2 cents. Both figures are roughly double each company’s own 30-quarter median — 43.2% for Meta and 33.8% for Microsoft — so both are in unusual territory by their own standards. Only one of them ran out of room.
The absolute numbers make the point from the other direction. Microsoft’s capital spending in the quarter, $36.7 billion, was larger than Meta’s $31.1 billion. It was also larger than Meta’s entire operating cash flow. Microsoft could absorb it because it started from $55.4 billion of operating cash flow against Meta’s $31.9 billion.
Has Meta spent this share of its cash flow before?
Once, and the sequel is on the chart.
In exactly two of these 30 quarters has Meta’s capital spending exceeded 90% of its operating cash flow: the third quarter of 2022, at 98.4%, and this one, at 97.5%. The 2022 quarter produced $154 million of free cash flow, the lowest reading in the whole series.
What followed is the part worth knowing:
| Quarter | Share of operating cash flow consumed | Free cash flow |
|---|---|---|
| Q3 2022 | 98.4% | $0.15bn |
| Q4 2022 | 62.2% | $5.48bn |
| Q1 2023 | 50.6% | $6.91bn |
| Q2 2023 | 36.7% | $10.96bn |
| Q3 2023 | 33.1% | $13.64bn |
Intensity fell in each of those four quarters and free cash flow rose in each of them, reaching $13.6 billion — at that point the highest of the series. A single quarter at 97% is therefore a fact about a quarter, not a verdict on a company.
But it is worth seeing which half of the ratio did the work, because the answer is not the one usually told. Between Q3 2022 and Q3 2023, Meta’s capital spending fell 29% — and its operating cash flow rose 111%. The denominator moved almost four times as far as the numerator. The recovery was mostly Meta earning its way out, and only partly Meta spending less.
That distinction matters for how much comfort to take from the precedent. It shows Meta has taken this ratio to the edge before and brought it back. It does not show the same route is available: repeating 2023 would mean roughly doubling operating cash flow again, from a base three times as large. And on the spending side Meta has guided to more, not less — a 2026 capital expenditure range of $130–145 billion against $50.9 billion spent in the first half on the same basis, which makes the second half of this year the larger half.
Why do both lines need the same definition of free cash flow?
Because the two companies do not use the same one, and the difference is not small where it matters.
Meta defines free cash flow as operating cash flow, less purchases of property and equipment, less principal payments on finance leases. Microsoft defines it as operating cash flow less additions to property and equipment, with no lease term in it. Finance-lease principal sits in financing activities for both companies; Microsoft simply never subtracts it.
Both are real, published definitions. Applying one company’s definition to the other’s numbers produces a figure neither publishes. So the chart uses Meta’s stricter definition on both lines, and the cost of that choice is stated: Microsoft’s June quarter reads $18.7 billion here rather than the $19.6 billion Microsoft reports.
For most of these 30 quarters, the choice barely matters. The median gap between the two definitions is 1.5% for Microsoft and 2.8% for Meta, and in 20 of the 30 quarters both companies’ gaps are under 5% in the same quarter. In the latest quarter they differ by 4.7% for Microsoft and 55.1% for Meta. The gap is finance-lease principal measured against what is left after property and equipment, so it widens when that remainder shrinks, when the principal itself grows, or both. At Meta this quarter it was both: free cash flow collapsed and finance-lease principal roughly doubled year-over-year, from $474 million to $962 million.
That is why the widest gap and the lowest free cash flow are not automatically the same quarter. Microsoft’s lowest free cash flow reading is December 2022; its widest definition gap is December 2025. Meta’s lowest is Q3 2022; its widest is this one. The two travel together loosely, not exactly — which is itself a reason to state the definition rather than bury it.
Why is Meta ahead in every December quarter?
In six of these 30 quarters Meta finished ahead of Microsoft. All six are December quarters, one in each year from 2020 through 2025. In the other 24 quarters, including every March, June and September quarter in the series, Microsoft was ahead.
That is Microsoft’s fiscal calendar, not a seasonal strength at Meta — but not for the reason it is usually given. Microsoft’s financial year ends on 30 June, so October–December is its fiscal second quarter, and in all seven complete fiscal years covered here that quarter is its lowest for operating cash flow. It is not its heaviest for capital spending: on the basis used throughout this article, the heaviest quarter in every one of those seven years is the June quarter, Microsoft’s fiscal fourth. Both patterns are seven for seven.
For six of those seven years the December dip was almost entirely the cash coming in. Operating cash flow fell by between $3.1 billion and $12.0 billion from the September quarter, while capital spending moved by less than $0.8 billion in either direction — sometimes up, sometimes down, never enough to matter.
The most recent December quarter broke that. Between September and December 2025, Microsoft’s operating cash flow fell $9.3 billion and its capital spending rose $10.5 billion, so for the first time in this series the spending side was the larger mover. Free cash flow went from $25.0 billion to $5.2 billion. Its three lowest readings in the series — $4.64 billion, $5.18 billion and $6.01 billion — are the December quarters of 2022, 2025 and 2024, but only the middle one was mostly about capital spending.
The pattern is a caution about single quarters in general. Read the December quarters alone and Meta out-earns Microsoft on cash six years running; read any other quarter and it never does.
What the two companies have said about the rest of the year
Meta has guided 2026 capital expenditure, including finance-lease principal, to $130–145 billion, narrowed from an earlier $125–145 billion. It spent $50.9 billion in the first half on that basis, so the remaining range implies a materially larger second half.
Microsoft told investors on 29 July that its calendar-2026 capital expenditure expectation is approximately $175 billion, down from roughly $190 billion three months earlier, and attributed the entire reduction to leases reclassifying from finance to operating rather than to any change in what it plans to build. It also said fiscal-2027 capital expenditure will grow year-over-year.
Those two figures should not be set against each other. Meta’s range counts finance-lease principal — cash actually repaid on existing leases. Microsoft’s expectation counts finance leases entered into, which is a different measure of a different thing. Two numbers that both get called “capital expenditure including leases” are not necessarily comparable, and this is precisely why the chart above is built from cash flow statement lines rather than from guidance.
What to watch
The ratio, not the headline. To be clear about what this ratio is: it is not a leading indicator. Free cash flow is operating cash flow minus capital spending, so a quarter at 97% of operating cash flow and a quarter with almost no free cash flow are one event described two ways, not a warning followed by a result. What the ratio adds is comparability — it puts companies of different sizes on one scale, and it is the form in which both the 2022 squeeze and the 2023 recovery are legible. Meta’s September quarter, which on its usual schedule reports in late October, is the next reading.
Whether Microsoft’s intensity goes back up. It is not climbing right now: 85.5% in December 2025, then 67.9%, then 66.2%. Two quarters of retreat, from a spike, to a level that is still double its own 30-quarter median. The question is what the coming December quarter does to it — that is the quarter that produced the spike, and it arrives this year with capital spending running far above last year’s.
The full-year picture rather than the quarter. Over the trailing four quarters Microsoft produced $63.9 billion of free cash flow and Meta produced $37.9 billion. That is a real gap, and it is nothing like $17.9 billion. Single quarters at these companies are dominated by timing — but not always on the same side of the subtraction. Meta’s latest quarter is about capital spending; six of Microsoft’s seven December dips are about operating cash flow. That is exactly why 30 quarters are drawn above rather than one.
Sources
Every figure above comes from one of these. Each was checked on 31 July 2026.
| Source | What it supports here |
|---|---|
| SEC XBRL company facts, Microsoft | Microsoft’s 30-quarter operating cash flow, additions to property and equipment, and finance-lease principal payments |
| SEC XBRL company facts, Meta Platforms | Meta’s equivalent 30-quarter series |
| Meta Q2 2026 results (Exhibit 99.1 to the 8-K, 29 July 2026) | The June 2026 quarter’s operating cash flow, capital expenditure and $784m of free cash flow, and Meta’s own definition of free cash flow |
| Microsoft FY2026 Form 10-K | The fiscal-2026 cash flow statement used to check the quarterly differencing |
| Microsoft FQ4 FY2026 earnings call | The four quarters of operating cash flow and cash paid for property and equipment, the $19.6bn free cash flow figure, the approximately $175 billion calendar-2026 expectation and its lease-reclassification explanation, and fiscal-2027 capital expenditure growing |
| Meta Q2 2026 follow-up call transcript (PDF) | The $130–145 billion 2026 range and the narrowing from $125–145 billion |
How we verified this
Both series are built from the companies’ own filings through the SEC’s XBRL company-facts API, not from a data vendor, and the code that builds them is in the repository alongside the chart. Cash flow statements are cumulative from the start of the fiscal year, so standalone quarters have to be obtained by differencing year-to-date figures — and the two companies do not share a fiscal year. Meta’s is the calendar year; Microsoft’s ends 30 June. Quarters here are keyed to the calendar quarter each period ends in, which is what allows one x-axis.
That differencing is checked rather than assumed. Meta’s Q2 2025 free cash flow derived this way comes to $8,549 million, which is what Meta published. Microsoft’s four fiscal-2026 quarters sum to $182,935 million of operating cash flow and $115,948 million of additions to property and equipment, matching its fiscal-2026 cash flow statement, and each individual quarter matches the figures its CFO stated on the four earnings calls — 45.1, 35.8, 46.7 and 55.4 billion of operating cash flow, and 19.4, 29.9, 30.9 and 35.8 billion of cash paid for property and equipment. The last of those is the check that matters, because it tests the July-start differencing against four independently stated quarters rather than against the annual total it was derived from. The script refuses to write its data file if any of them fails.
One definition is applied to both companies, and it is not Microsoft’s. Meta defines free cash flow as operating cash flow less purchases of property and equipment less principal payments on finance leases; Microsoft’s definition has no lease term in it. Drawing each company’s own measure would put two different things on one axis. Both lines here use Meta’s stricter definition, so Microsoft’s June 2026 quarter reads $18.7 billion rather than the $19.6 billion Microsoft itself reports. Across most of this span the difference is small — a median of 1.5% for Microsoft and 2.8% for Meta, with both under 5% in the same quarter 20 times out of 30 — but in the latest quarter they differ by 4.7% for Microsoft and 55.1% for Meta, because finance-lease principal grew while free cash flow collapsed — Meta’s principal payments roughly doubled year-over-year, so the widening is not simply a fixed subtraction against a shrinking base, and the widest gap is not necessarily the lowest free cash flow quarter.
Meta’s June 2026 quarter is taken from Exhibit 99.1 to its 8-K of 29 July 2026 because company-facts had not yet propagated the 10-Q filed on 30 July. That is an API lag, not a missing filing; the script switches to the API automatically once it appears and asserts that the two agree.
Two things are deliberately not claimed. The companies’ capital spending guidance figures are not compared with each other, because they are not on the same basis — Meta’s 2026 range counts finance-lease principal, while Microsoft’s calendar-2026 expectation counts finance leases entered into, which is a different measure from principal repaid. And no causal claim is made about either share price; this article is about cash flow statements.