Meta Stock Falls as Free Cash Flow Drops to $784 Million

- Free cash flow was $784m, against $8,549m a year earlier — a fall of 91%, and the third-lowest quarter of the last 30. Only Q3 2022 and Q2 2020 were lower.
- This is not a demand problem. Operating cash flow rose 25% to $31.9bn and revenue rose 28%. Capital expenditure including finance-lease principal rose 83% to $31.1bn and consumed almost all of it.
- Operating margin fell to 31% from 43%, the lowest since Q2 2023. Meta says that excluding $2.4bn of legal charges and $1.18bn of severance, operating income would have risen 9% rather than falling 8%.
- The 10-Q filed the next day carries the scale behind it: $278.99bn of leases not yet commenced at 30 June, a further ~$68bn of data centre leases signed in July, and $349.31bn of non-cancelable contractual commitments with about $81.65bn falling due in 2027. These are multi-year commitments, not a second capex number, but they are why one quarter is not the story.
- Two things the press release does not headline and neither earnings call discussed: Meta bought back no stock at all this quarter, against $10.2bn a year ago, and raised $24.9bn of long-term debt in the same three months.
Meta generated $784 million of free cash flow in the three months to 30 June 2026. A year earlier the figure was $8.5 billion. That is not a rounding difference or a seasonal wobble — it is the third-lowest quarter Meta has reported in seven and a half years, and it happened while revenue grew 28%.
The stock was down about 9% in Thursday’s session. What follows is where the money went.
How bad is $784 million, in context?
Only two quarters since the start of 2019 have been lower.
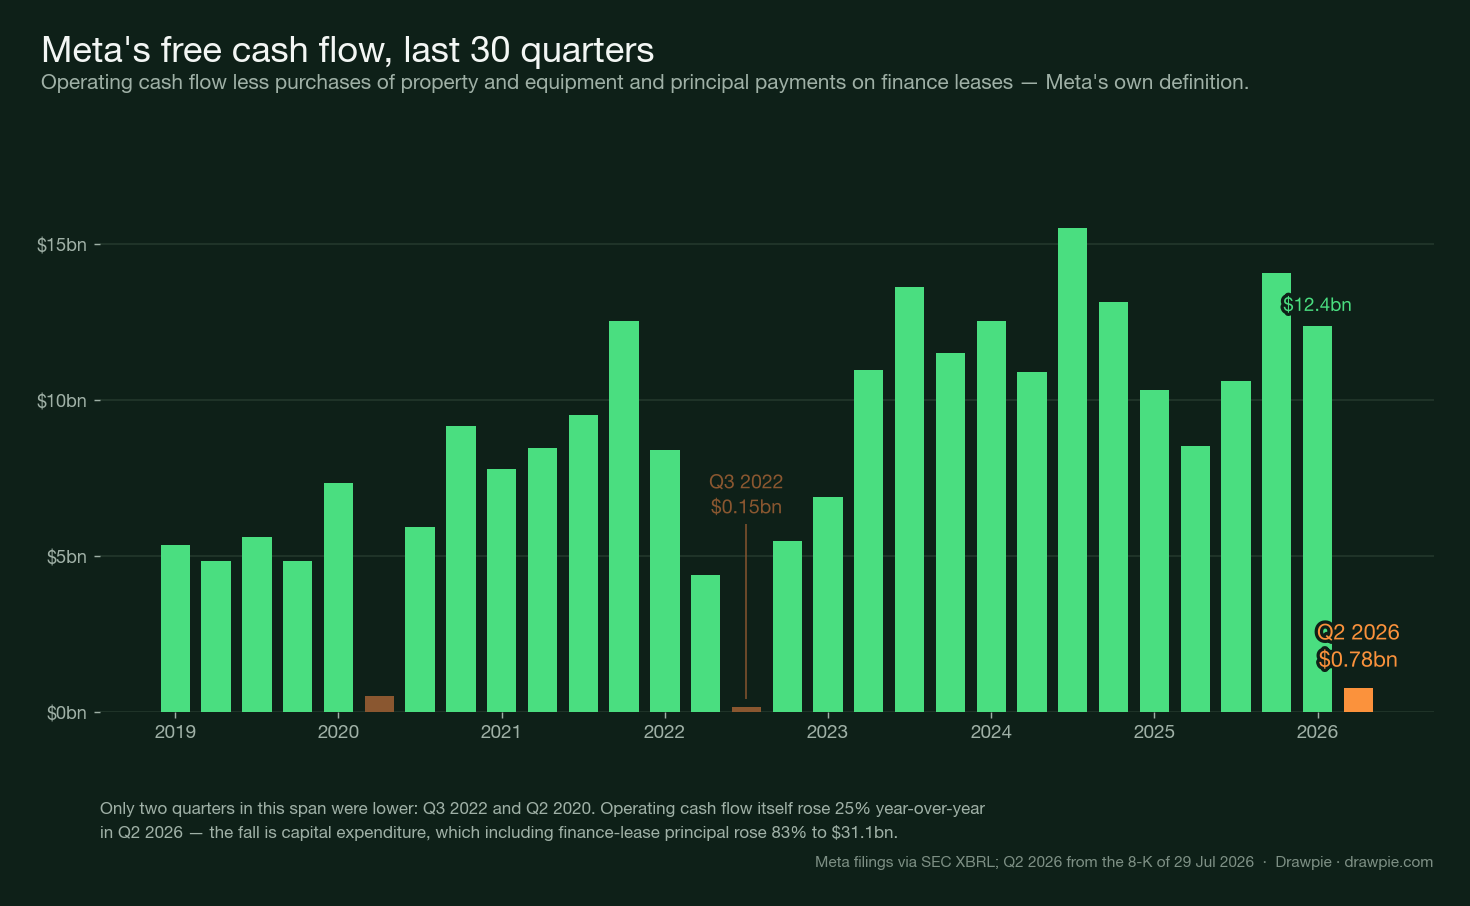
The comparison that matters is the one immediately to the left of it. Meta produced $12.4 billion of free cash flow in the March quarter and $784 million in the June quarter. Nothing in the revenue line explains a move like that.
The other one worth looking at is Q3 2022, at $154 million. That was the quarter in the middle of Meta’s last capital-spending scare — the one that ended with the stock at $88, a “year of efficiency” and a headcount cut. The chart is not a forecast, and the two episodes have different causes. But it is the last time this number went to nearly nothing, and it is why the market treats a near-zero print here as a signal rather than a quirk.
Why did it fall, if revenue grew 28%?
Because the cash the business generated grew, and the spending grew faster.
| Q2 2026 | Q2 2025 | Change | |
|---|---|---|---|
| Net cash from operating activities | $31,862m | $25,561m | +25% |
| Purchases of property and equipment | $(30,116)m | $(16,538)m | +82% |
| Principal payments on finance leases | $(962)m | $(474)m | +103% |
| Free cash flow | $784m | $8,549m | −91% |
Operating cash flow did what a healthy quarter should do — it rose a quarter. Capital expenditure, on Meta’s headline definition that includes finance-lease principal, went from $17.0 billion to $31.1 billion. CFO Susan Li attributed it on the call to “investments in servers, data centers, and network infrastructure.”
That is the whole arithmetic, and the fall sits in one line. Meta is careful about what its measure means, and the caution is worth carrying: free cash flow here “is not intended to represent our residual cash flow available for discretionary expenditures.” It is operating cash flow after the spending on property, equipment and finance leases — no more than that, and this quarter there was almost none of it.
What happened to margins?
They went to 31%, from 43% — and about half of the fall has a name.
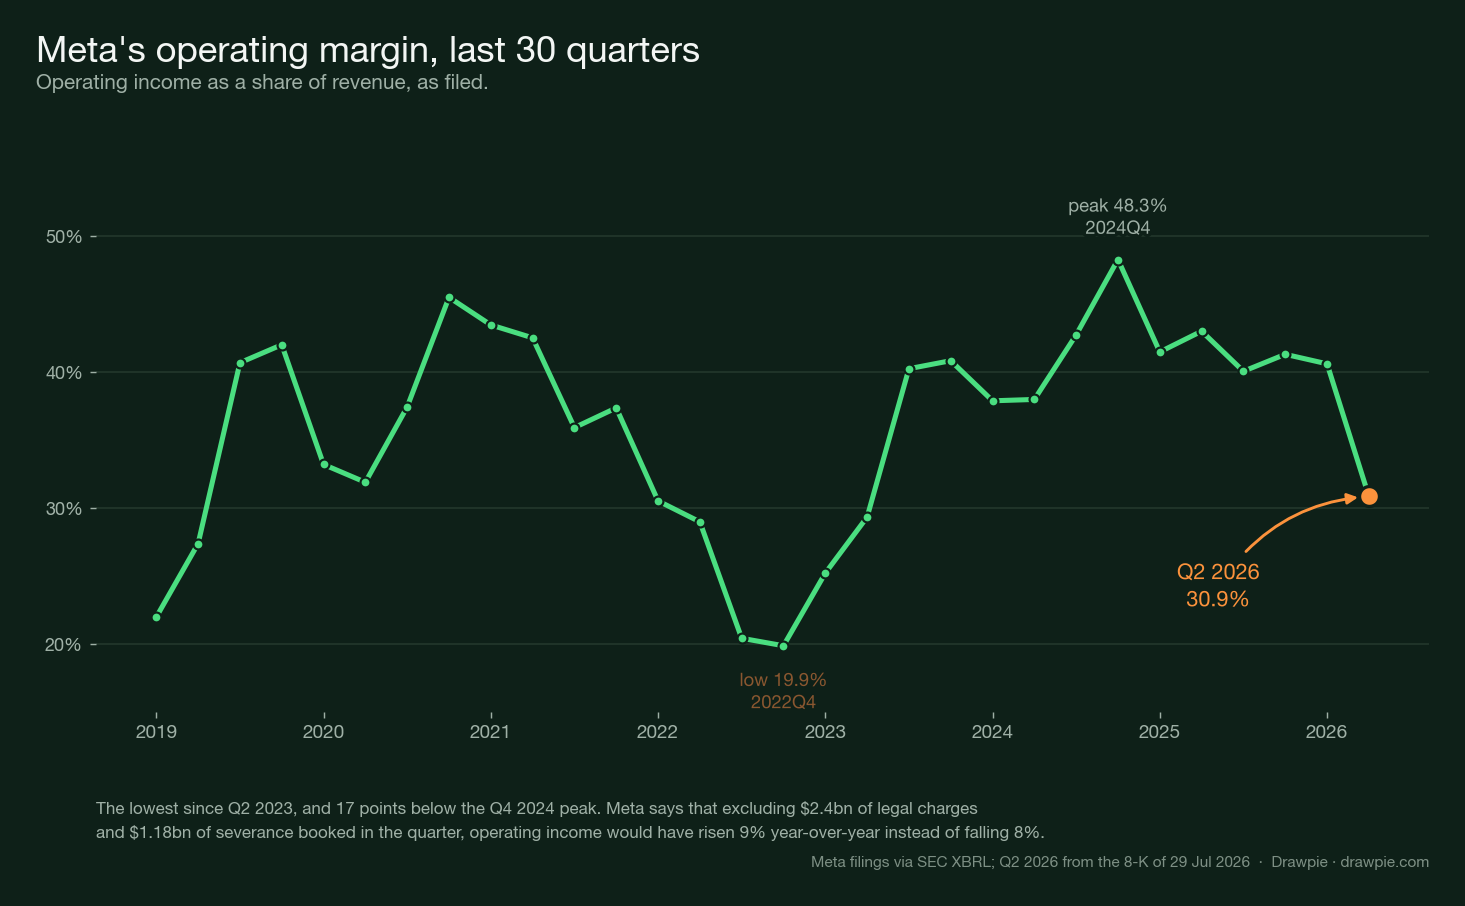
Revenue was $60.8 billion, up 28%. Total costs and expenses were $42.0 billion, up 55%. Operating income fell 8% to $18.8 billion, and the margin fell to 30.9% — the lowest since the second quarter of 2023, and seventeen points below the peak set at the end of 2024.
Inside that 55% cost increase are two items Meta calls out: $2.4 billion of charges related to legal proceedings and $1.18 billion of severance from the May 2026 headcount reduction. Susan Li’s framing on the call was direct: “Excluding the Q2 legal charges and severance expenses, our second quarter operating income would have increased 9% year-over-year.”
Take that at face value and the two problems separate. The one-off charges turn +9% into −8% on the income line. The free cash flow collapse is a different story, and a bigger one — but the charges are not cleanly absent from it either. Free cash flow starts at operating cash flow, so any part of those charges settled in cash during the quarter reduced it. The 10-Q does not break out how much of the $2.4bn and $1.18bn was paid rather than accrued, so the honest position is that capital expenditure is the dominant arithmetic cause of the fall, not the only possible one.
One line does deserve attention on its own. Family of Apps operating income fell 6.3%, to $23.4 billion from $25.0 billion, on revenue up 28%. Reality Labs lost $4.6 billion, almost exactly what it lost a year ago. Whatever is compressing profitability, it is not primarily the metaverse division this time.
The part nobody asked about
Meta bought back no stock at all in the quarter, and borrowed $24.9 billion.
The cash flow statement is blunt about it. Repurchases of Class A common stock: $0 in the June quarter, against $10,167 million a year earlier. For the first half: $0, against $22,921 million. In the same three months, proceeds from issuance of long-term debt, net, were $24,910 million, and Meta ended the quarter with $83.7 billion of debt against $90.3 billion of cash and marketable securities.
Put the three together and the quarter reads as one decision. Free cash flow near zero, the buyback switched off, and $25 billion raised in the debt market.
Neither the earnings call nor the follow-up call discussed it. Across both full transcripts, “buyback”, “share repurchase”, “capital return”, “dividend” and “repurchase” appear zero times between them. Analysts asked about capex, about compute, about renting capacity out — not about the halt to a programme that returned $22.9 billion in the equivalent period last year.
To be fair to the omission: Meta paid $1.35 billion in dividends and dividend equivalents, so capital return has not stopped entirely, and the 10-Q confirms the repurchase authorisation is intact — $25.03 billion still available, unchanged from year-end, simply unused. A company can pause a buyback for many reasons and is not obliged to explain. But it is a large change, and it went unremarked.
The commitments behind the quarter
The 10-Q, filed the following day, explains why one quarter of near-zero free cash flow is not the interesting part.
Meta discloses $278.99 billion of operating and finance leases that had not yet commenced at 30 June — “consisting of data centers, colocations, and certain network infrastructure”, starting between the rest of 2026 and 2036, on terms running from over a year to 30 years. Then, in the same note: in July 2026 Meta signed approximately $68 billion more of data centre leases, expected to commence in 2027 and 2028 on 18-to-20-year terms.
Separately, it reports $349.31 billion of non-cancelable contractual commitments — largely third-party cloud capacity, servers and network infrastructure, data centres, and Reality Labs hardware — of which roughly $53.52 billion falls due in 2026 and $81.65 billion in 2027. On top of that sit contingent obligations to buy up to $14.72 billion of cloud capacity over five years, which shrink if the provider can resell it.
There is even a small tell in the cash line. Escrow requirements under multi-year infrastructure purchase agreements caused $10.80 billion of money market funds to be reclassified as restricted cash at 30 June. The 10-Q’s wording is that these funds are “restricted from general corporate use” — not that they are unusable. They are earmarked for the infrastructure purchases they secure.
Some care is needed with these numbers, because they are not a second capex figure. They are multi-year commitments, not a single year of spending, so they cannot be set against the $130–145 billion 2026 capex range as if the two were comparable. Leases are recognised at discounted values when they commence, so the headline totals never land on the balance sheet one-for-one. Parts are conditional. And this is a required disclosure sitting where it belongs, not something dug out.
What they do establish is direction. A company whose free cash flow just went to $784 million has, by its own schedule, roughly $81.65 billion of non-cancelable commitments falling due in 2027 — a figure measured at 30 June, so before the July leases were signed at all. Those add approximately $68 billion of lease obligations commencing in 2027 and 2028, spread across 18-to-20-year terms rather than landing in any one year.
It is tempting to draw the line straight from there to the halted buyback and the $24.9 billion of borrowing, and the three facts do sit together. But Meta does not connect them, and the filings are worth reading precisely on this point. The 10-Q discloses the commitments, the absent repurchases and the debt issuance in separate places. On the buyback it says only that the programme “may be suspended, delayed, discontinued, or accelerated at any time”, and that $25.03 billion remained available and authorized at 30 June — the same figure as at 31 December 2025, because none of it was used. No reason is given for the pause. The connection to the spending is a reading, and a reasonable one. It is not something the company states.
For scale in the same week: Microsoft disclosed $329.1 billion of leases not yet commenced in its own annual filing, arriving through fiscal 2033. Two companies, the same shape of obligation, disclosed a day apart.
What did Meta say about the rest of the year?
That the spending continues, and the range moved up at the bottom.
- Third-quarter revenue: $61–64 billion, with foreign exchange assumed to be about a 1% headwind.
- Full-year 2026 expenses: $165–169 billion. Meta says it raised the lower end to absorb the $2.4 billion of legal charges.
- Full-year 2026 capital expenditure, including finance-lease principal: $130–145 billion, described as “narrowed from our prior outlook of $125-145 billion.”
- Tax rate: 15–17% for the remaining quarters, up from a prior 13–16%.
- Operating income for the year is still expected to come in above 2025’s.
Read that capex line carefully, because “narrowed” is doing work. The ceiling did not move. The floor went up by $5 billion. On the follow-up call an analyst put it plainly, asking why Meta had “tweaked up the CapEx” — and Susan Li’s answer was that three months of extra visibility let them “make it a little bit more precise”, not that plans had changed. Both readings are available from the same sentence: the midpoint rose from $135 billion to $137.5 billion, and the company describes that as precision rather than an increase.
Next year is not framed as a slowdown either. The prepared remarks say Meta’s “current plans are geared towards maximizing 2026 and 2027 capacity”, and on financing 2027, Li said the company “will certainly evaluate all of the financing options” and would keep assessing “the right funding source and what is the right cost of capital for us as we look at our 2027 and beyond plans.” After a quarter with $25 billion of new debt, that is worth noting.
There is also a risk Meta flags itself: youth-related trials scheduled in the US this year “may ultimately result in a material loss”, on top of the $2.4 billion already booked.
What did the stock do?
It fell in two stages after the close, and has not recovered them.
Meta closed the regular session on 29 July at $585.61, already down 1.3% on the day and set before anyone had seen the results, which came out after the bell. Then:
| Time (ET) | Level | |
|---|---|---|
| 16:00, 29 July | $585.61 | regular close, pre-results |
| 16:25, 29 July | $550.72 | after the press release |
| 17:25, 29 July | $527.78 | during the earnings call |
| 19:55, 29 July | $542.49 | partial overnight recovery |
| 09:30, 30 July | $525.74 | opening print |
| 12:43, 30 July | $530.78 | intraday, session not closed |
That intraday level is 9.4% below the 29 July close. It is also 32.8% below the 52-week closing high of $790.00 set on 12 August 2025, and about 1% above the 52-week closing low of $525.72 from 27 March 2026.
Two cautions. The 30 July figure is an intraday quote with a timestamp, not a close — the session was still running, and this article will need updating when it settles. And the five-minute after-hours levels come from a consumer feed that reports no volume for extended-hours trading, so they are indicative closes; the regular-session data is properly volume-backed.
For the same week’s opposite result, Microsoft’s capex guidance stopped climbing and its free cash flow rebounded — reported the same evening, with the stock up rather than down. And for what Meta was saying about its compute when the market liked the story, see why Meta is selling its “excess” AI compute .
What to watch
The 30 July close. Everything above is intraday.
Whether free cash flow was a trough or a level. One quarter at $784 million is an event; two is a business model. The September quarter, which on Meta’s usual schedule reports in late October though the date has not been announced, is the test — and with full-year capex guided to $130–145 billion against $50.9 billion spent in the first half on the same basis (property and equipment plus finance-lease principal), the second half carries by far the larger share.
The buyback. A resumption would say the balance sheet is comfortable. Another zero quarter, alongside more debt issuance, would say the opposite.
Whether the commitments schedule moves. The 10-Q puts roughly $81.65 billion of non-cancelable commitments in 2027, measured before the July leases were signed. That schedule, updated each quarter, is a better guide to the shape of the spending than any single capex figure.
Sources
Every figure above comes from one of these. Each link was checked on 30 July 2026.
| Source | What it supports here |
|---|---|
| Meta Q2 2026 results (Exhibit 99.1 to the 8-K, 29 July 2026) | Revenue, costs, operating income and margin, net income and EPS, the $2.4bn legal charges and $1.18bn severance, capex of $31.08bn, free cash flow of $784m, the cash flow statement including the zero buyback and the $24,910m of debt issuance, segment results, and all of the CFO outlook figures |
| Meta Q2 2026 earnings call transcript (PDF) | Susan Li on capex driven by “servers, data centers, and network infrastructure”, the +9% operating income excluding charges, and the “maximizing 2026 and 2027 capacity” framing |
| Meta Q2 2026 follow-up call transcript (PDF) | The exchange on why the capex range was narrowed, and the comments on evaluating financing options for 2027 and beyond |
| Meta Form 10-Q for Q2 2026 (filed 30 July 2026) | The leases and commitments note: $278.99bn of leases not yet commenced, the ~$68bn signed in July 2026, $349.31bn of non-cancelable contractual commitments with $53.52bn and $81.65bn due in 2026 and 2027, the $14.72bn contingent cloud obligation, the $10.80bn of restricted cash, and the long-term debt maturity schedule |
| Microsoft FY2026 Form 10-K | The $329.1bn of Microsoft leases not yet commenced, used for scale only |
| SEC XBRL company facts, Meta Platforms | The 30-quarter operating cash flow, capital expenditure, finance-lease principal, operating income and revenue series behind both charts |
Share prices are from a consumer market-data feed (Yahoo Finance via the yfinance library) and are described in the verification note above.
How we verified this
All Meta figures come from the company’s own second-quarter 2026 disclosures: the results filed as Exhibit 99.1 to the 8-K of 29 July 2026, the Form 10-Q filed 30 July 2026, and the transcripts of the earnings call and the follow-up call published on Meta’s investor relations site. The quarter is the three months to 30 June 2026.
Free cash flow is Meta’s own definition, stated in that release: operating cash flow less purchases of property and equipment less principal payments on finance leases. Meta’s headline capital expenditure figure includes finance-lease principal, so the $31.1bn quoted here is on that basis; the property-and-equipment line alone was $30.1bn.
The 30-quarter series behind both charts was built from the SEC XBRL company-facts API, which serves values as tagged in Meta’s own filings — for 29 of the 30 quarters. The June 2026 quarter was taken from the 8-K results, because it had not yet propagated to that API when the series was built. Cash flow statements are cumulative from the start of the year, so the second and third quarters are obtained by differencing year-to-date values within the 10-Q sequence, and the fourth quarter is the 10-K full year less the third-quarter nine months. That derivation is checked rather than assumed: derived Q2 2025 free cash flow is $8,549m against the $8,549m Meta published, and computed operating margins for Q2 2025 and Q2 2026 are 43.0% and 30.9% against the 43% and 31% Meta published. The script that builds the series asserts all three and refuses to write the file otherwise.
The statement that neither call discussed buybacks is a term count across both full transcripts, not an impression: “buyback”, “share repurchase”, “capital return”, “dividend” and “repurchase” all appear zero times, counted with a standard PDF text extractor. An earlier version of this article reported one hit for the stem “repurchas”, and the fault was entirely ours. Our first extraction was improvised and produced letter-spaced text, so we searched it with whitespace stripped — which joins “are purchasing” into a string containing “repurchas”. The documents were never the problem; extracted properly they read normally and the counts are clean. Every quotation here was re-checked against that proper extraction.
Prices are from a consumer market-data feed, not an exchange. The 29 July close of $585.61 is a completed regular session and pre-dates the results, which were released after the close. The 30 July figure is intraday and timestamped — that session had not closed when this was written, so it is not a closing price and the article will need updating once it is. Extended-hours figures carry no volume in this feed and only closing levels are used from them. This describes what was published. It is not investment advice.