Houston Weather Forecast: Heat, Rain Chances & What to Expect This Week
This is a seven-day forecast read on one morning, and the National Weather Service reissues it several times a day. The structural call — the 100F streak breaking, near-normal highs, a rising heat index and daily sea-breeze storms — is the durable part; the daily numbers are not. From 31 August the specifics need rechecking, and if a heat advisory is issued before then, the framing changes too.
Everything else on the page is unaffected; the figures below still say when they were read.

- Houston just ran seven straight days at 100F or above, from 21 to 27 August, every one of them 6 to 8 degrees above normal. The 27 August high was 100F against a normal of 94F.
- That streak ends today. The National Weather Service has the next seven days at 92 to 95F — at or barely above the 94-95F normal for the date. The hottest day of the coming week is cooler than the coolest day of the week just gone.
- The feels-like goes the other way, climbing from 101F today to 106F by Wednesday. As the front clears and onshore flow returns, the humidity comes back with it — so the number that matters for your body rises while the thermometer falls.
- The rain chances are misleading if you read them as rain. Seven days of 6 to 35 percent chances add up to a forecast total of 0.19 inches. The wettest day of the week is the one with the second-lowest chance.
- There is no heat advisory in force, and no heat product of any kind anywhere in Texas. The entire state has two active alerts: one air quality alert and one flood advisory that expires at 7 a.m.
Houston has just finished seven consecutive days at 100F or above. Every one of them ran six to eight degrees above normal, and the last three all hit exactly 100F.
That streak ends today. The National Weather Service has the next seven days at 92 to 95F — which is to say, normal. The hottest day of the week ahead is five degrees cooler than the coolest day of the week behind.
But the number that matters for standing outside is going the other way.
What is the Houston forecast this week?
Highs in the low-to-mid 90s every day, nights in the high 70s, and a daily chance of afternoon storms that mostly will not reach you. Here is the whole seven days as the NWS has it:
| Day | High | Feels | Chance | Rain |
|---|---|---|---|---|
| Fri 28 | 95F | 101F | 17% | 0.06" |
| Sat 29 | 95F | 100F | 24% | 0.01" |
| Sun 30 | 94F | 99F | 6% | 0.00" |
| Mon 31 | 94F | 103F | 25% | 0.02" |
| Tue 1 | 92F | 105F | 35% | 0.03" |
| Wed 2 | 93F | 106F | 30% | 0.02" |
| Thu 3 | 93F | 105F | 34% | 0.05" |
“Chance” is the probability of at least 0.01 inch at any one point; “Rain” is the total actually forecast for the day. They are not the same thing, and this week they point in different directions — see below.
Overnight lows sit at 78 to 80F all week. Sunday is the outlier in both directions: the only day forecast as plainly Sunny, the lowest rain chance of the week at 6%, and the lowest feels-like at 99F.
Is this a heat wave in Houston?
No — and more usefully, the one that just happened is over. The week Houston has just come through was the heat event. The week ahead is ordinary late-August weather.
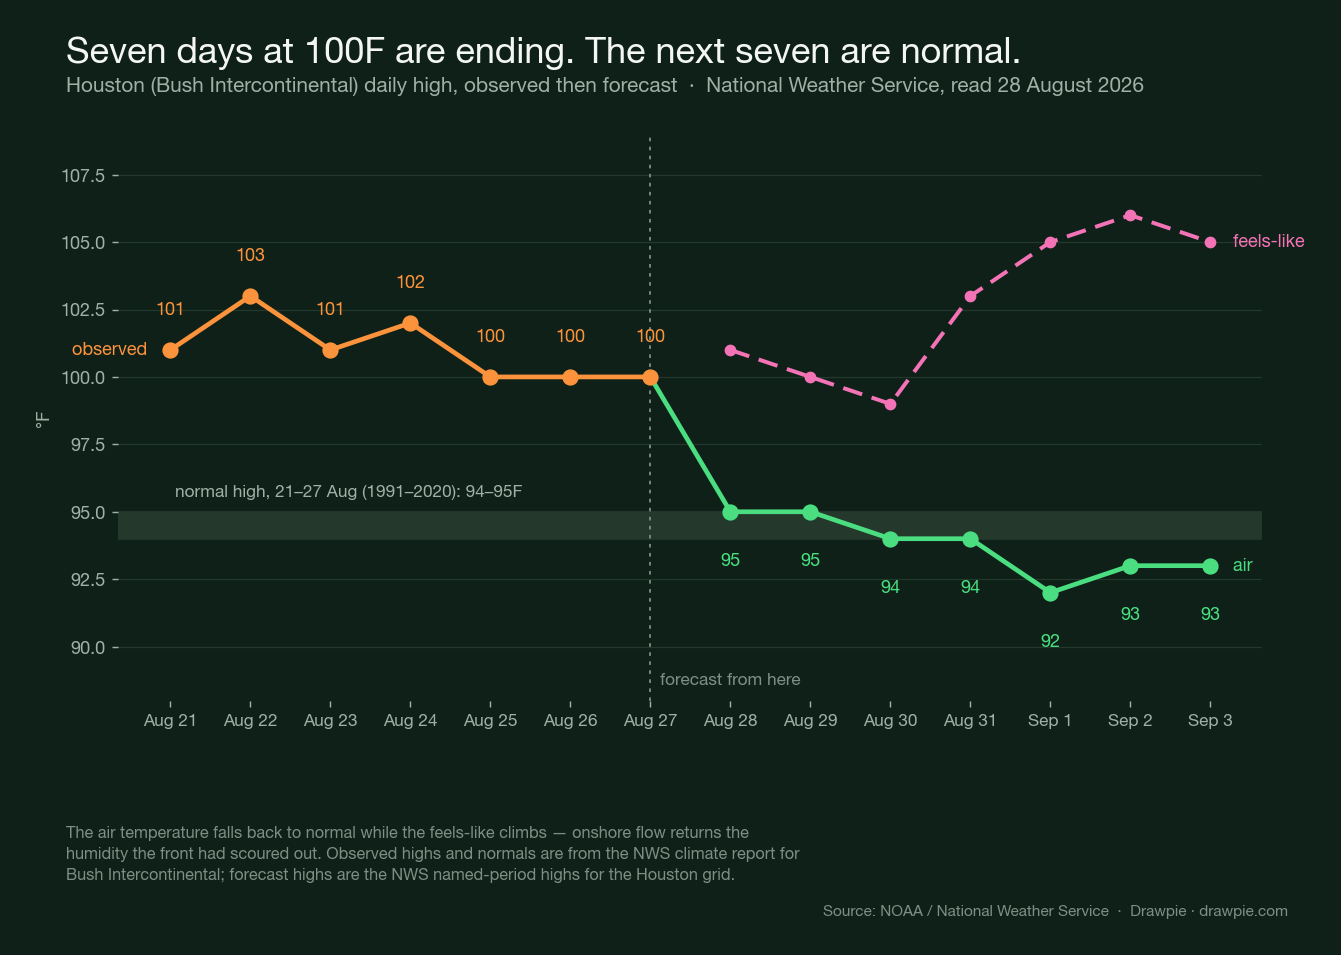
The climate report for Bush Intercontinental makes the contrast plain. These are the observed highs against the 1991–2020 normal for each date:
| Date | High | Normal | Departure |
|---|---|---|---|
| 21 Aug | 101F | 95F | +6 |
| 22 Aug | 103F | 95F | +8 |
| 23 Aug | 101F | 94F | +7 |
| 24 Aug | 102F | 94F | +8 |
| 25 Aug | 100F | 94F | +6 |
| 26 Aug | 100F | 94F | +6 |
| 27 Aug | 100F | 94F | +6 |
Seven days, seven departures of +6 or more, and not one of them a record — the record for 27 August is 109F, set in 2011. It was persistently, unusually hot without ever being historically hot, which is the shape most Gulf Coast heat takes.
It was hot overnight too, and that is the part that does the damage. On 27 August the low was 82F against a normal of 75F, and the day’s average of 91F ran seven degrees above normal. A night that does not drop below 82F gives a house without air conditioning no chance to shed the day’s heat.
Why does it feel hotter as the temperature falls?
Because the humidity comes back. The air temperature drops about three degrees over the week while the heat index climbs five, and those two facts have the same cause.
A frontal boundary has been sitting almost stationary along the I-10 corridor. It clears offshore this morning, and behind it the wind turns north-to-easterly and drags in a slightly drier air mass — which is why today and tomorrow feel less oppressive than the raw temperature suggests, at 101F and 100F against highs of 95F.
Then the flow turns back onshore, the Gulf moisture returns, and the gap between the thermometer and your skin widens from six degrees on Saturday to fourteen degrees by Wednesday. By then a 93F afternoon feels like 106F.
Practically: the middle of next week is the part to plan around, not today. Wednesday is the coolest-looking day on the forecast and the most dangerous one to spend outside.
What do the rain chances actually mean?
Much less than they look like. A “35% chance of rain” is the probability that any one spot gets at least one hundredth of an inch — it says nothing about how much, how long, or how much of the city.
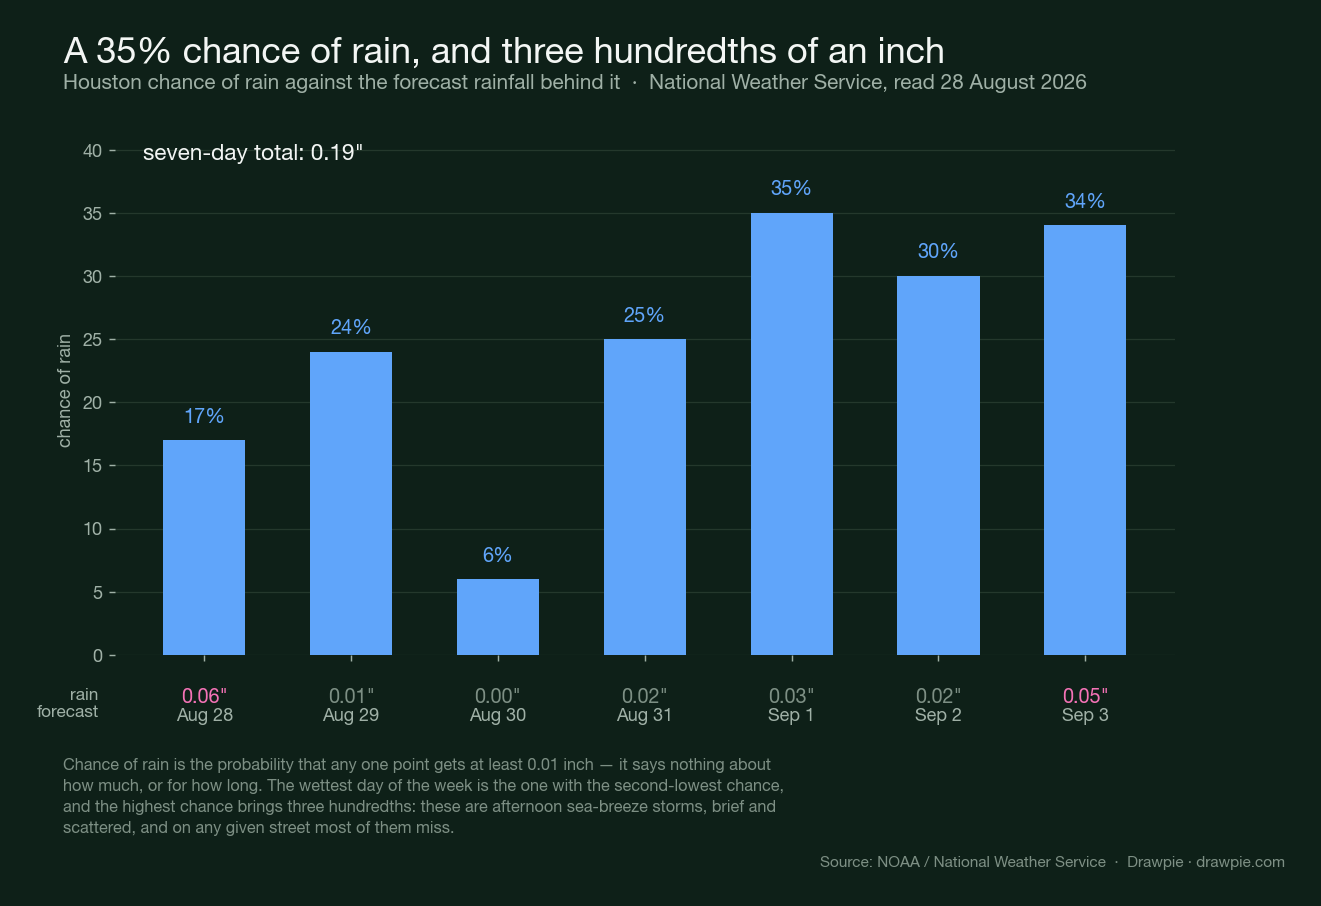
Put the two side by side and the week’s chances add up to 0.19 inches of forecast rain in total. The relationship between the two columns is not just weak, it is close to inverted:
- The wettest day of the week is Friday at 0.06" — and Friday has the second-lowest chance on the board, 17%.
- The highest chance of the week is Tuesday at 35% — and Tuesday brings 0.03".
- Sunday’s 6% is the only honest-looking number, because it corresponds to 0.00".
This is not the forecast being wrong. It is what a sea-breeze summer looks like: convection fires along the boundary in the afternoon, dumps hard on a few square miles for twenty minutes, and misses everywhere else. A high percentage means somebody gets wet. It has never meant you will.
If you are watering a lawn or planning around drought, read the inches column and ignore the percentages. If you are deciding whether to carry an umbrella to an outdoor evening, read the percentages.
Are there any weather warnings in Houston right now?
No heat products of any kind, anywhere in Texas. Not a Heat Advisory, not an Excessive Heat Warning, not a watch — despite a week of 100F days and a forecast heat index touching 106F.
The whole state has two active alerts as of this morning:
| Alert | Where | Status |
|---|---|---|
| Flood Advisory | Houston/Galveston area | Minor severity, expires 7:00 a.m. CDT today |
| Air Quality Alert | Texas | In force |
The flood advisory was issued at 5:39 a.m. and runs for barely an hour — it is the tail of the overnight storms along the departing boundary, not a signal about the week.
Two active alerts for a state of thirty million people in late August is a quiet board. It is worth stating plainly because the absence of a heat advisory during a 100F streak surprises people: the advisory thresholds on the Gulf Coast are set against what the local population is acclimatised to, and a Houston August that runs six degrees above normal still does not clear them.
What is driving the pattern?
A ridge and a sea breeze, in that order. The NWS Houston/Galveston forecasters describe a mid-to-upper-level ridge centred over West Texas that expands eastward through early next week, with disturbances arriving from the Gulf underneath it.
That combination is what produces the shape of this forecast:
- The ridge caps the heat near normal rather than driving it higher. The forecasters’ own summary for today is that it will be hot “but at least not in the triple digits”.
- The disturbances plus the afternoon sea breeze keep a daily storm chance alive without ever organising into a soaking. Hence 30-something percent chances attached to hundredths of an inch.
- The severe threat is low. What is possible with the stronger storms is gusty winds, brief heavy downpours and frequent lightning — the ordinary hazards, not the organised ones.
The atmosphere is very wet: precipitable water over the region has been running 2.0 to 2.3 inches, which is near the top of the range for the date and is why the storms that do fire can drop a lot of water very quickly on a small area.
When does the weather actually change?
Not within this forecast. Every one of the next seven days is a variation on hot, humid, and briefly stormy in the afternoon — the NWS key message is explicitly that “hot and humid conditions with low chances for showers/storms will continue into next week”.
The two things worth watching past this window:
- Whether the heat index keeps climbing past Wednesday. It has risen every day from Sunday onward in this run. If onshore flow persists and the ridge holds, that is the variable that reaches an advisory threshold first — not the air temperature.
- The Gulf. Late August into September is the climatological peak of the Atlantic season, and the disturbances feeding this pattern are coming off the same water. Nothing in this forecast implies a tropical system, and none is indicated; it is simply the season in which the sea-breeze pattern and a tropical wave can stop being separate things.
For anything beyond seven days, the honest answer is that a daily forecast does not know. Seasonal guidance is a different product with different skill, and we keep the US-wide version of it on a separate page .
Sources
| Source | Used for |
|---|---|
| NWS Daily Climate Report — Houston Intercontinental (CLI/IAH) | Observed highs and lows for 21–27 August, the 1991–2020 normals, departures and the records for each date |
| NWS text forecast, Houston grid HGX 63,95 | The seven-day highs, overnight lows, chance of rain and the short forecast wording |
| NWS gridded forecast, HGX 63,95 | Apparent temperature (heat index) and quantitative precipitation, both bucketed to local days |
| NWS Area Forecast Discussion, Houston/Galveston | The frontal boundary position, precipitable water values, the West Texas ridge, the sea-breeze mechanism, the severe-weather assessment and the key messages |
| NWS active alerts | The flood advisory, the air quality alert, and the absence of any heat product statewide |
How we verified this
Every figure on this page comes from the National Weather Service, read on the morning of 28 August 2026. No commercial forecast provider is used anywhere, in the text or the charts. That is a licensing rule as much as a sourcing one: NWS output is a work of the US federal government and carries no copyright, so it can be redistributed and drawn from. The specific products are the Daily Climate Report for Bush Intercontinental (CLI/IAH), the text forecast and gridded forecast for grid HGX 63,95, the active-alerts feed, and the Area Forecast Discussion issued by the Houston/Galveston office at 12:08 a.m. CDT.
🔴 A control test caught a real trap on the products endpoint, and the fix changed how these sources were checked. api.weather.gov/products/types/AFD/locations/ZZZ — an office code that does not exist — returns HTTP 200, exactly like the real Houston office. A status code therefore proves nothing here, and any claim resting on “the endpoint answered” would have been worthless. The discriminator used instead is the response body: the real office returns 31 recent issuances, the invented one returns an empty list. The coordinate lookup was checked the same way and does behave properly, returning 404 for a point outside any US grid.
⚠️ The forecast highs are the NWS text forecast, not the raw gridded series, because the two disagree. Bucketing the gridded temperature feed by local day gives values up to 2F below the named-period highs NWS publishes on its own site. Both are NWS products; the text forecast is the one a reader sees if they check, so it is the one used in the table and the chart. An earlier pass bucketed by UTC date, which in a UTC-5 zone straddles two afternoons and picks whichever was hotter — that was wrong by a further degree, and it was only caught by comparing the two products against each other rather than trusting one.
⚠️ The normal is drawn as a band, not a curve, because NWS publishes it only for days that have already happened. There is no published normal here for 28 August to 3 September. The 94-95F band is what the climate report actually printed for 21-27 August, carried across the chart as a reference and labelled as such rather than extrapolated forward and presented as data.
The observed highs are deduplicated. The climate report is issued more than once for the same date — a preliminary and later corrections — so several dates appear twice or three times with slightly different values. Only the most recent issuance for each date is used.
The heat index is the gridded apparent temperature, bucketed by America/Chicago local day. It is a forecast quantity, not an observation, and it is sensitive to humidity errors in a way the air temperature is not.
This forecast will move. The NWS reissues the seven-day several times daily and publishes an updated discussion twice a day. Everything here is a snapshot of one morning’s guidance, and the further out the day, the less it is worth.