Gold Price September 2026: Chart, Key Drivers and Investor Outlook
Update log (2)
- — Re-marked to the 1 September close of $4,348. The page was written to the 31 August close of $4,431; gold fell again on 1 September, so the year-to-date gain narrows from 2.4% to 0.5% and the gap to January's record widens to 18.2%. Charts rebuilt. The argument is unchanged — if anything the extra session strengthens it.
- — 🔴 The price series was replaced, and this is a correction rather than a refresh. Every figure on this page came from Yahoo's GC=F front-month gold future, which was still tracking the September 2026 contract long after the market had left it — the bars quoted here traded 360, 191, 72, 16 and 145 lots on 31 August to 4 September against 150,000-210,000 a day in the liquid December contract, and the 4 September bar had its open, high, low and close all identical. The $4,348 headline came off a 191-lot bar. The defect was caught internally: the page asserted futures trade $40-60 ABOVE spot while its own 1 September figure sat $5.15 BELOW the LBMA benchmark. Everything is now the LBMA Gold Price PM and both charts are rebuilt on it. Two claims reversed as a result — August is the strongest month of 2026 at +13.3%, not the second-strongest behind February, and 28 August was an ordinary session with 79 worse in 2026, not the eleventh-worst. The argument about the Fed mechanism survives the change unaltered. Also updated: WTI has run from $85.76 at the end of August to about $93, and the yield and dollar figures now use the 28 August observations Yahoo has since backfilled.
Two published clocks, and the nearer one now sets the date. BLS releases August CPI on 11 September at 8:30 a.m. ET — this page’s own watch list names it, and it is the last hard inflation print before the meeting. The larger supersede is still the FOMC decision on 15–16 September, with a Summary of Economic Projections, because the rate path is the mechanism this page credits for gold’s whole year. Re-check on the 11th, rewrite on the 16th.
Everything else on the page is unaffected; the figures below still say when they were read.

- 🔴 The price series on this page was replaced on 9 September. It had been using a front-month futures symbol that was still tracking a nearly-untraded September contract — the figure this page led with came off a 191-lot bar. Everything is now the LBMA Gold Price PM benchmark.
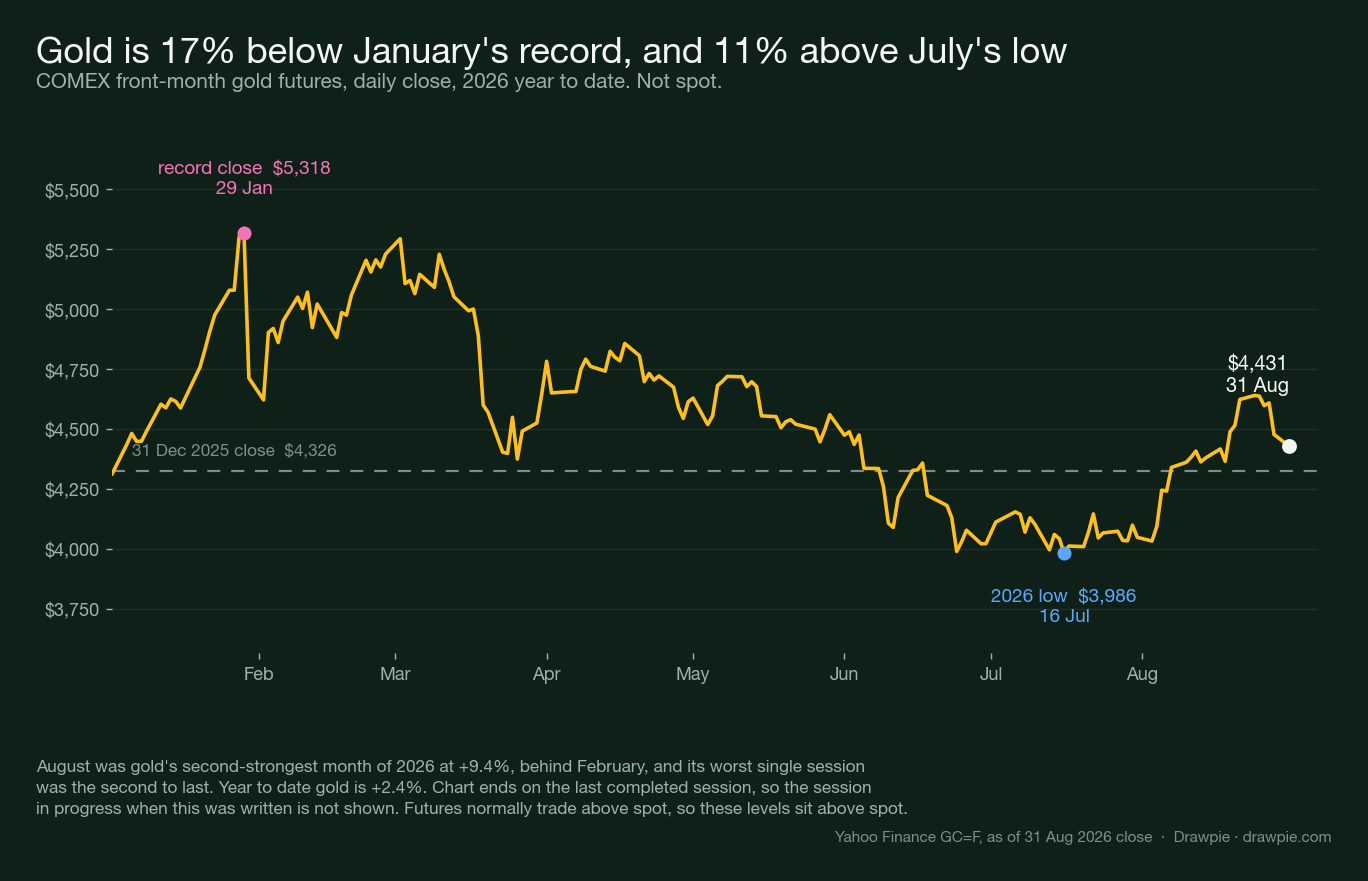
- Gold is $4,399.10 an ounce at the 8 September benchmark, up 0.7% on the year, 18.6% below January’s record of $5,405 and 10.2% above the 16 July low of $3,993.55.
- The week around Jackson Hole took 4.72% off the price, from $4,568.95 on 27 August to $4,353.15 on 1 September. There was no benchmark on 31 August — London was shut — so that one print carries three days.
- On this benchmark 28 August itself moved only −0.14%, and 79 sessions in 2026 were worse. The LBMA sets at 10am New York time, so an afternoon speech lands in the next day’s price.
- August was gold’s strongest month of 2026 at +13.3%. On the old futures series it looked like the second-strongest behind February — one of several figures the series change corrected.
- The August version of this page said the year’s explanation — commodity inflation pushes the Fed hawkish, which pushes gold down — had stopped working. Its data ended on 27 August, the day before the market reacted. The mechanism did not break; the page ran out of data one session early.
- Across the same window the ten-year Treasury yield rose from 4.672% to 4.796% and the dollar index from 99.16 to 99.67. Yields up, gold down, is the relationship that explained the first seven months of the year.
- Central bank buying is real but less one-sided than the headline suggests: Turkey sold 83 tonnes in the first half of 2026, almost exactly cancelling Poland’s 82 tonnes of purchases.
Gold is $4,399.10 an ounce, up 0.7% on the year — after losing 4.72% across the week around Jackson Hole and drifting since. That is the story of the month compressed into one sentence, and it resolves a question the August version of this page left open.
One thing to know before the numbers. On 9 September we replaced the price series this page had used all along. The old one was tracking a futures contract almost nobody was trading, and it was producing figures that contradicted the page’s own stated rules. What follows is the LBMA benchmark instead, and the section below explains exactly what changed.
This article is for information and education only. It is not investment advice, and not a recommendation to buy, sell, or hold any security or commodity.
What is the gold price right now?
$4,399.10 an ounce at the LBMA Gold Price PM benchmark on Tuesday 8 September 2026, the most recent published set.
| Measure | Level | When |
|---|---|---|
| Latest benchmark | $4,399.10 | 8 Sep 2026 |
| 2026 record | $5,405.00 | 29 Jan 2026 |
| 2026 low | $3,993.55 | 16 Jul 2026 |
| Last 2025 benchmark | $4,367.80 | 30 Dec 2025 |
From those: gold is 18.6% below its record, 10.2% above its July low, and 0.7% up on the year.
🔴 The price series on this page changed on 9 September, and the old one was wrong. Every figure here previously came from Yahoo’s GC=F front-month gold future. That symbol was still tracking the September 2026 contract long after the market had left it: the bars this page was quoting traded 360, 191, 72, 16 and 145 lots on 31 August to 4 September, while the liquid December contract traded 150,000 to 210,000 lots a day over the same stretch. The $4,348 figure this page led with came off a 191-lot bar.
The giveaway was internal. The page stated that futures trade $40 to $60 above spot — and its own 1 September number was $5.15 below the LBMA benchmark for that day. A stated relationship the printed numbers violate is a defect, not a nuance.
Everything is now the LBMA Gold Price PM, the auction benchmark the industry settles against, read from the LBMA’s own public feed. The shape of 2026 is unchanged; several precise figures moved, and August’s ranking reversed. Details in the update note.
The LBMA benchmark is spot, and it is an auction, not a continuous price. It sets twice each London business day, so there is no observation on days London is shut — including 31 August 2026, a UK bank holiday. That matters more than it sounds, and it is why the next section is framed as a week rather than a session.
What happened at the end of August?
The market read the new Fed chairman as hawkish, and gold gave back most of a month’s rebound across the week.
| Benchmark set | Level | Change |
|---|---|---|
| Thursday 27 August | $4,568.95 | — |
| Friday 28 August | $4,562.75 | −0.14% |
| Monday 31 August | no auction | UK bank holiday |
| Tuesday 1 September | $4,353.15 | −4.59% |
Chairman Kevin Warsh delivered his Jackson Hole address on 28 August. From 27 August to the next benchmark on 1 September, gold fell 4.72%.
Where that fall lands is a fact about the benchmark, not about the market. The LBMA PM price is set at 15:00 London — 10:00 in New York — so a reaction to an afternoon speech cannot appear in the same day’s number. And because London was shut on 31 August, the 1 September set carries three days of movement: the afternoon of the 28th, all of the 31st, and the morning of the 1st.
So on this measure the 28th itself was an ordinary day: 79 sessions in 2026 moved more. Anyone telling you gold fell three per cent “when Warsh spoke” is reading a continuously-traded futures series, which prices the speech in real time. Both are true; they are answering different questions.
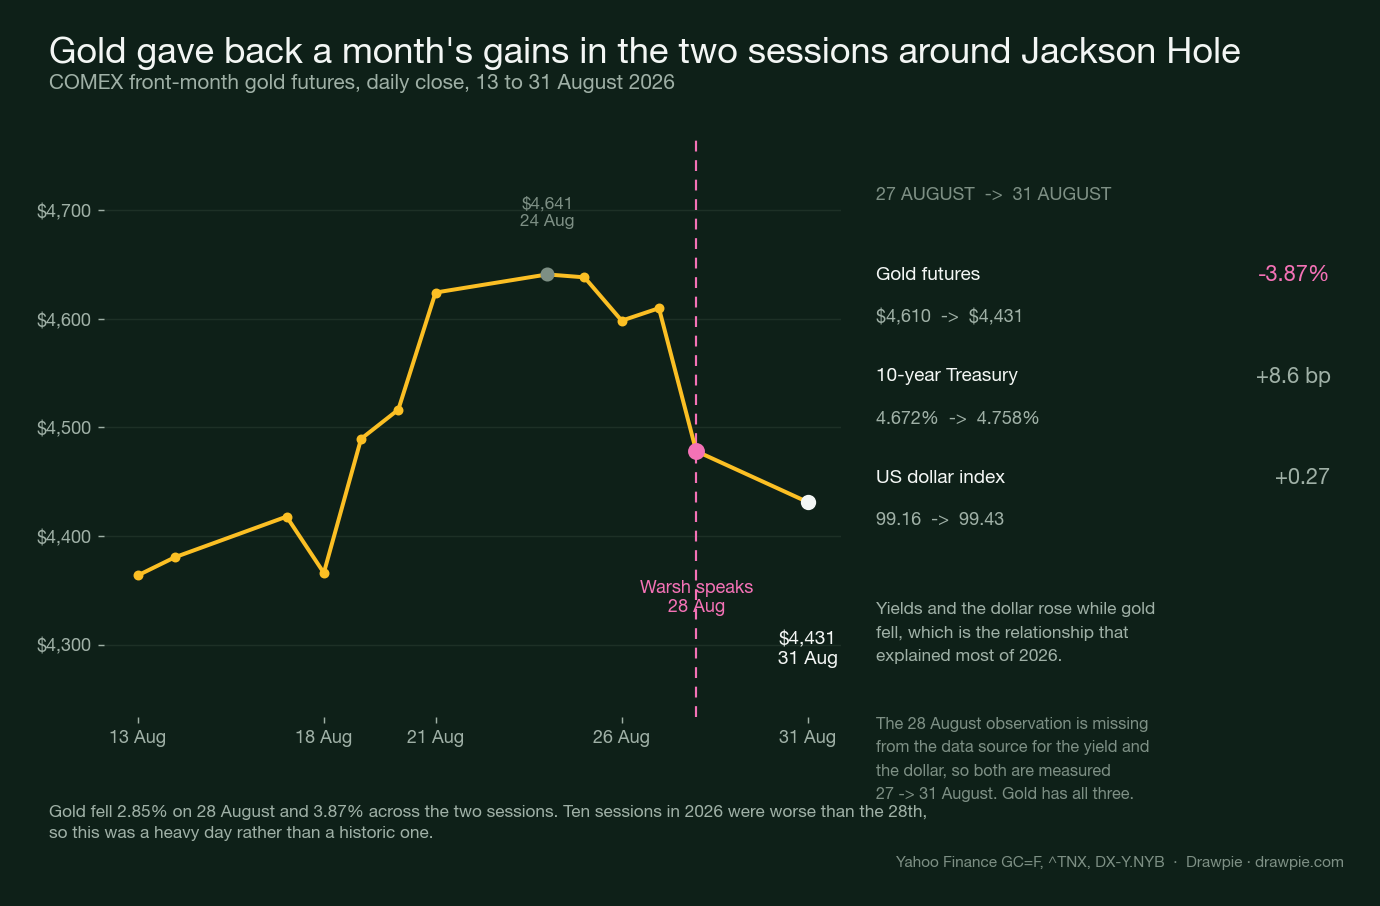
The other markets moved the way the mechanism predicts. Over the same window the ten-year Treasury yield went from 4.672% to 4.796% and the dollar index from 99.16 to 99.67. Yields up, dollar up, gold down.
Why does this matter more than a normal week?
Because the August version of this page said the explanation it had used all year had stopped working — and it turned out the page had simply run out of data one session too early.
This is worth setting out plainly, because it is a correction.
The explanation this site has carried through 2026 is a chain: rising oil and commodity prices push inflation expectations up, which pushes the Fed towards tightening rather than cutting, which raises the yield you give up by holding a metal that pays no income, which pushes gold down. That chain accounted for the slide from January’s record to July’s low.
In late August, oil rose and gold rose with it. The August page said so honestly, concluded the chain no longer fitted, and declined to substitute a new story. It also quoted Warsh’s line that “the recent rise in overall commodity prices also bears watching” and observed that on its own mechanism this was not a gold-positive signal — and gold rose anyway.
The data on that page ended with the 27 August set. Warsh spoke on the 28th. By the next published benchmark, gold had fallen 4.72%, yields had risen and the dollar had risen — exactly what the mechanism predicts.
So the honest revision is: the chain did not break in late August. The page observed a divergence that lasted about two weeks and reported it as a possible breakdown, one set before the divergence closed. That is a reasonable thing to have done with the data available, and it was still wrong.
That conclusion survives the change of price series. It was first written from a futures series this page no longer uses, and it would have been fair to ask whether it was an artefact of bad data. It is not: the fall, the yield move and the dollar move are all there on the LBMA benchmark too. What changed is the size and the timing, not the direction.
What did the Fed chair actually say?
He refused to give any guidance on rates, put inflation first, and named commodity prices as something he is watching for upside risk.
Warsh spoke at the Kansas City Fed’s symposium on 28 August 2026, in a speech titled “In Our Time.” Three things in it bear on the gold price, and all three are quotations from the Fed’s own published text.
No guidance, deliberately. His formulation was that he is “committed to a discipline, not to a decision.” The speech argues that forward guidance is counterproductive in normal times.
Inflation first. “Inflation is running above our 2 percent target. So the Fed’s predominant focus right now should be on prices.”
Commodities named. “The recent rise in overall commodity prices also bears watching. What we need to judge is whether trends indicate upside inflation risks.”
Read together, that is a chairman declining to promise cuts while pointing at the inflation channel that has driven the Fed hawkish all year. Reporting on the day described the speech as more hawkish than expected. This page does not claim the speech caused the fall — what is established is the sequence, and that yields and the dollar moved in the direction the mechanism requires.
One thing the speech does settle is a methodological point. A chairman who says he is committed to a discipline rather than a decision, and who argues against forward guidance, is telling markets not to read a path out of his words. That is the reason this page quotes observable yields rather than market-implied probabilities.
Is oil still driving this?
Less cleanly than it did in the spring, and the late-August divergence is the reason to say so.
West Texas Intermediate closed August at $85.76, up 49.4% on the year — the single largest move in any of the inputs on this page. Oil rose through the second half of August while gold rose too, which is the divergence the August page flagged.
And oil has kept going. WTI is around $93 as of 8 September, roughly 8% higher than the end of August and up about 62% on the year; Brent is near $98. Contemporaneous reporting attributes the September leg to attacks that halted operations at Saudi energy facilities. ⚠️ We are flagging rather than leaning on the very latest print: the front-month oil contract is going through its own roll, and the 8 September bar carries no volume in our data, so treat the exact figure as approximate and the direction as solid.
That matters for the chain this page describes. Rising oil is the input at the front of it, and it is still rising.
That divergence has now closed from the gold side rather than the oil side. Oil did not fall back; gold came down to meet the story. Watching oil is still worth doing, because it is the input that feeds the inflation expectations the Fed responds to. But the last month is a reminder that the chain runs through the Fed, and the Fed is the part that moves gold.
Are central banks still buying gold?
In aggregate yes — but the headline hides two very large moves in opposite directions.
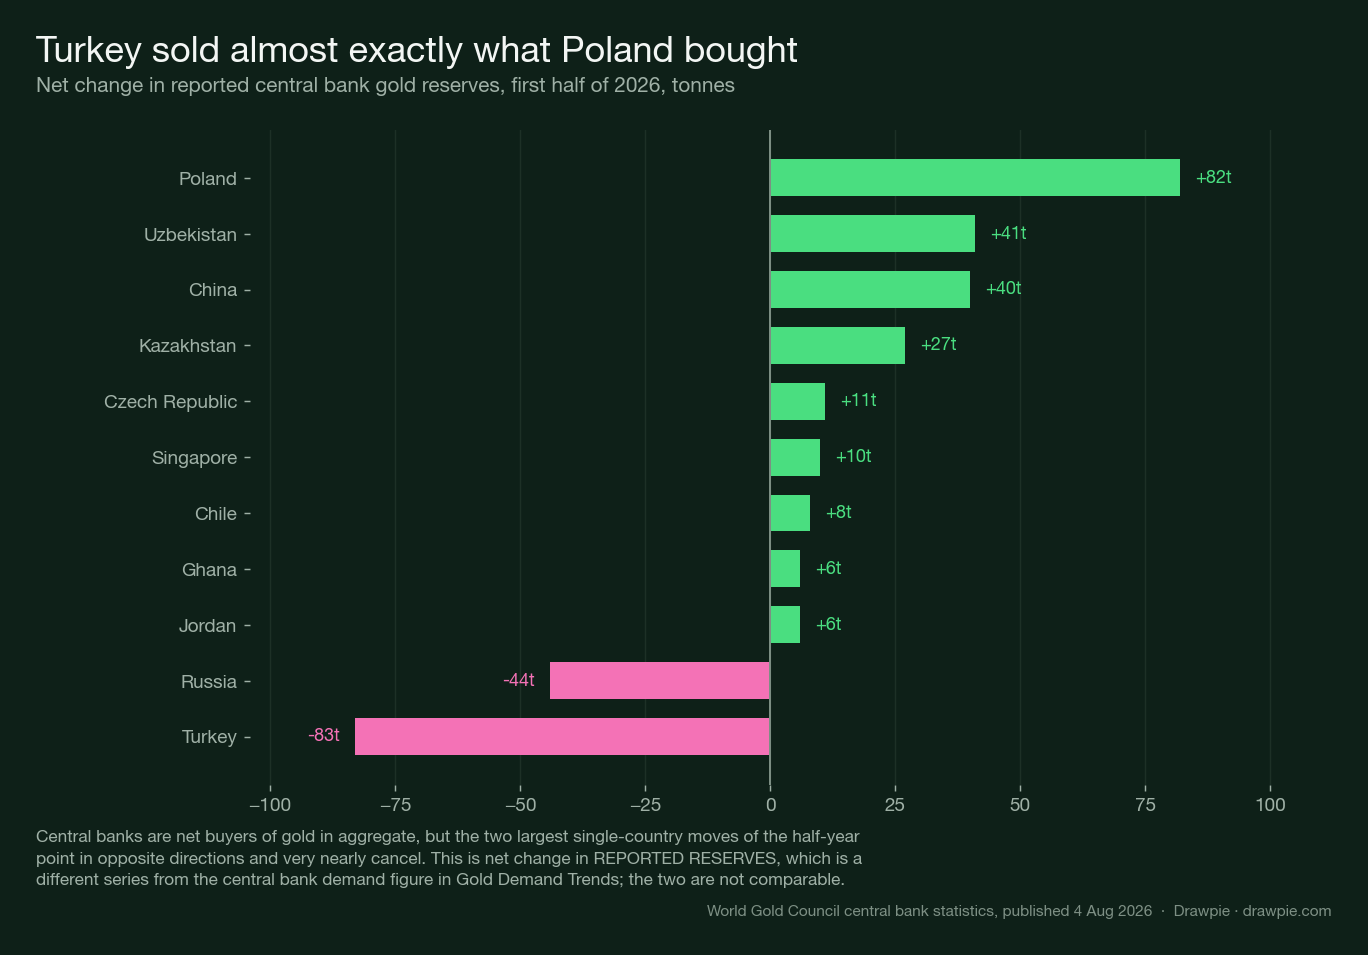
The World Gold Council’s central bank statistics, published 4 August 2026, give net changes in reported reserves for the first half of the year. Poland was the largest buyer at 82 tonnes. Turkey was the largest seller at 83 tonnes.
Those two very nearly cancel, and the second one is almost never mentioned. “Central banks are buying gold” is true as an aggregate statement, and it is also true that the biggest single-country move of the half-year was a sale.
The other named buyers were Uzbekistan (41t), China (40t), Kazakhstan (27t), the Czech Republic (11t), Singapore (10t), Chile (8t), and Ghana and Jordan (6t each). Russia sold 44 tonnes. WGC notes that other, smaller buyers are spread across emerging markets without naming them, so this is not a complete market net.
One caution on reading these numbers against other coverage: this is net change in reported reserves, which is a different series from the central bank demand figure in Gold Demand Trends. That series put central bank demand at 533 tonnes for the first half. The two are measured differently and cannot be added together or set against each other.
What should you watch from here?
The 15–16 September FOMC, and whether the relationship that reasserted itself in late August holds.
This article does not forecast the gold price and carries no one else’s price target.
| What to watch | Why it mattered |
|---|---|
| The 15–16 September FOMC | The Fed’s own calendar; it carries economic projections |
| Payrolls, CPI, PCE | Each release moved Treasury yields in 2026 |
| Oil | Energy feeds the inflation expectations the Fed responds to |
| WGC monthly data | Central bank flows run underneath the price |
Two structural notes carry over. Central bank demand is not price-sensitive the way investor demand is — it is reserve policy, and it continued through a drawdown that reached 25% at the July low. And a single monthly data print is a volatile series subject to revision.
Why did gold fall when inflation data came in high?
Because gold responds to interest rates rather than to inflation directly, and hot inflation data makes a hawkish Fed more likely.
The July PCE figures published on 26 August came in at 3.7% against a 3.6% expectation, with core steady at 3.3%. Gold fell that session. This is the single most common misreading of the metal: it is treated as an inflation hedge, but the thing it actually trades against is the real yield available on a Treasury. Inflation that pushes the Fed towards tightening raises that yield, and that is bad for gold.
Is gold up or down in 2026?
Up, but only just, and it spent most of the year down.
Gold’s last 2025 benchmark was $4,367.80 on 30 December, and it is $4,399.10 now — a gain of 0.7%. Between those two points it rose 24% to a record in January, fell 26% to a low in July, and rebounded. For most of the year the price sat below where it started.
(There is no 31 December 2025 benchmark. The LBMA does not auction on days the London market is shut, so the year base is the last set of 2025.)
What is the difference between the gold price quoted here and the one I see elsewhere?
This page uses the LBMA Gold Price PM benchmark, which is spot — the price the industry settles contracts against, set by auction at 15:00 London each business day.
Most of the other numbers you will see are one of two things. A live spot quote (XAU/USD) moves continuously, so it will differ from a fixed benchmark set hours earlier. A COMEX futures price normally trades above spot, typically by $40 to $60 at current levels, because it carries financing and storage to delivery.
None is more correct, but they are not interchangeable — and this page learned that the hard way. Until 9 September it quoted futures, using a symbol that had drifted onto an almost untraded contract, and the resulting numbers fell below spot rather than above it. If a figure you are comparing is not labelled, that is the first thing to check.
The bottom line
Gold at $4,399 is 18.6% below its January record and 0.7% up on the year, after a rebound that ran from mid-July to late August and then gave back a large part of itself in the Jackson Hole week.
The explanation that accounted for January to July — oil into inflation expectations, inflation expectations into the Fed, the Fed into gold — looked as though it had broken in the second half of August. It had not. The Fed chairman spoke, the market repriced, yields rose and gold fell. The August version of this page called the breakdown one set before it closed, and that is corrected here.
And a second correction, larger than the first. The price series this page used all year was reading a futures contract that had stopped trading in any meaningful volume, and it produced numbers that broke the page’s own stated rule about futures sitting above spot. That is now fixed, the figures have moved, and two published claims — August’s ranking and the severity of the 28 August session — reversed outright. The argument survived the change; several of the numbers did not.
Central banks kept buying in aggregate, with the large qualification that the biggest single mover of the half-year was Turkey selling. There is no forecast here of where the price goes next, and no third-party price target quoted.
Important information
This article is for informational and educational purposes only. It is not investment, financial, legal, or tax advice, and is not a recommendation, offer, or solicitation to buy, sell, or hold any security or commodity. Nothing here is tailored to your individual circumstances.
The charts show historical prices and historical reported reserve changes. They are illustrations of what has already happened and do not predict future prices. Past performance does not guarantee future results.
This article contains no price forecast, quotes no third-party price target, and carries no market-implied probability, for gold or for anything else.
Prices are as of the dates stated and change continuously; this content may be out of date by the time you read it. All investing involves risk, including the possible loss of principal.
The author is not a licensed financial adviser or broker-dealer. Do your own research and consult a qualified, licensed financial professional before making any investment decision. Drawpie and the author accept no liability for any loss arising from the use of this content. Price data via Yahoo Finance; central bank data via the World Gold Council.