Gold Price August 2026: Chart, Key Drivers and Investor Outlook
Update log (3)
- — Audited 2026-09-02. The frozen body and banner are correct editorial practice and were left alone. What was fixed: the meta description and the takeaways block sit outside the superseded banner and still asserted, in present tense, that gold is up 6.6% on the year (it is up 0.5% at the 1 September close of $4,348) and that the year's explanation had broken (retracted on 1 September). The lead sentence's undated 'last completed session' was anchored to 27 August 2026. The perishes note was rewritten to say the archive is not the page to update. All historical anchors re-verified against source and unchanged: end-2025 close $4,325.60, record close $5,318.40 on 29 January, low close $3,985.60 on 16 July, 6 August $4,242, 7 August $4,340.70, 25 August $4,638.10, 27 August $4,609.70, and the 3.7% jump on 5 August. The July FOMC 9–3 hold at 3.50–3.75% with three dissenters wanting to raise, Warsh's three Jackson Hole quotations, his chairmanship with Powell still a governor, the 15–16 September FOMC with projections, and every WGC Q2 2026 figure (289t central banks +62%, −45t ETFs, 1,269t total, 327t OTC) all check out, and Q2 remains the most recently published WGC quarter.
- — Superseded by the September 2026 page, and left standing as written. This version concluded that the year's explanation — commodity inflation pushes the Fed hawkish, which pushes gold down — had stopped working. Its data ran to the 27 August close, one session before the market priced Warsh's Jackson Hole address. Gold then fell 3.87% over 28 and 31 August while the ten-year yield rose from 4.672% to 4.758% and the dollar index from 99.16 to 99.43. The explanation had not broken; this page ran out of data a session early. The correction is on the September page.
- — Refreshed to the 27 August close and rebuilt the chart. The substantive addition is Chairman Warsh's Jackson Hole address of 28 August, which the previous version had flagged as the missing input: he gave no rate guidance at all, put inflation first, and named rising commodity prices as something to watch for upside inflation risk — which, on this page's own mechanism, should not have helped gold. Separately, the implied-probability figures for a September rate move have been removed throughout and replaced with the Treasury yields they were derived from; this site does not publish market-implied odds in any category.
This page is archived. It was superseded on 1 September 2026 by the September edition and is kept frozen because its conclusion was wrong in an instructive way. Nothing here should be updated against new data; the 15–16 September FOMC supersedes the successor, not this page. The only live dependency is the ’newer version’ pointer at the top, which should be checked at the next monthly rollover so it still points at the current gold page.
Everything else on the page is unaffected; the figures below still say when they were read.

- Gold closed at $4,610 an ounce on 27 August 2026, the last completed session before this update — 13.3% below January’s record close of $5,318, and 15.7% above the 16 July low of $3,986. It was up 6.6% on the year at that close. Gold has since fallen to $4,348 at the 1 September close — up 0.5% on 2026, and 18.2% below the January record. Front-month COMEX futures throughout.
- Fed Chairman Kevin Warsh spoke at Jackson Hole on 28 August and gave no steer on rates at all. His line was that he is ‘committed to a discipline, not to a decision’, and the speech argues against forward guidance as a practice.
- He did name commodities: ‘The recent rise in overall commodity prices also bears watching. What we need to judge is whether trends indicate upside inflation risks.’ On this page’s own explanation of 2026, that is not a gold-positive signal. This page recorded gold rising anyway — but its data stopped one session short: gold fell 3.87% over 28 and 31 August, and to $4,348 by 1 September.
- As written on 29 August, this page judged that its early-August explanation no longer fitted. That judgement was wrong — see the note above and the September page. It said cheaper oil was easing the pressure on the Fed. Since then WTI has gone the other way — $79.77 on 7 August to $89.75 on 20 August, easing to $83.90 — and gold rose through both legs.
- Central banks bought 289 tonnes in the second quarter, up 62% on a year earlier, while the price was falling. Retail ETF holders went the other way, taking 45 tonnes out. That is still the most recent World Gold Council quarter.
There is a newer version of this page: Gold Price September 2026 . This one is kept as it was written, because it got something wrong that is worth being able to see. It concluded that the explanation this site had used all year had stopped working. Its data ended on the 27 August close — the day before Chairman Warsh spoke at Jackson Hole. When the market priced the speech, gold fell 3.87% over two sessions while yields and the dollar rose, which is exactly what that explanation predicts. The September page sets out the correction.
Gold closed at $4,610 an ounce on 27 August 2026 — the last completed session when this page was last updated — with the metal back above where it started the year for the first time since January. This article is for information and education only. It is not investment advice, and not a recommendation to buy, sell, or hold any security.
Updated after Jackson Hole. This page first ran on 7 August, when gold was $4,242 and down on the year. It has since gained 8.7%. The explanation it originally gave for the rebound — cheaper oil easing the pressure on the Fed — stopped fitting almost immediately, and the previous update said the missing input was the Fed chairman, who had not yet spoken. He has now. Warsh’s 28 August address is covered below. It does not rescue the explanation. The original analysis is left in place so you can see what broke.
What is the gold price right now?
$4,610 an ounce at the close on Thursday 27 August 2026, the last completed session before this update.
| Measure | Level | When |
|---|---|---|
| Last close | $4,610 | 27 Aug 2026 |
| 2026 record close | $5,318 | 29 Jan 2026 |
| 2026 low close | $3,986 | 16 Jul 2026 |
| End-2025 close | $4,326 | 31 Dec 2025 |
| Close when this first ran | $4,242 | 6 Aug 2026 |
Every figure this article works out for itself uses front-month COMEX gold futures. That matters when you compare against other coverage: futures normally trade above spot, so a spot quote for the same moment will read lower by roughly $40 to $60. Where a spot price is quoted below, it is labelled as spot.
From those numbers: gold is 13.3% below its record close, 15.7% above its July low, and 6.6% up on the year. The 28 August session had not settled in the data used here when this update was written and is not treated as a closing price anywhere on this page.
What has gold done in 2026?
It went up 23% in four weeks, gave all of it back over five months, and has spent the past three weeks climbing again.
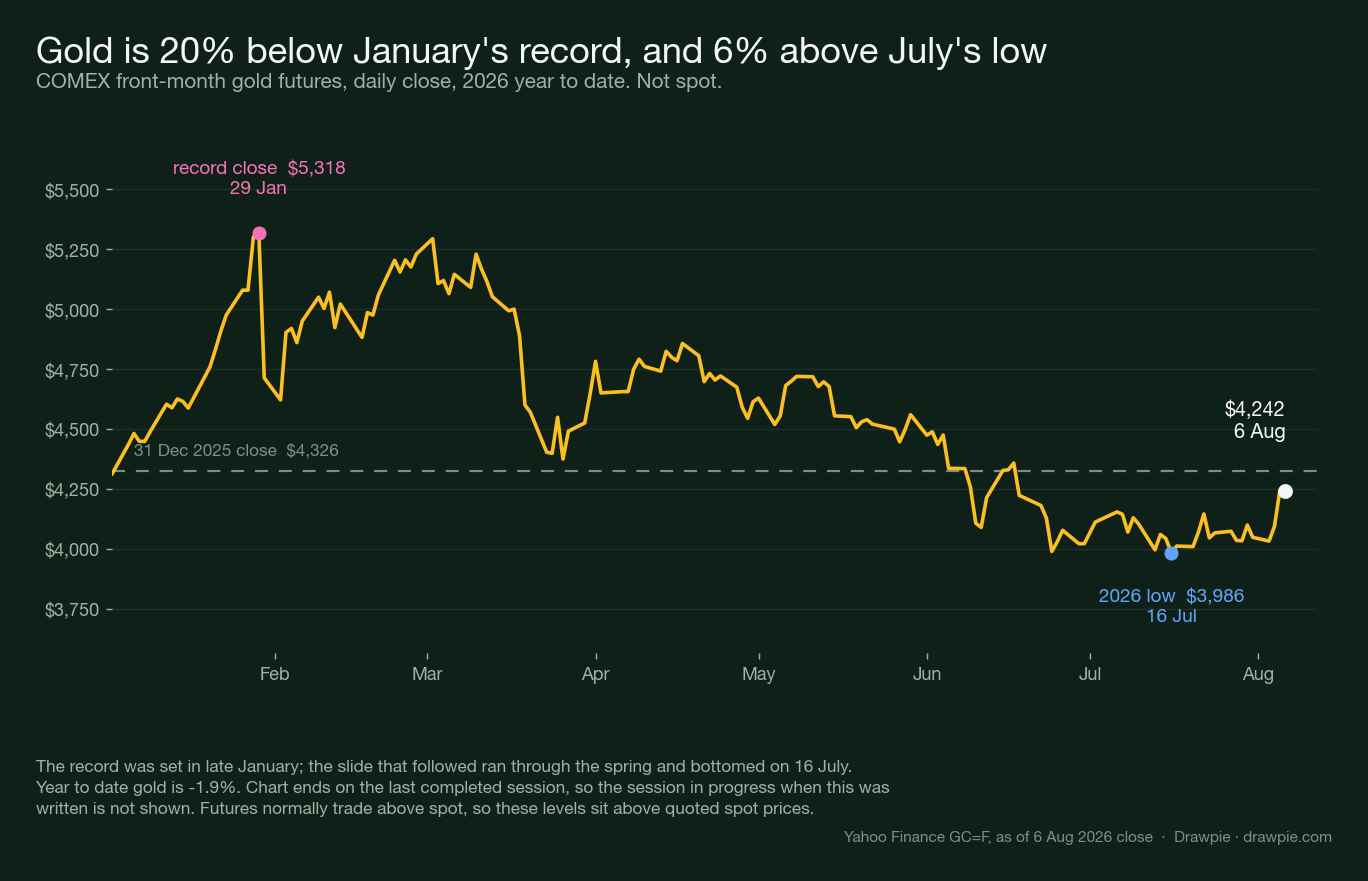
Chart: front-month COMEX gold futures, daily closes, as of the 27 August 2026 close. Historical prices only; it does not predict future prices.
The shape is worth walking through, because the two halves have different causes.
Gold entered 2026 already running and accelerated hard in January, closing at $5,318 on 29 January. Spot gold’s intraday record, the number most reporting cites, was $5,589.38 on 28 January. The next session it fell 11.4% — the largest single-day drop of the year by a wide margin — and although it recovered to within a whisker of the high by early March, it never took it out.
What followed was not a crash but a five-month grind: lower highs from March through July, ending at $3,986 on 16 July. Then three weeks of recovery, with a 3.7% single-day jump on 5 August.
The dashed line on the chart is the point that gets missed in both directions. For most of 2026, through all the record-high headlines in January and all the correction headlines since, gold sat below where it began the year. It crossed back above that line in the third week of August and is now 6.6% up on 2026 — which is a different sentence from the one this page carried three weeks ago, and the reason it needed updating.
Why did gold fall from its record?
Because the oil price went up. Rising energy costs pushed inflation expectations higher, which pushed the Fed towards raising rates rather than cutting them — and higher rates are what gold actually reacts to.
This is the part that confuses people, and it is worth being precise about. The escalation of the US–Iran conflict in late February raised oil prices sharply. Higher oil fed straight into inflation expectations. Markets responded by pricing out the rate cuts they had assumed for 2026 and starting to price in the possibility of hikes.
For a metal that pays no income, that is the worst combination available. The cost of holding gold instead of a Treasury bill is the yield you give up, and that yield was rising. The inflation-hedge assumption that gold should have risen here is the single most common misreading of what the metal does.
By the July FOMC meeting , the Committee held its target range at 3.50–3.75% but did so on a 9–3 vote, with all three dissenters wanting to raise. That is the environment gold was falling into: not a Fed cutting slowly, but a Fed with an active hawkish bloc.
What is driving the August 2026 rebound?
The same mechanism running backwards, plus a bad jobs report.
Three things landed inside eight days:
| Date | Event | Effect |
|---|---|---|
| Early Aug | Hormuz reopening talks progress | Energy prices fall |
| 5 Aug | ADP shows July hiring slowing | Gold up 3.7% on the day |
| 7 Aug | July payrolls at −23,000 | Treasury yields fall |
The payrolls number is the big one. The Bureau of Labor Statistics reported that the US economy shed 23,000 jobs in July against expectations of roughly 80,000 added, with unemployment at 4.1%. The ten-year Treasury yield fell to about 4.60% from 4.67% before the release.
That yield move is the part that matters for gold, and the mechanism is simple arithmetic rather than sentiment. Gold pays no income, so the cost of holding it is the yield you give up by not holding a Treasury instead. When that yield falls, the cost of holding gold falls with it.
This page quotes yields, which are prices you can observe, and not market-implied probabilities of what the Fed will do. That is a standing rule here, and it happens to align with what the Fed’s own chairman argued at Jackson Hole three weeks later — see below.
The oil side is the quieter half of the story. West Texas Intermediate traded around $78 on 7 August against a 2026 high of $113 — and the Fed’s hawkish bloc has been explicit that energy-driven inflation is what would push it to raise. Cheaper oil takes pressure off the exact channel that broke gold in the spring.
One number for scale on how violent this year has been across precious metals: silver futures peaked above $115 in 2026 and traded near $63 on 7 August. Measured the same way, peak close to trough close, gold’s drawdown was 25% — $5,318 in January to $3,986 in July. That is the mild version: silver’s ran to 51% , a hole that needs a 106% rise to climb out of.
What has happened since this page first ran?
Gold kept going up, and the reason given above stopped explaining it.
The section you have just read argues that cheaper oil eased the inflation pressure on the Fed, and that this is what lifted gold in early August. Over the following three weeks oil did the opposite.
| 7 Aug | 20 Aug | 25 Aug | |
|---|---|---|---|
| WTI spot, $/bbl | 79.77 | 89.75 | 83.90 |
| Gold, COMEX close | 4,341 | 4,516 | 4,638 |
WTI rose 12.5% to 20 August and, even after easing, sits above where it was when this page was written. Reporting through the period described the Strait of Hormuz position deteriorating rather than improving — from talks on partial reopening in early August to shipments described as close to halted. On the mechanism set out above, that combination should have pushed gold down. Gold rose 8.7%.
So one of two things is true: either the early-August explanation was always weaker than it looked, or something else has taken over. This page is not going to pretend to know which, and there is a specific reason for the caution — see the next paragraph.
Two things did change that are worth putting on the record, both verifiable and neither a forecast:
- The Federal Reserve has a different chair. Kevin Warsh became Chairman on 22 May 2026, succeeding Jerome Powell, who remains on the Board as a governor. That is from the Fed’s own board membership page. Every rate expectation discussed above is now an expectation about a chair with a short public record in the job.
- Jackson Hole has now happened, and Warsh has spoken. The previous version of this page said the symposium was under way and that the chairman had not yet appeared. He delivered his address on 28 August. What he said is set out in the next section, and it does not resolve the puzzle — it sharpens it.
What did the Fed chair say at Jackson Hole?
He declined to say anything about the rate path, and named rising commodity prices as something to watch for upside inflation risk.
Chairman Kevin Warsh spoke on 28 August 2026 at “Financial Innovation: Implications for Payments and Policy,” the Kansas City Fed’s symposium in Jackson Hole. His speech was titled “In Our Time.” Every quotation below is from the Federal Reserve’s own published text of it.
Three things in it bear directly on this page.
He gave no guidance on rates, deliberately. His formulation was that he is “committed to a discipline, not to a decision.” The speech argues that forward guidance is counterproductive in normal times, and sets out six principles for how policy should be made instead. There is no sentence in it pointing towards a cut or a hike.
He put inflation first. “Inflation is running above our 2 percent target. So the Fed’s predominant focus right now should be on prices.” That is a hawkish framing of the Committee’s job, from a chairman with a short record in the role.
He named commodities specifically. “The recent rise in overall commodity prices also bears watching. What we need to judge is whether trends indicate upside inflation risks.”
That last line is the awkward one for the explanation this page has been carrying. The mechanism set out above is that rising energy and commodity prices push inflation expectations up, push the Fed towards tightening, and push gold down — that is how the January-to-July decline is explained. The Fed’s chairman has now said, in public, that he is watching exactly that channel for exactly that risk.
On the mechanism this page has used all year, that is not a gold-positive signal. Gold rose anyway. So the speech does not rescue the explanation; it removes the last easy way of rescuing it.
What the speech does confirm is a smaller, methodological point. A chairman who says he is committed to a discipline rather than a decision, and who argues against forward guidance, is telling markets not to read a path out of his words. That is one reason this page quotes observable yields rather than market-implied probabilities of what the Committee will do — the numbers are cleaner, and the Fed’s own chair has just made the case that the alternative is a poor guide.
One caveat on all of this. The speech was a day old when this was written, and gold’s move began before it. Nothing here claims the speech caused anything. It is quoted because the previous version of this page identified it as the missing input, and it has now arrived.
That is the honest position, and it has not improved with more information: the price moved a long way, the stated mechanism does not account for it, and the input that might have explained it has now been delivered and does not.
Are central banks still buying gold?
Yes, and at a record pace — while the price was falling and retail ETF holders were selling.
The World Gold Council’s Q2 2026 Gold Demand Trends, published on 30 July 2026, is the cleanest read on who is actually buying:
| Segment | Q2 2026 | Change |
|---|---|---|
| Central banks | 289t | +62% year on year |
| Gold ETFs | −45t | Outflow, mostly North America |
| Bars and coins | — | −3% year on year |
| Jewellery | — | −17% year on year |
| OTC | 327t | Largest single category |
Total demand was 1,269 tonnes in the quarter, flat on a year earlier. First-half demand of 2,522 tonnes was worth $380bn, a record in value terms even though tonnage was unremarkable — which is what happens when the average price is far above last year’s despite falling within the period.
Central bank buying reached 533 tonnes across the first half. Poland’s central bank was the largest single buyer in the second quarter at 51 tonnes; the People’s Bank of China added 33 tonnes, its biggest quarterly addition since the end of 2023.
The divergence is the interesting part. Official-sector buyers accelerated into a falling price. ETF holders, who respond to rates and the dollar rather than to reserve policy, went the other way — though first-half ETF demand was still modestly positive at 18 tonnes, so the second-quarter outflow reversed earlier buying rather than starting a rout.
What should you watch from here?
The three inputs that have moved gold all year: the Fed’s rate path, the oil price that feeds into it, and the official-sector buying that has run underneath both.
This article does not forecast the gold price and does not carry anyone else’s price target. What it can do is name the things that have demonstrably moved it in 2026, so you can read the next headline in context.
| What to watch | Why it mattered |
|---|---|
| The 15–16 September FOMC | The Fed’s own calendar; it carries economic projections |
| Payrolls, CPI | Each release moved Treasury yields |
| Oil, Hormuz talks | Energy fed the inflation expectations that moved the Fed |
| WGC quarterly data | Central bank buying ran through the whole drawdown |
Two structural notes. Central bank demand is not price-sensitive in the way investor demand is — it is reserve policy, and it continued through a drawdown that reached 25% at the July low. And a single monthly payrolls print is a volatile series subject to large revisions, so the 7 August move rests on a number that may look different in a month.
A third, added with this update and since retracted: this page judged that the relationship between oil and gold explaining most of 2026 had stopped holding in the middle of August. It had not — see the note at the top. Watching oil is still worth doing, but on the evidence of the last three weeks it is no longer sufficient on its own.
The bottom line
Gold at $4,610 is 13.3% below its January record and, for the first time since January, up on the year — 6.6%, having been down 1.9% when this page first ran three weeks ago.
The January-to-July decline has a clean explanation: oil moved inflation expectations, inflation expectations moved the Fed, and the Fed moved gold. The early-August rebound looked like that mechanism running backwards. What has happened since does not fit it. Oil rose through the second half of August and gold rose with it, which is the opposite of the relationship that explained the first seven months of the year.
Central banks kept buying through the whole drawdown; ETF investors did not. Beyond that, the honest summary of the last three weeks is that the price moved a long way and the explanation this page offered for the start of that move no longer covers it. There is no forecast here of where the price goes next, and no substitute explanation offered in place of one that has stopped working.
Important information
This article is for informational and educational purposes only. It is not investment, financial, legal, or tax advice, and is not a recommendation, offer, or solicitation to buy, sell, or hold any security or commodity. Nothing here is tailored to your individual circumstances.
The chart shows historical front-month COMEX gold futures closing prices. It is an illustration of what has already happened and does not predict future prices. Past performance does not guarantee future results.
This article contains no price forecast, and quotes no third-party price target, for gold or for anything else.
Prices are as of the dates stated and change continuously; this content may be out of date by the time you read it. All investing involves risk, including the possible loss of principal.
The author is not a licensed financial adviser or broker-dealer. Do your own research and consult a qualified, licensed financial professional before making any investment decision. Drawpie and the author accept no liability for any loss arising from the use of this content. Price data via Yahoo Finance.