Fed Rate Decision, July 2026: Three Votes for a Hike, and the Inflation Curve Behind Them

- The FOMC held the target range at 3.50–3.75% on 29 July 2026, but the vote was 9–3 and all three dissenters — Beth Hammack, Neel Kashkari and Lorie Logan — preferred to raise rates by a quarter point. The direction matters: these are hawkish dissents against a hold, not calls for a cut.
- Three or more officials last dissented together behind the same rate change on 21 September 2016, and that was also for a hike. The meeting before this one, on 17 June, was unanimous at 12–0.
- The Fed’s 2% goal is defined on the headline PCE price index, which rose 4.1% in the 12 months to May 2026 — the most recent reading the Committee had. The June figure is not published until 30 July 2026.
- The curve is not one line. Headline CPI spiked to 4.25% in May then fell to 3.53% in June on an energy drop; core CPI has not left a 2.46–3.11% band in thirteen months; core PCE has risen almost every month since October 2025, to 3.41%.
The Federal Open Market Committee left interest rates alone on 29 July 2026. The news is who voted against it. Three officials wanted to raise the target range by a quarter point — the first time in almost ten years that three or more members have dissented together behind the same rate change, and the previous occasion was also a call for higher rates.
Six weeks earlier the same Committee had voted 12–0.
What did the Fed decide on 29 July 2026?
Nothing changed, and the statement said so in one sentence: the Committee “decided to maintain the target range for the federal funds rate at 3-1/2 to 3-3/4 percent, in support of the Federal Reserve’s dual mandate.”
That range has now been in place since 11 December 2025. Five meetings in 2026 — January, March, April, June and July — have all left it alone.
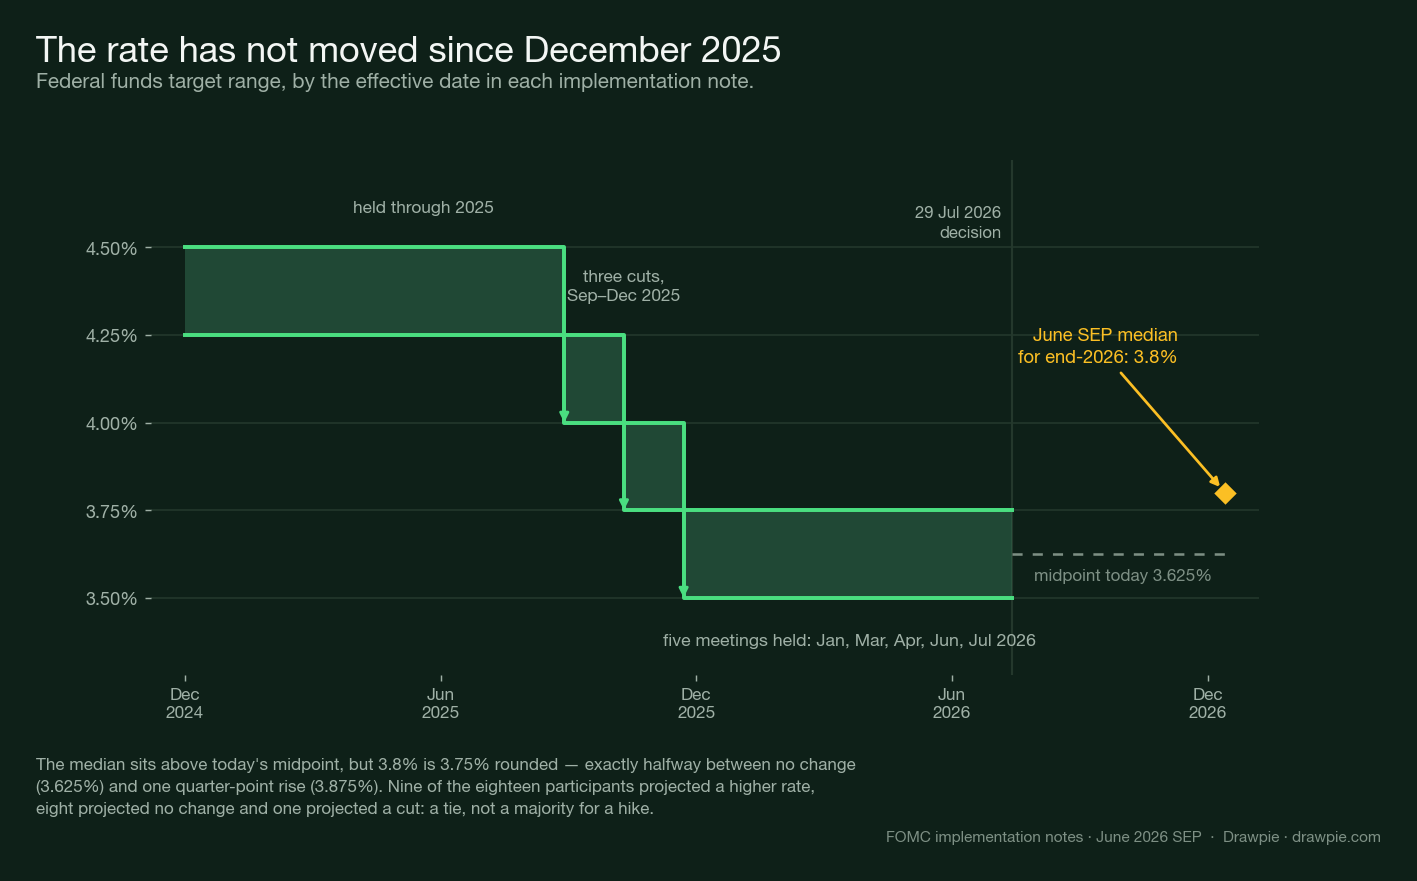
The administered rates were unchanged too, and the implementation note is word-for-word identical to June’s apart from the dates. Two of those settings belong to the Board of Governors rather than the FOMC, and the Board approved both unanimously: interest on reserve balances at 3.65% and the primary credit rate — the discount rate — at 3.75%. The rest sit inside the FOMC’s own directive to the New York Desk: standing overnight repo at 3.75%, the overnight reverse repo offering rate at 3.5% with a $160 billion per-counterparty daily limit, and the reinvestment instructions. The note describes that directive as part of the same policy decision — the decision the three dissenters voted against — and publishes no separate vote count for it.
One thing worth noting because it is easy to misread: there is no balance-sheet runoff in the directive and there has not been for some time. The Desk is told to roll over all maturing Treasury principal at auction, reinvest agency principal into Treasury bills, and buy more bills when needed to keep reserves ample. That is a portfolio being maintained and, if necessary, grown — not shrunk. It is the standing arrangement, not a change made at this meeting.
Who dissented, and which way?
Three officials voted against, and all three wanted rates higher.
The statement is unambiguous: “Voting against the monetary policy action were Beth M. Hammack, Neel Kashkari, and Lorie K. Logan, who preferred to raise the target range for the federal funds rate by 1/4 percentage point at this meeting.”
All three are Reserve Bank presidents — Cleveland, Minneapolis and Dallas respectively. All seven governors, including Chair Kevin Warsh, voted with the majority. So did John Williams of New York and Anna Paulson of Philadelphia. Of the four rotating regional presidents on the Committee this year, three broke ranks.
Two of them had said so in public beforehand. Logan told an audience in Houston on 16 July that “modestly higher interest rates would better balance the outlook and risks for the FOMC’s dual mandate goals.” Hammack said in Cleveland on 2 June that she was more worried about persistent inflation than about employment, and that policy “may not be sufficiently restrictive.”
Kashkari is the bigger turn, though the turn came earlier than the July vote. His own submissions to the December 2025 and March 2026 projections both carried one more quarter-point cut in 2026. By 1 May he had moved off that: in the essay explaining his April dissent he sets out the “mildly restrictive” reading and the case for further cuts in the past tense, as the view he held before the conflict in the Middle East, and argues the Committee should instead signal that “the next rate change could be either a cut or a hike.” The same essay describes the scenario that would push him further — the Strait of Hormuz staying closed — under which rate increases, “potentially a series of them, could be warranted, even at the risk of further weakness to the labor market.”
How unusual is a three-vote hawkish bloc?
Rare enough that the last clean precedent is nearly a decade old.
Three or more dissents at a single meeting is not itself unusual — September 2019, December 2025 and April 2026 all had three or four. But those were split, with members pulling in opposite directions. Three or more officials dissenting together, behind the same rate change last happened on 21 September 2016, when Esther George, Loretta Mester and Eric Rosengren each preferred to raise the target range while the Committee held.
The closest earlier parallel, 9 August 2011, had Fisher, Kocherlakota and Plosser dissenting together in a hawkish direction — but over the statement’s forward guidance, not the rate itself.
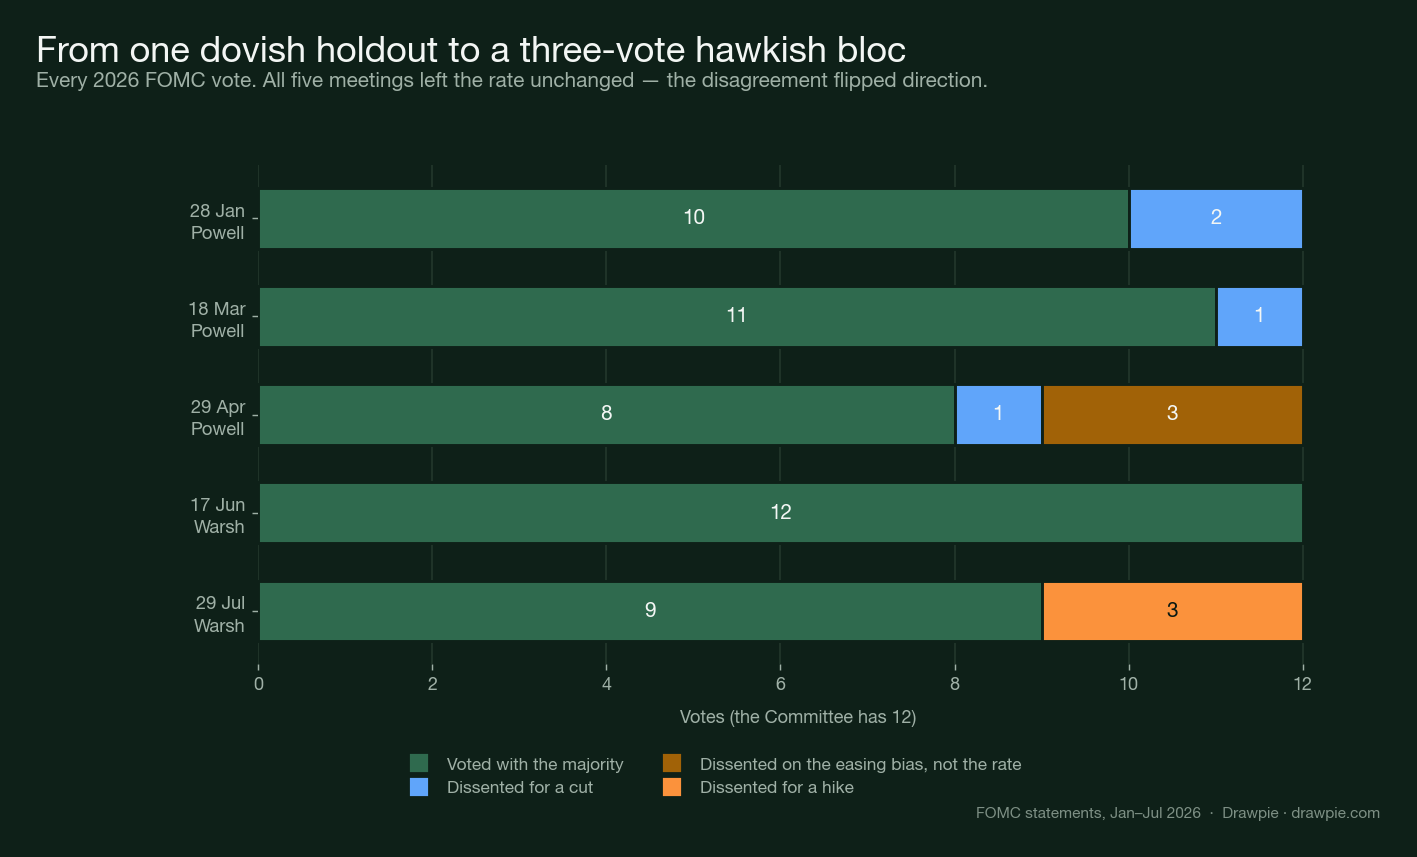
The chart is the story of 2026 in one frame. In January the dissenters were Stephen Miran and Christopher Waller, both wanting a cut — and Hammack, Kashkari and Logan all voted with the majority to hold. By April the same three had begun objecting, but only to the easing bias in the statement language; they explicitly supported the rate level. By July they were voting for a hike.
Two changes in the Committee’s composition sit underneath that. Kevin Warsh was sworn in as Chair on 22 May 2026, and this was his second meeting; Jerome Powell remains on the Board as a governor with a term running to 31 January 2028. And Miran, the only reliably dovish dissenter of 2026, resigned around the time Warsh arrived. The doves lost their vote; the hawks kept theirs.
Warsh’s statements also read differently. Both texts he has presided over give the vote as a bare count — “by a 12 – 0 vote” in June, “by a 9 – 3 vote” in July — without naming who voted in favour, where the January through April statements listed every member on both sides. The July statement is short, carries no forward-guidance paragraph at all, and ends on a flat assertion the Fed does not often make: “The Committee will deliver price stability.”
What does the US inflation curve actually look like?
There is no single curve. There are four, and they have been telling different stories since March.
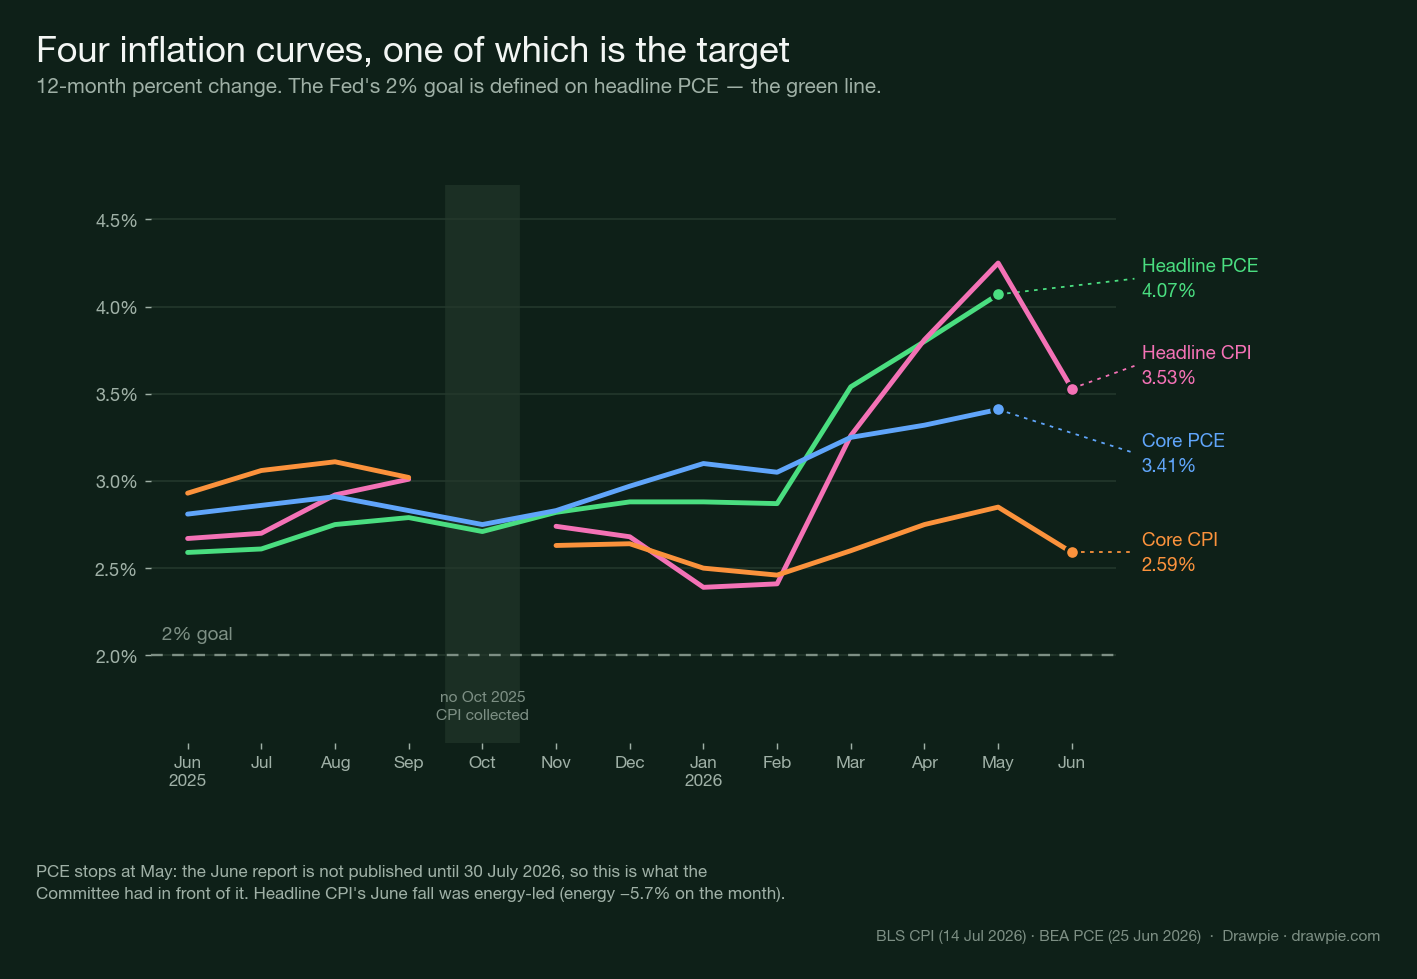
Read from the top:
- Headline CPI was benign as recently as February, at 2.41% over twelve months. It then ran to 4.25% by May and fell back to 3.53% in June. That June fall was the largest one-month drop since April 2020 — and it was almost entirely energy, which fell 5.7% on the month, seasonally adjusted.
- Core CPI, which strips out food and energy, has done almost nothing all year. Every one of the twelve readings available across the thirteen months charted here falls between 2.46% and 3.11%, and June came in at 2.59%.
- Headline PCE — the index the Fed’s target is actually defined on — reached 4.07% in the twelve months to May 2026.
- Core PCE is the one that should worry the Committee most. It has climbed from 2.75% in October 2025 to 3.41% in May, rising in six of the seven months in between with a single small dip in February — and with no energy spike to explain any of it away.
The gap in the CPI lines is not a rendering fault. October 2025 was never collected, because of the lapse in appropriations that year, so there is no October 2025 12-month CPI reading and no November month-over-month change. It also leaves no base month for an October 2026 twelve-month comparison, though BLS has not yet said how it will present that release.
One number is quietly reassuring underneath all this: shelter, the most persistent component of the last inflation episode, rose just 0.1% in June on the month — its smallest monthly change since January 2021 — and 3.3% over twelve months.
Why do CPI and PCE disagree?
Because right now they are not even measuring the same month, and on the months where they overlap, the usual relationship has inverted.
The freshest CPI is June. The freshest PCE is May. Putting June’s 3.53% CPI next to May’s 4.07% PCE and calling it a gap would be comparing two different periods.
On the same month, May 2026, the comparison is this:
| Measure | Headline | Core |
|---|---|---|
| CPI, 12 months to May 2026 | 4.25% | 2.85% |
| PCE, 12 months to May 2026 | 4.07% | 3.41% |
The headline figures are close. The core figures are not — and core PCE is running more than half a point above core CPI, which is the reverse of the long-run pattern. The two indices weight healthcare, housing and insurance differently and PCE adjusts for consumers substituting between goods, so they routinely differ; a divergence this wide, in this direction, is the part that is unusual.
This matters for reading the Fed. Its 2% objective is stated on the headline PCE price index — not CPI, and not core PCE. Core PCE is a forecasting aid the Committee talks about; it is not the target.
What do the Fed’s own projections say?
They moved sharply hawkish in June — but they stop short of a majority for a hike, and that distinction gets lost constantly.
The most recent Summary of Economic Projections, released alongside the June meeting on 17 June 2026, revised the Committee’s inflation view hard. The median projection for headline PCE inflation in 2026 went from 2.7% in March to 3.6% in June — a 0.9 percentage point revision in three months. Core PCE went from 2.7% to 3.3%.
The rate projection moved with it: the median for the federal funds rate at the end of 2026 rose from 3.4% in March to 3.8% in June, against a current target-range midpoint of 3.625%.
That number is worth slowing down on, because it is routinely read as the Committee announcing a rate rise. The SEP rounds each participant’s dot to the nearest eighth of a percentage point, so no change is 3.625% and one quarter-point increase is 3.875%. A published median of 3.8% is 3.75% rounded — exactly halfway between the two.
The Fed publishes the underlying distribution, and it shows why the median lands there. Of the eighteen participants who submitted a 2026 projection:
| Projected end-2026 midpoint | Participants | Versus today |
|---|---|---|
| 4.375% | 1 | three increases |
| 4.125% | 5 | two increases |
| 3.875% | 3 | one increase |
| 3.625% | 8 | no change |
| 3.375% | 1 | one cut |
Nine projected a higher rate than today’s, eight projected no change, and one projected a cut. With eighteen participants the median is the average of the ninth and tenth projections — which sit either side of the line, at 3.625% and 3.875%.
So exactly half of the eighteen participants projected a higher rate by year-end and half did not. The half that did is emphatic about it: six of those nine projected two increases or more. But a tied distribution is not a majority for a hike — and it is not even a vote. Eighteen people submit SEP projections; only twelve vote. Participants include Reserve Bank presidents who are not on the rotation this year, so the distribution above and the 9–3 vote are two different groups of people. Each dot is one participant’s own judgement of what would be appropriate policy, submitted separately: not a Committee decision, not a forecast of what the Committee will do, and not a commitment to anything.
What the June SEP does show is the direction of travel — and it makes three dissents in July less surprising than the headline vote count suggests.
For context, the same projections have unemployment at 4.3% for 2026 and real GDP growth at 2.2%. The Committee is not forecasting a downturn that would force its hand the other way.
What is the market pricing?
Rates above the current range, and by a wide margin — though the measure needs a health warning.
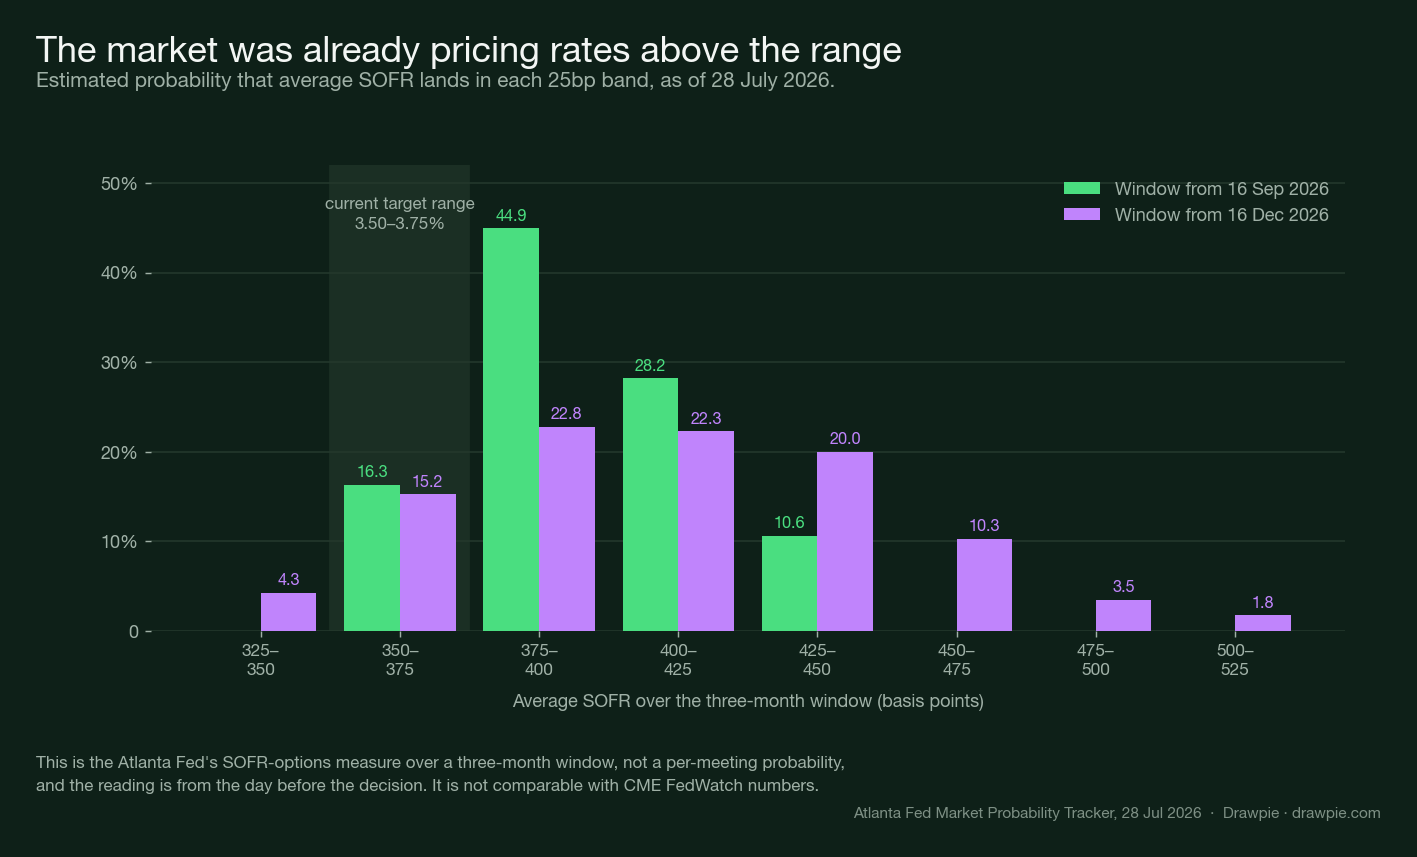
On the Atlanta Fed’s tracker, as of 28 July 2026, the single most likely outcome for the three-month window beginning 16 September was average SOFR between 375 and 400 basis points, at 44.9% — one notch above the current target range. The tracker’s own summary probability of a rate above the range for that window was 83.05%, against 1.14% for a rate below it. For the December window the distribution flattens out considerably, spreading from 325 to 525 basis points, which is what genuine uncertainty looks like rather than a consensus on how far rates go.
Three caveats, because this measure is frequently misquoted. It is built from CME three-month SOFR options and describes where the average rate lands over a three-month window, so it is not the probability of a move at any particular meeting. The latest observation predates the decision by a day. And it is not CME FedWatch — the two produce different numbers and should never be quoted interchangeably.
What happens next?
Three dates.
30 July 2026, 8:30 a.m. EDT. The June Personal Income and Outlays report, which carries the June PCE price index — the Fed’s actual target measure, and the first monthly update to it since 25 June. Given that June CPI fell hard on energy, a similar move in headline PCE would not be a surprise; core PCE is the line to watch, because it has no energy story attached to its climb.
12 August 2026, 8:30 a.m. ET. July CPI.
15–16 September 2026. The next FOMC meeting, which comes with a fresh Summary of Economic Projections. That is the first opportunity to move the rate, and the first look at whether the June revisions were the start of a trend or a one-off.
One structural point about the arithmetic of this Committee. All three dissenters lose their votes at the end of 2026: the 2027 rotation replaces Cleveland, Dallas, Minneapolis and Philadelphia with Chicago, Richmond, Atlanta and San Francisco. Whatever this bloc is going to achieve, it has five months of votes in which to do it.
For how the same rate pressure is showing up in a different market, our piece on UK mortgage rates hitting a one-month high covers what happens at the borrower end when a central bank stops cutting. And for how markets have been repositioning around this backdrop, see the rotation out of crypto and into AI hardware .
Sources
Every figure above comes from one of these. Each link was checked on 29 July 2026.
| Source | What it supports here |
|---|---|
| FOMC statement, 29 July 2026 | The decision, the 9–3 vote, the three dissenters and their stated preference for a quarter-point increase, and the inflation language |
| FOMC implementation note, 29 July 2026 | IORB 3.65%, discount rate 3.75%, standing repo 3.75%, ON RRP 3.5% with the $160bn limit, and the reinvestment directive |
| FOMC statement, 17 June 2026 | The 12–0 vote at the previous meeting |
| FOMC statement, 29 April 2026 | The four April dissents, and that Hammack, Kashkari and Logan objected to the easing bias while supporting the rate |
| FOMC statement, 21 September 2016 | The last time three members dissented together for a rate increase |
| June 2026 Summary of Economic Projections (PDF) | The 3.8% median end-2026 rate, 3.6% headline and 3.3% core PCE inflation medians, the March comparisons, and the note that each dot is rounded to the nearest 1/8 point |
| June 2026 SEP, HTML version | The Figure 2 accessible data table — the count of participants at each projected end-2026 rate |
| Statement on Longer-Run Goals and Monetary Policy Strategy (PDF) | That the 2% goal is defined on the annual change in the PCE price index |
| BLS Consumer Price Index, June 2026 | Headline CPI −0.4% on the month and +3.5% over the year, core +2.6%, energy −5.7%, shelter +0.1% and +3.3% |
| BEA Personal Income and Outlays, May 2026 | Headline PCE +4.1% and core PCE +3.4% over twelve months |
| Atlanta Fed Market Probability Tracker | The 28 July 2026 probability distributions for the September and December windows |
| Lorie Logan, remarks in Houston, 16 July 2026 | Her pre-meeting case for modestly higher rates |
| Beth Hammack, Cleveland, 2 June 2026 | Her view that policy may not be sufficiently restrictive |
| Neel Kashkari, “Why I Dissented”, 1 May 2026 | His December and March projections carrying a 2026 cut, and the oil scenario in which he would back increases |
| FOMC calendars | The remaining 2026 meeting dates |
| FOMC membership | The 2026 voter list and the 2027 rotation |
The 12-month rates plotted month by month in the first chart were computed from index levels published by the issuing bodies — BLS series CUUR0000SA0 and CUUR0000SA0L1E via the BLS Public Data API , and BEA NIPA table 2.8.4 series DPCERG and DPCCRG from the Section 2 workbook (XLSX, sheet T20804-M, vintage stamped “Data published June 25, 2026”) — rather than taken from any secondary compilation.
How we verified this
Every figure here comes from the body that issued it, checked on 29 July 2026. The decision, the vote, the dissent wording and the administered rates are quoted from the FOMC statement and implementation note published at 2:00 p.m. EDT on 29 July 2026. Historical target ranges come from each meeting’s own implementation note rather than the Fed’s summary rate table, because that table’s date column carries effective dates, not decision dates — the three 2025 cuts were decided on 17 September, 29 October and 10 December and took effect the following day.
Inflation figures are labelled by index, horizon and adjustment throughout, because the two indices are currently on different reference months and cannot be compared directly. The freshest CPI is June 2026; the freshest PCE is May 2026. CPI 12-month rates are not seasonally adjusted and month-over-month rates are, following BLS convention. Where a figure is shown to two decimals it was computed from the issuing body’s own published index levels — BLS series CUUR0000SA0 and CUUR0000SA0L1E, and BEA NIPA table 2.8.4 series DPCERG and DPCCRG — and may differ by 0.1 percentage point from the agency’s own rounding of the same change.
The October 2025 gap in the CPI charts is real and is not an error: BLS never collected that month because of the 2025 lapse in appropriations, and the series is flagged with footnote code X. It is shown as a break rather than interpolated.
One claim is deliberately weaker than the one usually made about this material. The June SEP’s 3.8% median is not treated here as the Committee projecting a rate rise. The dot counts in the table above are read from the accessible data table for Figure 2 published with the HTML version of the SEP, not estimated from the positions of dots in the chart: 1 participant at 4.375%, 5 at 4.125%, 3 at 3.875%, 8 at 3.625% and 1 at 3.375%, summing to the eighteen participants the document says submitted projections. Nine above today’s 3.625% midpoint against nine at or below it is a tie, and the median of 3.8% is 3.75% rounded — the average of the ninth and tenth dots, which sit either side of the line. Separately, the month-by-month counts — core PCE rising in six of the seven months from October 2025 to May 2026 with a dip in February, and core CPI’s range covering twelve available readings across thirteen calendar months — were arrived at by listing the values and comparing them one pair at a time rather than by describing the shape of the line.
Market pricing is from the Atlanta Fed’s Market Probability Tracker, whose latest observation is 28 July 2026 — the day before the decision. That measure estimates where average SOFR lands over a three-month window using CME SOFR options. It is not a per-meeting probability and is not comparable with CME FedWatch figures, which we could not access under CME’s data terms and have therefore not quoted. This is a description of what was published, not investment advice.