El Niño Winter 2026–27 Forecast: U.S. Temperature & Precipitation Outlook
Update log (1)
- — CPC's September ENSO diagnostic discussion landed on 10 September and moved the strength numbers this page carried from the 13 August edition. The probability of a historic October-December event rises from 69% to 75%; Niño-1+2 goes from +3.2 °C to +3.4 °C; and the discussion's full index set is now printed, including Niño-4 at just +0.1 °C against Niño-1+2's +3.4 °C — an event concentrated almost entirely in the eastern Pacific, which is the shape the analogue winters on this page come from. A very strong event stays above 90%. Added the caveat that CPC states the historic-event threshold in RONI terms, not ONI, and corrected the ONI note: the last completed season is now June-August at +1.80, not May-July at +1.40. The next discussion is 8 October; the regional outlook maps are superseded separately on 17 September, and the page now says that these are two different clocks.
The outlook this page reports says its own expiry date in its closing lines: ‘This set of outlooks will be superseded by the issuance of the new set next month on Sep 17 2026.’ On 17 September every probability band here is one issue behind, and CPC’s own text is the thing to re-read — not this page.
Everything else on the page is unaffected; the figures below still say when they were read.

- NOAA’s December–February outlook is already out. It was issued 20 August 2026 and it is not the October Winter Outlook everyone waits for — CPC reissues the whole set of seasonal outlooks monthly, and the winter one has been in the rotation for months.
- The clearest temperature signal is northern, not southern. Above-normal temperatures carry a greater than 50% chance from the Pacific Northwest to the Northeast by DJF. The southern tier gets equal chances — El Niño suppresses the warm signal there rather than making it cold.
- The strongest precipitation signal in the country is the Southeast, above 60% for above-normal precipitation from NDJ and holding through JFM. Coastal California and southern Arizona pass 50% from DJF, peaking in JFM.
- The forecaster deliberately left the classic El Niño dry signal off the Pacific Northwest coast. Recent comparable El Niño events were wet well north, so below-normal precipitation is restricted to inland areas — the Northern Rockies and Northern High Plains — during the core winter months.
- This El Niño keeps strengthening. CPC’s 10 September discussion puts August Niño-3.4 at +1.8 °C, Niño-1+2 at +3.4 °C and Niño-4 at just +0.1 °C, with a 75% chance that October–December produces a historic event exceeding every El Niño back to 1950.
The winter forecast most people are waiting for lands in October. The one that already exists came out on 20 August, and almost nobody reads it.
NOAA’s Climate Prediction Center reissues its full set of long-lead seasonal outlooks every month, on the third Thursday. Winter has been in that rotation since spring. The December–January–February outlook published three days ago is not a preview of the October release and not a leak of it — it is the current official forecast, with probabilities attached, and it will be replaced by a newer one on 17 September.
Here is what it says.
What does NOAA’s temperature outlook say for winter 2026–27?
Above-normal temperatures are favoured across the northern tier with a greater than 50% chance from the Pacific Northwest to the Northeast by DJF. That is the strongest temperature statement in the document, and it runs along the top of the country rather than through it.
Below that band the signal weakens deliberately. Equal chances are indicated across the Southeast and south-central states from OND, “expanding to the southwestern CONUS by December-January-February (DJF), as El Niño tends to suppress above normal temperature chances across the southern tier.”
Note what that says and does not say. El Niño is not being forecast to make the southern tier cold. It is being forecast to cancel the warm tilt that recent decades would otherwise supply. For the southeastern states specifically the discussion goes one step further and favours near-normal temperatures from NDJ through FMA, because “cool El Niño impacts and warm trends are in opposition”.
In between sits the one genuinely modest call in the temperature outlook: a 33 to 40% chance of above-normal temperatures across much of the eastern Plains and the Mississippi Valley during DJF and JFM. Thirty-three percent is the no-signal baseline, so this is a tilt of a few points, and CPC labels it a “modest tilt” itself.
What does the precipitation outlook say?
The Southeast carries the strongest signal in the country: above-normal precipitation exceeding 60% by NDJ, with enhanced probabilities persisting through JFM.
The second strongest is the West Coast, and it arrives later. Probabilities of above-normal precipitation “were increased significantly to above 50 percent across much of coastal California and adjacent areas of southern Arizona from DJF through FMA, peaking in coverage during JFM”. The reasoning given is that recent eastern-Pacific El Niños delivered heavily late in winter — the discussion points to February 1998 and February 2024 as among the wettest in a century for parts of California.
Between those two anchors, a wet tilt runs along almost the entire East Coast from NDJ through FMA.
The dry side of the map is smaller than the El Niño textbook would suggest, and that is a decision rather than an oversight, which is worth its own section below.
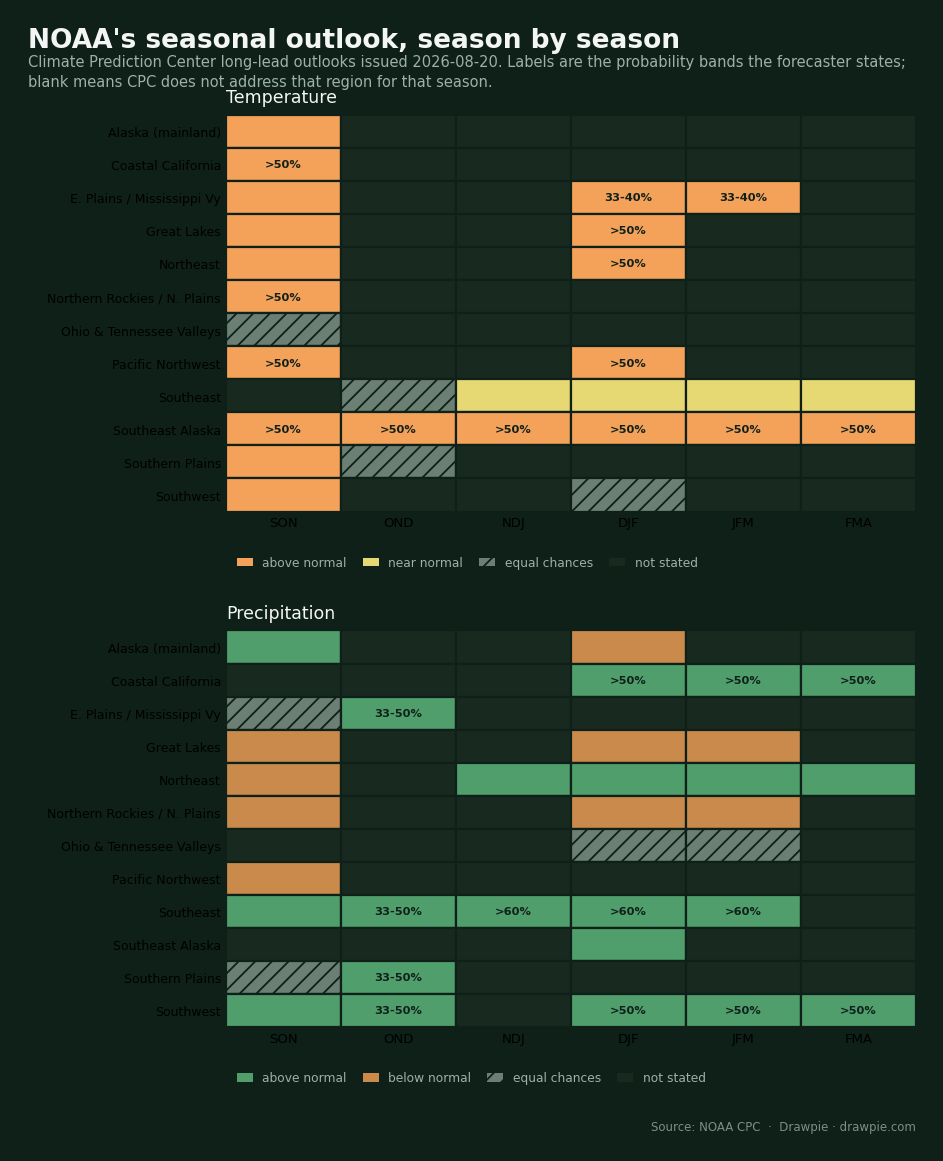
Every labelled cell is a probability band CPC states in the 20 August discussion. Blank cells are region–season pairs the forecaster does not address, and are left blank rather than filled in.
Why is the El Niño signal so weak this autumn and so strong in late winter?
Because El Niño’s grip on North American weather tightens as winter deepens, and this event’s closest historical analogues were slow starters.
The discussion is explicit that “El Niño impacts are expected to increase slowly at first before quickly ramping up during the core winter months and especially late winter”, and that the closest recent analogues to this eastern-Pacific event “are suggestive of a delayed onset of the greatest impacts across the southern CONUS”.
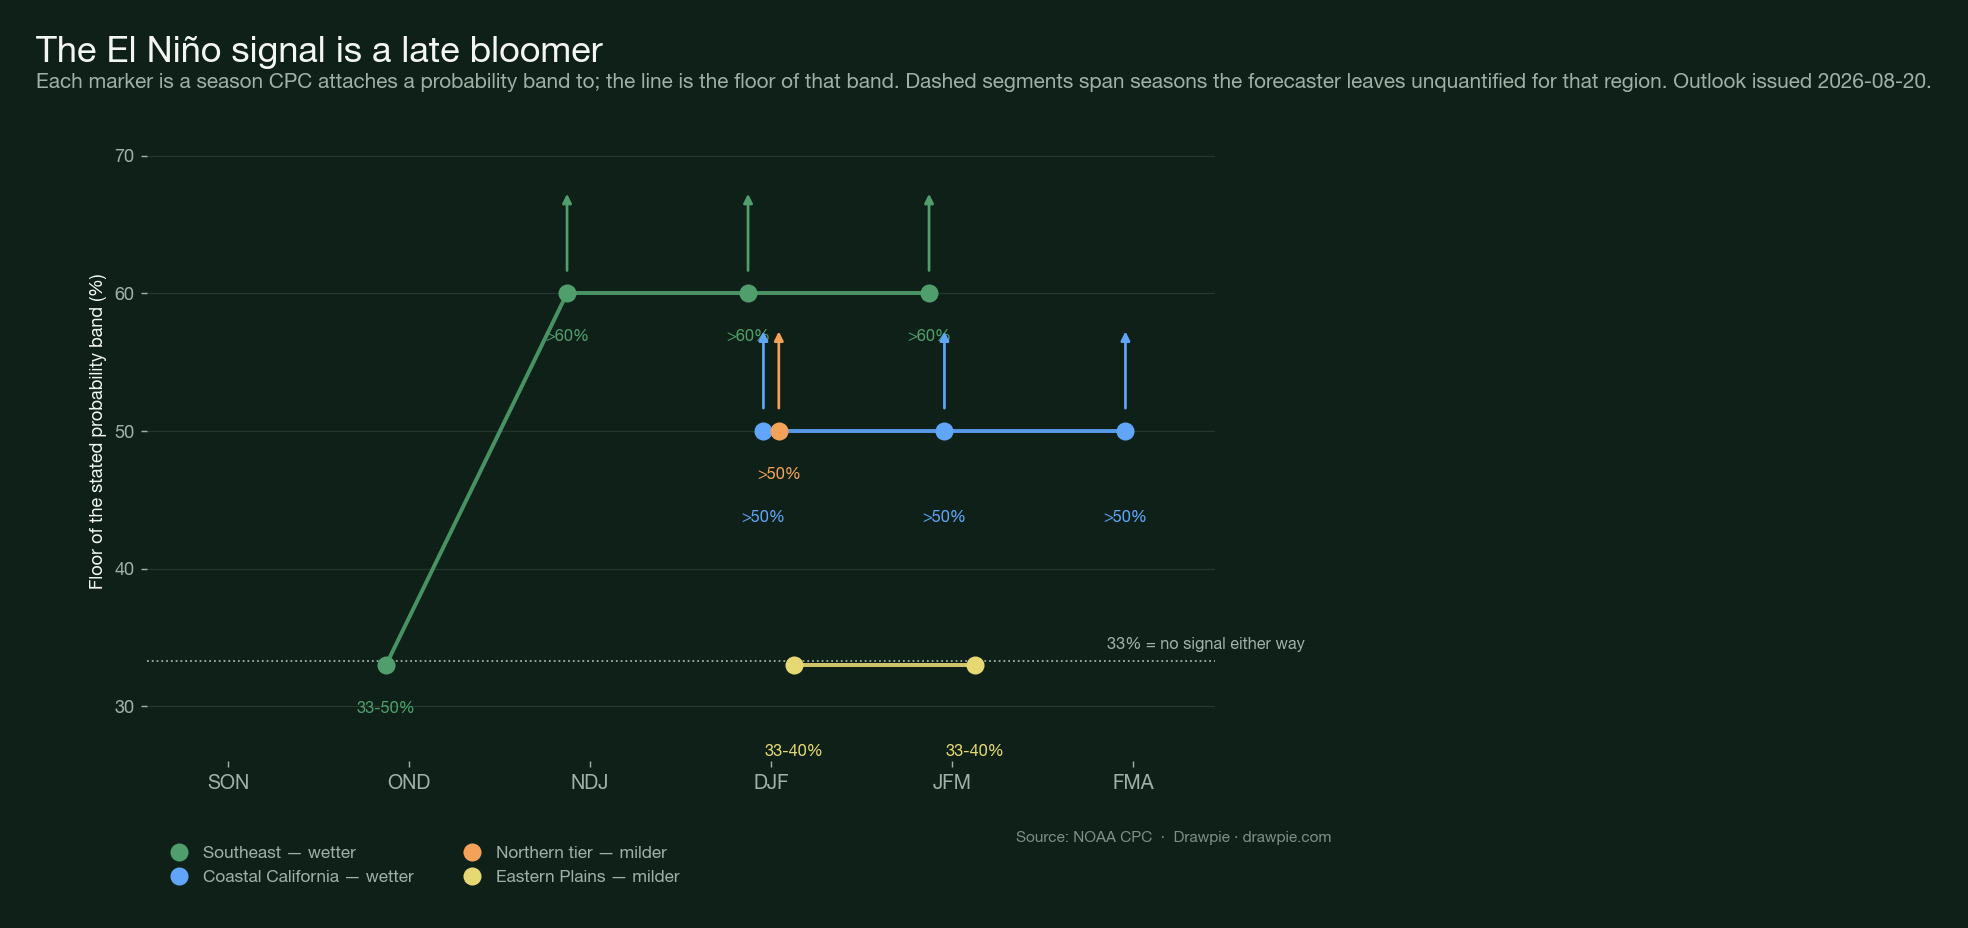
The Southeast is the clearest illustration. In OND it is a modest 33 to 50%. By NDJ it is above 60%, and it stays there. That is not a gradual climb; it is a step, and the step happens as autumn ends.
For anyone making a decision on this outlook, that timing is the practical content. An October or November built on El Niño expectations is being built on the weakest part of the forecast.
The dry signal NOAA left off the map
The most interesting single line in the discussion is about something that is not there.
A strong El Niño normally comes with a dry Pacific Northwest. This outlook does not draw one on the coast. The forecaster’s wording is that “a tilt toward below normal precipitation often associated with El Niño was left off the coast and restricted to inland areas such as the Northern Rockies and Northern High Plains during the core winter months”, because “some of the closest analogs to the current El Niño were wet well north along the West Coast, even encroaching much of the southern half of the Pacific Northwest.”
That is a forecaster overriding a composite with a judgement about which past events this one resembles. It is the kind of call that never survives into a summarised map, and it is why the discussion text is worth more than the graphic.
Two smaller versions of the same decision appear elsewhere. Parts of the Great Lakes get only a slight dry tilt. The Ohio and Tennessee valleys get equal chances outright, because analogues “are not supportive of a robust dry signal” there.
What does “equal chances” actually mean?
It means NOAA is declining to tilt the odds, not predicting an average winter.
This is the most commonly misread element of any CPC outlook. The definition in the document is that equal chances are forecast “for areas where probabilities for each category of seasonal mean temperatures and seasonal accumulated precipitation amounts are expected to be similar to climatological probabilities.”
In plain terms: below normal, near normal and above normal are all roughly a third, and the forecast tools give no basis for favouring one. A large EC area across the southern tier this winter is a statement about the limits of the forecast, not a promise of an unremarkable season.
How strong is this El Niño now?
Strong, and still strengthening — and the figures below were replaced on 10 September 2026, when CPC issued its September diagnostic discussion.
The current numbers, for August 2026:
| Index | Anomaly |
|---|---|
| Niño-3.4 | +1.8 °C |
| Niño-3 | +2.5 °C |
| Niño-1+2 | +3.4 °C |
| Niño-4 | +0.1 °C |
Sea surface temperature anomalies exceed +3.0 °C in the eastern equatorial Pacific, and CPC describes widespread subsurface anomalies in excess of +10.0 °C at depth.
🔑 Look at the spread across those four boxes. Niño-1+2, off South America, is at +3.4 °C; Niño-4, out in the western Pacific, is at +0.1 °C. That is an event concentrated almost entirely in the eastern Pacific, which is the classic shape of the events this page’s analogues are drawn from.
CPC now puts a 75% chance on October–December producing a historic event exceeding every El Niño back to 1950 — up from the 69% this page previously carried, which came from the 13 August discussion. A very strong event remains greater than 90% for autumn and winter.
⚠️ CPC states that probability in RONI terms — a three-month Relative Oceanic Niño Index of +2.5 °C or more — not in ONI terms. The two indices are not interchangeable and the threshold belongs to the one CPC used. For June–August 2026 the RONI reads +1.36 against the ONI’s +1.80, so subtracting the ONI from +2.5 understates the distance left to run by 0.44 °C. The winter forecast page works through why CPC phrases it that way .
One number to keep straight: the Oceanic Niño Index, the three-month running mean most coverage quotes, now has June–August 2026 at +1.80 as its last completed season. The +1.8 °C in the table above is a monthly Niño-3.4 value for August. They are different measurements that happen to be printing the same number this month, and they cannot be compared with each other.
For what a decaying event does the following year, see our 2027 super El Niño explainer .
When is the next update?
17 September 2026, at 8:30 AM Eastern, when CPC issues the next full set of outlooks and this one is formally superseded. After that, 15 October — which on recent precedent is also when NOAA’s public Winter Outlook news release has landed, though the agency does not pre-announce that date.
The ENSO diagnostic discussion, which updates the strength probabilities rather than the regional outlooks, already moved. The 10 September edition landed and its figures are the ones in the section above. The next one is 8 October 2026.
Two clocks, in other words, and they tick at different times: the strength numbers changed on 10 September, the maps change on 17 September.
Will this winter be colder or warmer than normal?
Warmer than normal is favoured across the northern half of the country, with a greater than 50% chance of above-normal temperatures from the Pacific Northwest to the Northeast in December–February. Across the southern tier NOAA gives equal chances, meaning it is not favouring any of the three categories. Nowhere in the contiguous United States is below-normal temperature favoured in this outlook.
Which states will be wettest this winter?
The Southeast has the highest stated odds in the country, above 60% for above-normal precipitation from November–January onward. Coastal California and southern Arizona exceed 50% from December–February through February–April, peaking in January–March. A weaker wet tilt runs along most of the East Coast.
Will El Niño bring more snow this winter?
A wetter winter is not automatically a snowier one, and this outlook does not forecast snowfall at all — CPC’s seasonal products cover temperature and precipitation only. The regions with the strongest wet signals here, the Southeast and coastal California, are also the ones where the same El Niño pattern tends to run mild, which works against snow. Our El Niño snow forecast page covers what the record shows about snow specifically.
Is NOAA’s official winter forecast out yet?
Both answers are true and it depends which product is meant. The routine long-lead seasonal outlook covering December–February is out, issued 20 August 2026 and updated monthly. NOAA’s separate public Winter Outlook news release, the one that generates the annual round of coverage, has landed in mid-October in each of the last several years and is not out.
Sources
| Source | Used for |
|---|---|
| CPC: Prognostic Discussion for Long-Lead Seasonal Outlooks | Every regional call, probability band and quotation on this page, plus the ENSO figures and the 17 September supersession date. Issued 8:30 AM EDT 20 August 2026 |
| CPC: seasonal outlook maps, DJF 2026-27 | That an official Dec-Jan-Feb 2026-27 temperature and precipitation outlook is published and current |
| NOAA PSL: Oceanic Niño Index | The +1.40 ONI value and that May–July 2026 is still the last completed season |
| Drawpie — NOAA winter forecast 2026–2027 | The October release precedent and the CPC release calendar |
| Drawpie — El Niño snow forecast 2026–27 | What the record shows on snow, which this outlook does not forecast |
How we verified this
🔴 Every regional call on this page traces to a phrase in one document, and that link is checked mechanically rather than by memory. The source is the Climate Prediction Center’s Prognostic Discussion for Long-Lead Seasonal Outlooks, issued 8:30 AM EDT on 20 August 2026, forecaster Scott Handel. Each cell in data/cpc-djf-2026-27-outlook.json carries the sentence it came from, and scripts/verify_cpc_quotes.py fails if any of those 25 quotes is not verbatim in the discussion. It was failing when first run — three quotes had CPC’s spelled-out season names abbreviated — and those were corrected rather than waved through.
⚠️ Where CPC says nothing about a region for a season, this page says nothing either. The grid renders those as “not stated”. They are not equal chances, and they are not interpolated from the seasons on either side. Of 62 region-season pairs, 27 carry a stated probability band; the rest are directional only or absent.
🔴 “Equal chances” is not a forecast of normal weather and is not presented as one. CPC’s own definition is that probabilities for each category are expected to be similar to climatological probabilities — that is, the outlook declines to tilt the odds. A reader who takes EC across the southern tier as “a normal winter” has read it backwards; it means the tools disagree or the signal is absent.
⚠️ Two different El Niño numbers appear in coverage and they are not interchangeable. The ONI is a three-month running mean and its last completed season is May–July 2026 at +1.40, checked directly against NOAA PSL’s oni.data on 23 August. The +1.8 °C in this article is the latest weekly Niño-3.4 value quoted in the 20 August discussion. Neither is wrong; mixing them is.
This page reports an outlook; it does not add a forecast. No number here is ours. There is no snowfall total, no storm count, and no claim about any particular date — seasonal outlooks tilt three-month odds and cannot do any of those things, and the discussion says as much: they “are intended for use prior to the start of their valid period.”
The October release is a separate product and this page does not conflate them. NOAA’s public Winter Outlook news release, the one with the maps that circulate every autumn, is expected in mid-October on recent precedent. What is reported here is the routine monthly long-lead set. Our NOAA winter forecast page covers the release calendar and the precedent behind that October date.
🔴 CPC’s own expiry is honoured rather than estimated. The discussion closes by naming 17 September 2026 as the date this set is superseded, which is the perishes date on this page.