El Niño Snow Forecast 2026–27: Where the U.S. Could See More and Less Snow
Update log (3)
- — Re-checked directly against CPC's own pages rather than against a secondhand claim we had not yet run down: a recon pass had surfaced a report of a roughly +3.0°C WEEKLY Nino-3.4 reading around 16 September, meaningfully above the +1.8°C MONTHLY figure this page already carried, and weekly and monthly readings are not the same measurement. The ENSO Diagnostic Discussion itself is unchanged — still the 10 September one, with 8 October confirmed as the next and not yet posted — so the monthly strength table below is untouched. What we could verify: CPC's own weekly ENSO monitoring briefing, 'ENSO: Recent Evolution, Current Status and Predictions,' dated 28 September, puts the latest weekly Nino-3.4 reading at +2.2°C — on the relative (tropical-mean-subtracted) convention that briefing now uses for weekly monitoring, not the plain SST anomaly the +1.8°C monthly figure uses, so the two still are not directly comparable. That is not the +3.0°C figure we set out to check, and the closest weekly readings to +3.0°C in CPC's own briefing belong to Nino-3 (+3.1°C) and Nino-1+2 (+3.9°C) — different regions of the Pacific, not Nino-3.4. We also tried CPC's older, non-relative weekly SST file directly to test the +3.0°C claim on a matching basis and could not retrieve current rows from it, so that specific claim is neither confirmed nor refuted here and is not stated as fact anywhere on this page. NOAA's flagship Winter Outlook remains unissued as of this check.
- — CPC's September ENSO discussion landed on 10 September and the numbers moved, exactly as this page said they could: the probability of a historic October-December event rose from 69% to 75%, narrowing the gap against the greater-than-90% very-strong figure from about 21 points to about 15. The strength table is rebuilt on the September figures with the previous ones kept alongside for comparison, and now carries the full index set — Niño-3.4 +1.8 °C, Niño-3 +2.5 °C, Niño-1+2 +3.4 °C and Niño-4 just +0.1 °C. That spread is worth having on a snow page: almost all the warmth is in the eastern Pacific, which is the shape of the analogue winters this page is built on. Added that CPC states the historic-event threshold in RONI rather than ONI terms. Next discussion 8 October.
- — Expanded with the station record. The page was directional — which regions lean which way — and now carries inches: the 1991–2020 normal for 27 US metros beside what the eight strongest El Niño winters actually delivered there, detrended. The finding is the asymmetry (Buffalo about 15.6 inches below trend against Baltimore about 3.0 above) and that exactly one metro, Denver, was snowier in a majority of those winters. The page still refuses to forecast a total for this winter, and the section saying so was rewritten to keep that distinction explicit now that numbers appear.
The strength figures here are still read from the Climate Prediction Center discussion issued 10 September 2026, re-checked 28 September 2026 and still current: CPC’s own page confirms the next one is 8 October 2026 and it had not posted yet. The greater-than-90 percent and 75 percent probabilities can move that day — and they did move on the last one, from 69 to 75, so treat them as live rather than settled. CPC’s weekly monitoring update is on a faster cycle than that and can move the Nino-3.4 reading week to week, but it is not the hard trigger for this page — the monthly discussion is.
Everything else on the page is unaffected; the figures below still say when they were read.

- There is no official snow forecast for this winter, from NOAA or anyone else. What exists is a record of what past El Niño winters did, and NOAA’s flagship Winter Outlook — issued in autumn — covers temperature and precipitation, not snowfall totals.
- NOAA’s own conclusion from that record is that El Niño suppresses snow across more of North America than it adds to. Its phrase, from an analysis of 1959–2023, is that it appears to be the great snowfall suppressor over most of the continent.
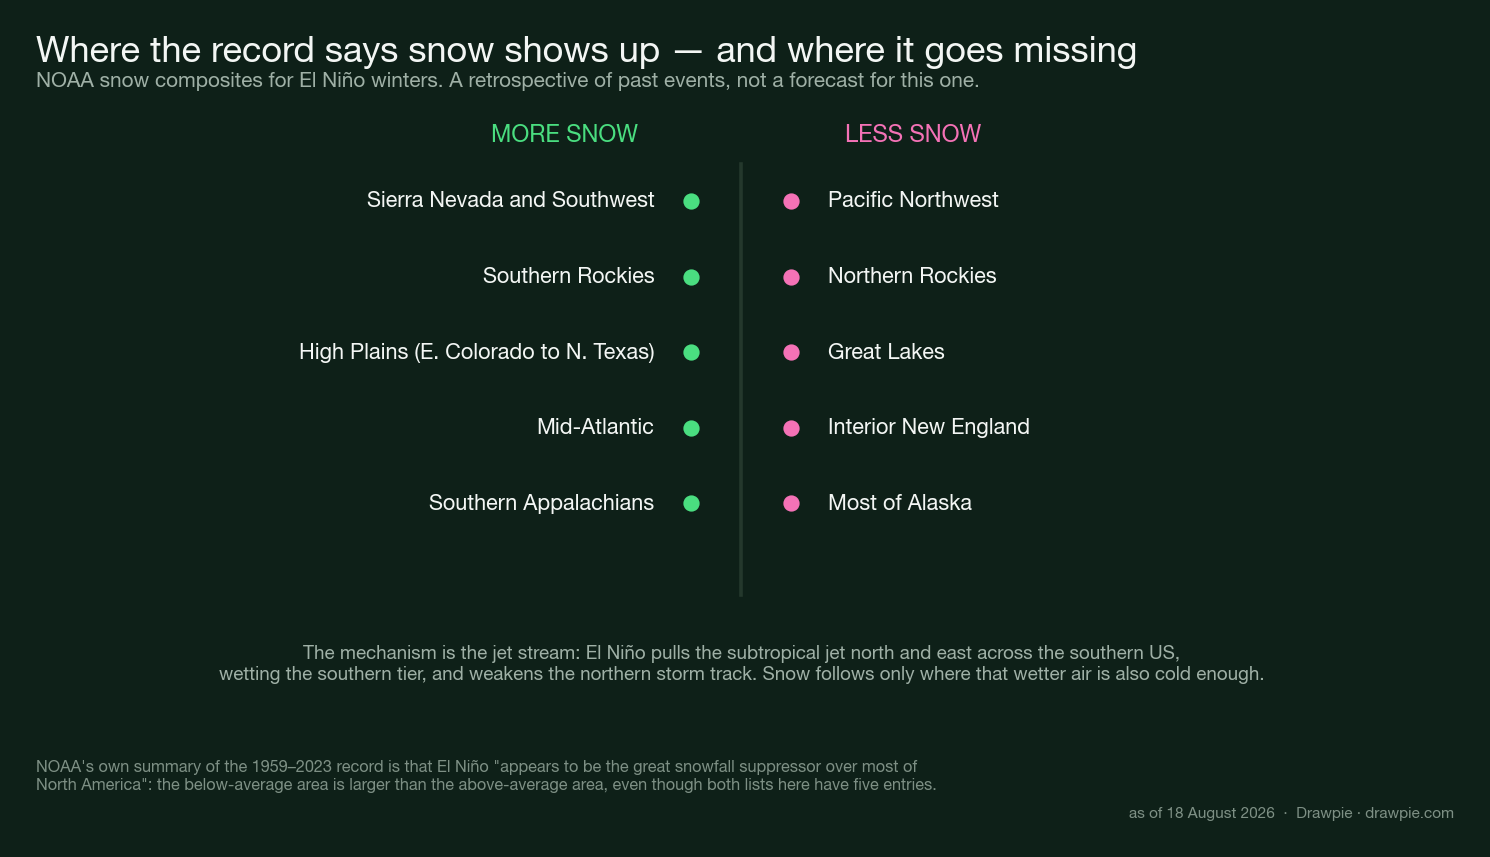
- The gains cluster in the Southwest, the southern Rockies and the high country of California, Nevada, Utah, Colorado, New Mexico and Arizona, plus the high plains, the Mid-Atlantic and the southern Appalachians.
- The losses run from the Pacific Northwest and northern Rockies across the Great Lakes to interior New England, and cover most of Alaska. On 10 September the Climate Prediction Center put a very strong event above 90% — but a stronger El Niño does not reliably mean more snow.
- Put in inches, the pattern is lopsided. Across 27 metros, the eight strongest El Niño winters ran about 15.6 inches below trend in Buffalo, 14.0 in Cleveland and 13.1 in Detroit — while the largest gain anywhere was Baltimore at plus 3.0 inches.
- Exactly one of those 27 metros, Denver, was snowier than trend in a majority of the eight winters. Detroit and Indianapolis were snowier in none of them.
There is no snow forecast for this winter. NOAA does not publish one, and neither does anyone else who can be checked.
What does exist is a record of what happened in past El Niño winters — and NOAA’s summary of that record is that El Niño takes snow away from more of North America than it gives it to.
Where could the U.S. see more or less snow?
The gains are narrow and mostly high up; the losses are broad and northern.
| Region | Signal in past El Niño winters |
|---|---|
| Sierra Nevada and Southwest | Above average |
| Southern Rockies | Above average |
| High plains — eastern Colorado, Nebraska, Kansas, northern Texas | Above average |
| Mid-Atlantic | Above average |
| Southern Appalachians — West Virginia, Virginia, North Carolina | Above average |
| Pacific Northwest | Below average |
| Northern Rockies | Below average |
| Great Lakes | Below average |
| Interior New England | Below average |
| Most of Alaska | Below average |
NOAA’s 1950–2009 analysis puts the largest positive departures in California, Nevada, Utah, Colorado, New Mexico and Arizona — the high country reached by the subtropical jet, where the extra moisture stays frozen.
Five entries on each side is not a 50-50 split. NOAA’s finding from the longer 1959–2023 record is that the below-average area is larger than the above-average area, which is why its summary sentence is about suppression rather than balance.
How much snow did those winters actually take away?
Enough to be worth a number — and the losses are far bigger than the gains.
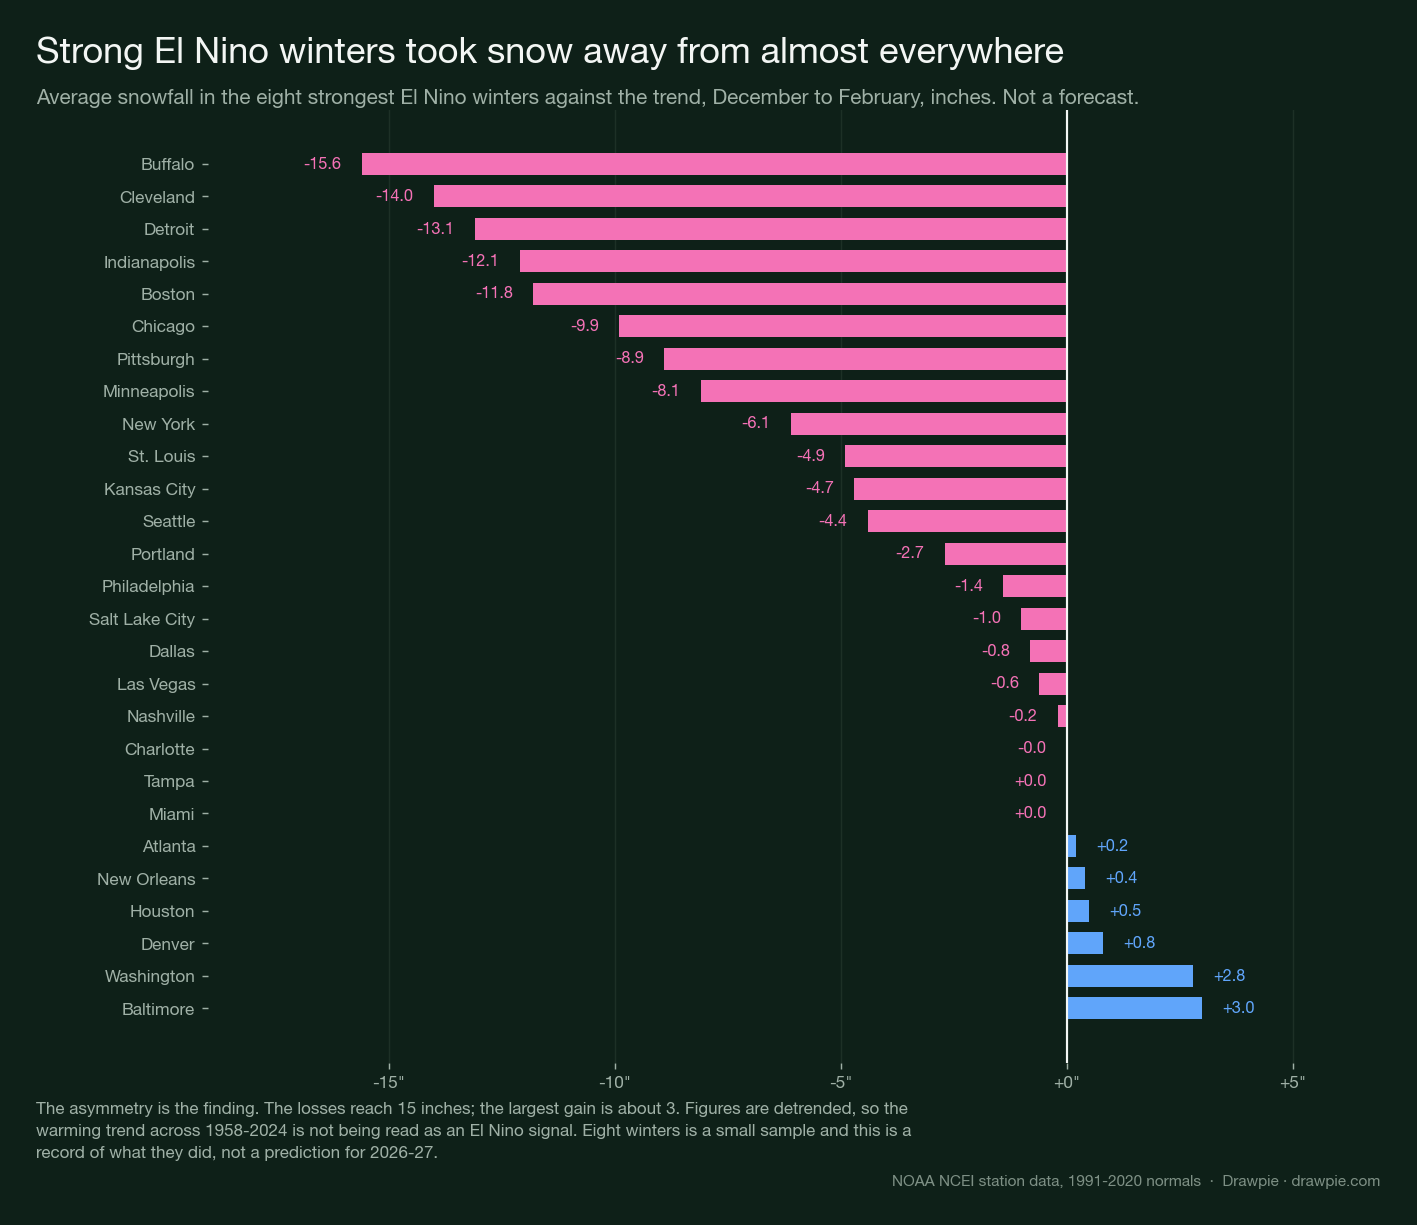
Everything above this point is directional — which regions lean which way. This is the same question asked with a ruler.
The eight strongest El Niño winters on record were pulled from the Oceanic Niño Index (any of them peaking at +1.6 °C or higher): 1958, 1966, 1973, 1983, 1992, 1998, 2016 and 2024. For each of 27 US metros with a published snowfall normal, the chart shows what those winters delivered against the underlying trend.
The asymmetry is the finding. Buffalo’s eight-winter average runs about 15.6 inches below trend. Cleveland is 14.0 below, Detroit 13.1, Indianapolis 12.1, Boston 11.8. The largest gain anywhere in the set is Baltimore at +3.0 inches, with Washington at +2.8.
That is what NOAA’s phrase about suppression looks like when you put inches on it: the cities that lose, lose a foot or more; the cities that gain, gain an inch or three.
What a normal winter brings, and what those winters brought
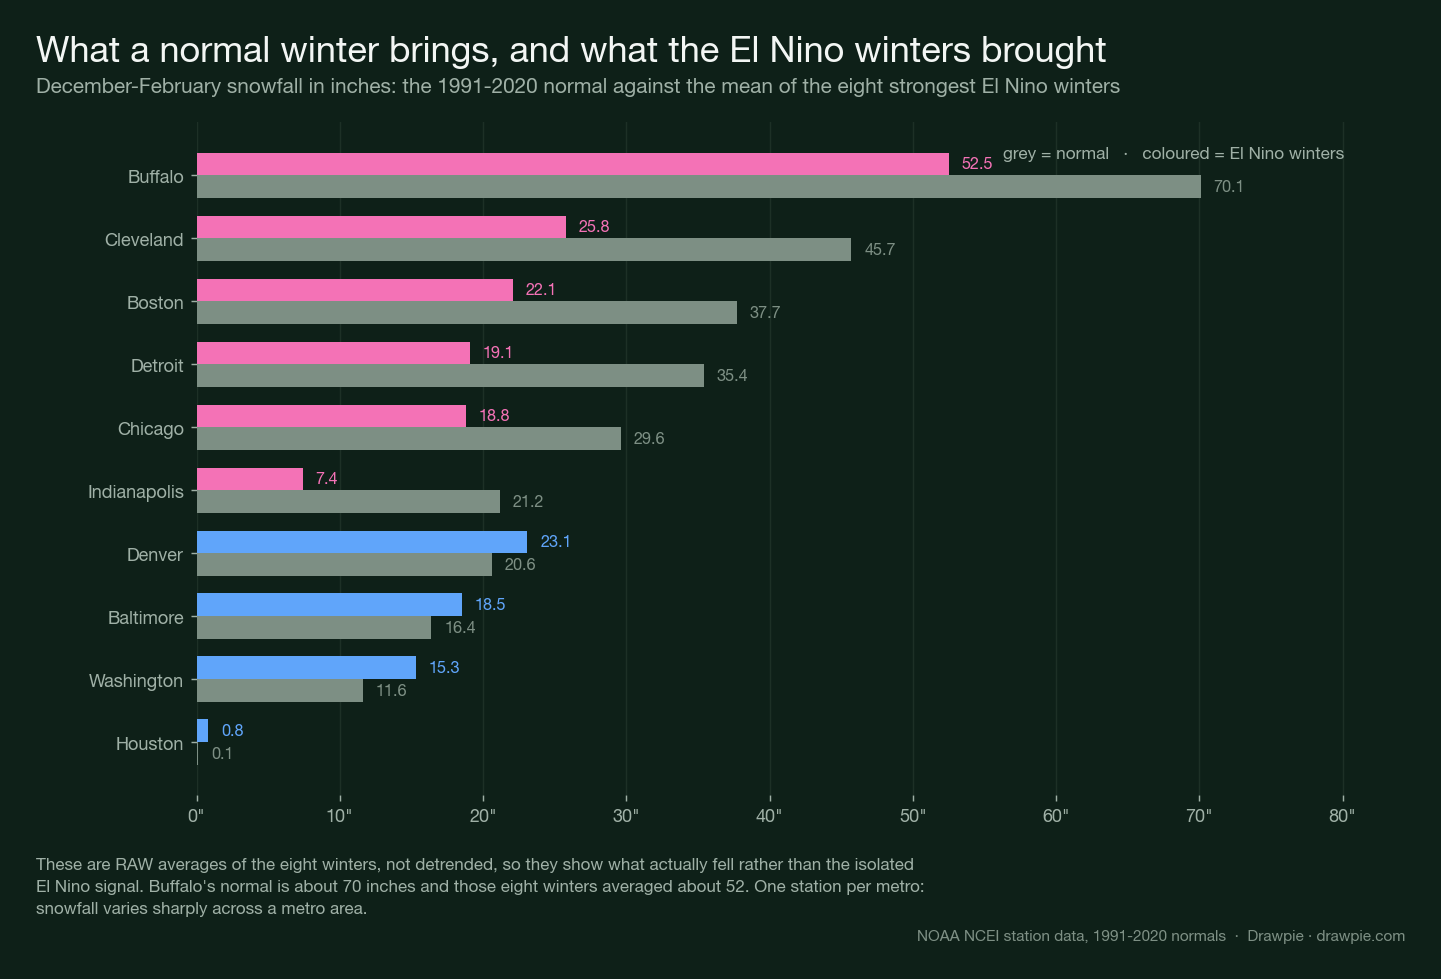
Anomalies are hard to feel. Absolute inches are not.
| Metro | Normal (Dec–Feb) | Those eight winters | Against the trend | Snowier in |
|---|---|---|---|---|
| Buffalo, NY | 70.1" | 52.5" | -15.6" | 2 of 8 |
| Cleveland, OH | 45.7" | 25.8" | -14.0" | 1 of 8 |
| Detroit, MI | 35.4" | 19.1" | -13.1" | 0 of 7 |
| Indianapolis, IN | 21.2" | 7.4" | -12.1" | 0 of 8 |
| Boston, MA | 37.7" | 22.1" | -11.8" | 1 of 8 |
| Chicago, IL | 29.6" | 18.8" | -9.9" | 0 of 6 |
| Pittsburgh, PA | 32.7" | 21.4" | -8.9" | 1 of 8 |
| Minneapolis, MN | 31.9" | 22.1" | -8.1" | 2 of 8 |
| Denver, CO | 20.6" | 23.1" | +0.8" | 5 of 8 |
| Washington, DC | 11.6" | 15.3" | +2.8" | 4 of 8 |
| Baltimore, MD | 16.4" | 18.5" | +3.0" | 4 of 8 |
Read the Buffalo row as the shape of the whole thing: a normal winter brings about 70 inches, and those eight winters averaged about 52. The city still got buried. It got buried less.
And read the Baltimore row as the limit of the good news: a normal winter brings 16.4 inches, those winters averaged 19.5. Real, and small.
How thin is the evidence?
Eight winters thin — which is why the counts are published rather than only the averages.
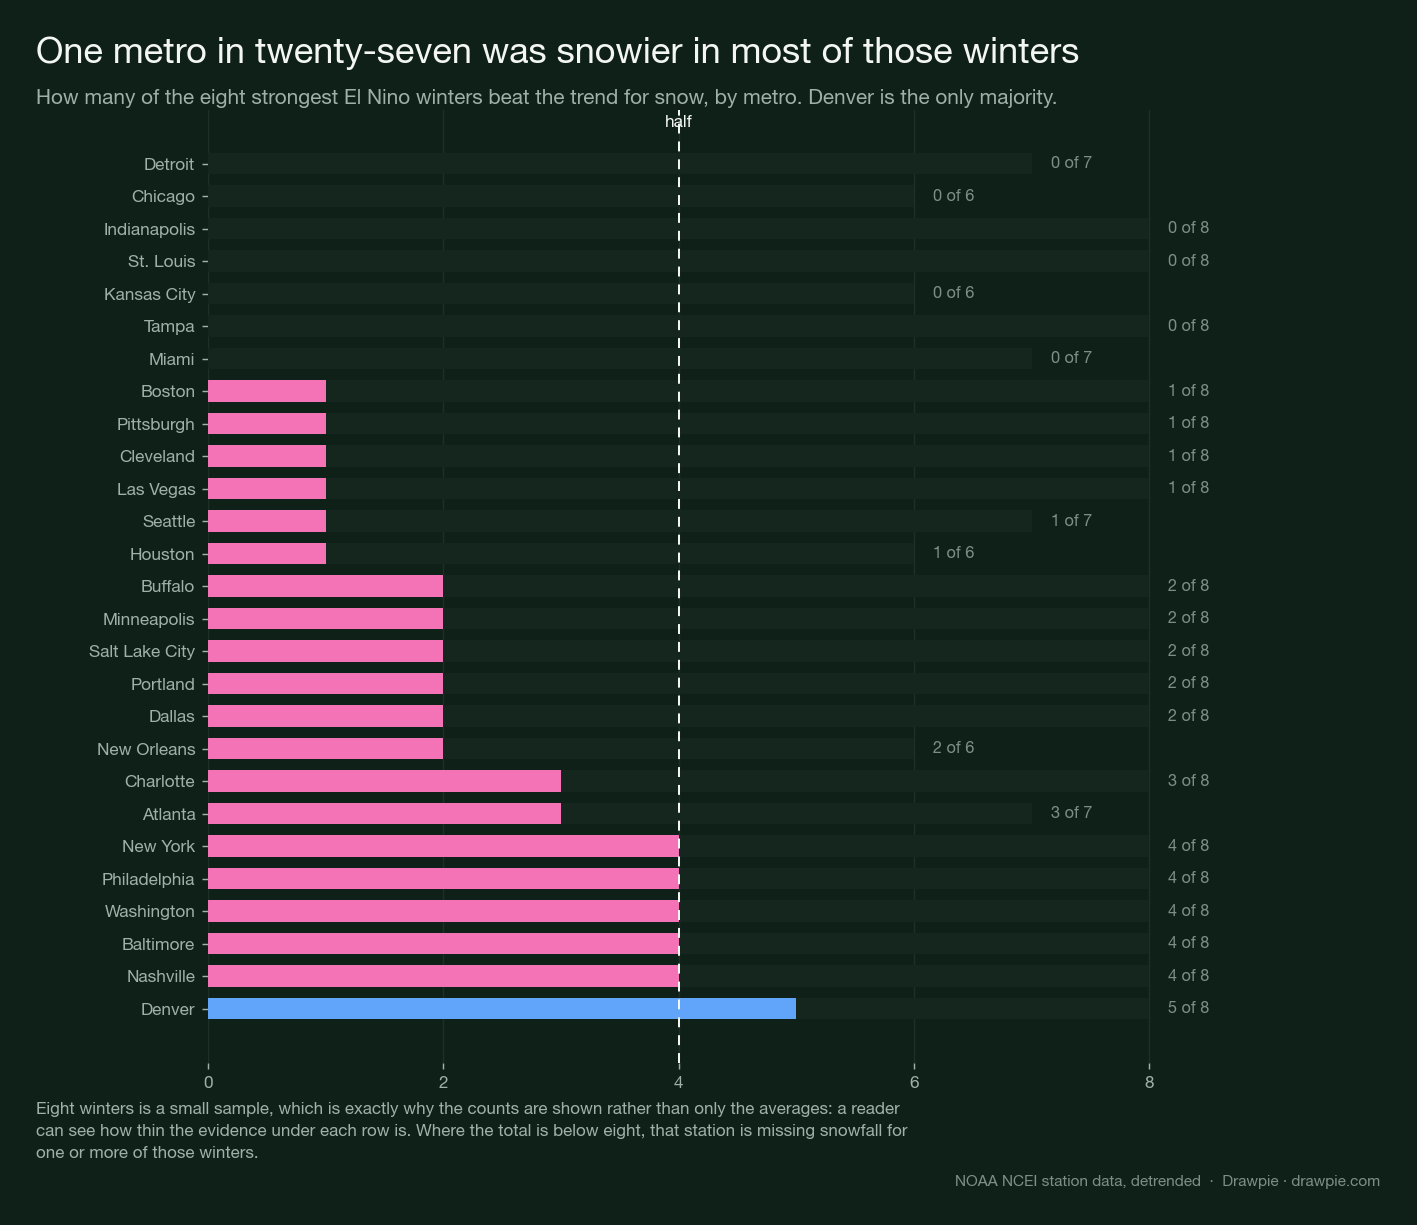
An average of eight numbers can hide a lot. A metro could show a mild negative because seven winters were near normal and one was catastrophic, which is a different world from eight consistently quiet ones.
So here is the count. Of the 27 metros, exactly one — Denver — was snowier than trend in a majority of those eight winters. Detroit and Indianapolis were snowier in none of them.
That is a strikingly one-sided record, and it is still only eight winters. Both of those sentences are true and the second one is the reason this page will not turn any of it into a forecast.
Is there an official snow forecast for this winter?
No — and this is the part most coverage gets wrong.
| Product | What it actually gives you | When |
|---|---|---|
| ENSO Diagnostic Discussion | El Niño strength and probabilities | Monthly — last 10 September, next 8 October |
| CPC Winter Outlook | Temperature and precipitation probabilities | Autumn |
| A national seasonal snowfall map | Does not exist | — |
Even the flagship Winter Outlook, the one whose maps circulate every October, forecasts temperature and precipitation, not snowfall totals. Seasonal snowfall is not something NOAA issues as a national forecast. So an article promising how many inches your state will get this winter is working from something other than a NOAA forecast.
What did NOAA just say about El Niño’s strength?
Very strong is close to settled. Record-breaking is likely but not certain.
| CPC figure, 10 September 2026 | Value | Was, 13 August |
|---|---|---|
| Alert status | El Niño Advisory | unchanged |
| Very strong event, autumn–winter | Greater than 90% | unchanged |
| Historic event, October–December | 75% | 69% |
| Niño-3.4 index, August | +1.8 °C | +1.4 °C (July) |
| Niño-3 | +2.5 °C | — |
| Niño-1+2 | +3.4 °C | — |
| Niño-4 | +0.1 °C | — |
The synopsis reads that El Niño is strengthening, with a greater than 90% chance of a very strong event during Northern Hemisphere autumn and winter 2026-27. The 75% figure is the probability that October to December exceeds every El Niño back to 1950 — stated by CPC as a three-month RONI of +2.5 °C or more, not an ONI value.
The gap between those two numbers has narrowed from about 21 points to about 15. That is the part still open, and it is closing. It was never whether this is a big event. It is how big.
🔑 The four index boxes are worth a second look. Niño-1+2, off the coast of South America, is at +3.4 °C. Niño-4, in the western Pacific, is at +0.1 °C. Almost all of the warmth is in the east — which matters for a snow page, because the analogue winters below were themselves eastern-Pacific events.
Re-checked 28 September: the 10 September discussion is still the current one, and CPC’s own page confirms the next is 8 October and had not posted. Between discussions, CPC also runs a weekly monitoring product, and its 28 September update — ENSO: Recent Evolution, Current Status and Predictions — puts the latest weekly Niño-3.4 reading at +2.2 °C, continuing to climb. Read that figure carefully: it is on a relative basis, meaning the tropical-wide mean SST anomaly has already been subtracted out, which is a different convention from the plain +1.8 °C monthly figure two paragraphs up — the two are not the same measurement and should not be subtracted from each other or averaged together. A claim reaching us separately, of a weekly Niño-3.4 reading near +3.0 °C in mid-September, does not match what CPC’s own weekly briefing shows for that box; the closer matches in that same briefing are Niño-3 at +3.1 °C and Niño-1+2 at +3.9 °C, which are different regions. We could not check that claim against a matching, non-relative weekly figure either, because CPC’s older weekly SST file did not return current rows through the tools available to us — so it stays unresolved rather than printed as fact.
Does a stronger El Niño mean more snow?
No, and NOAA says so directly.
The composites are averages of past events, and NOAA warns that stronger events do not reliably produce stronger impacts. The most recent very strong El Niño inverted part of the expected west-coast pattern, which is exactly the kind of thing a composite of twenty-odd events cannot rule out.
A record-strength event is a reason to expect an unusual winter. It is not a reason to expect a snowier one, and for most of the northern tier the historical lean runs the other way.
Why can a wetter winter be a less snowy one?
Because snow needs the moisture and the cold in the same place, and El Niño moves them apart.
El Niño pulls the subtropical jet north and east across the southern United States. That wets the southern tier, and it weakens the northern storm track, which dries the north. Snow follows only where the wetter air is also cold enough — which is why the gains cluster in high country and the Mid-Atlantic, and why a wetter-than-normal winter in the Southeast can still be a nearly snowless one.
What this article cannot tell you
How much snow will fall where you live this winter. No forecast total for any location appears on this page, because no defensible source produces one at this range.
The inches above are a different thing, and the distinction matters. They are a record: what normally falls, and what actually fell in eight past winters that resembled this one in a single respect. A record of the past is not a prediction of the future, and eight winters is a thin record even of the past.
It also cannot tell you whether this winter behaves like the composite at all. The sample is thin, the last very strong event broke part of the pattern, and the drivers that decide any individual month are not predictable months ahead.
For the temperature and precipitation maps NOAA does publish, see the El Nino winter outlook . For the temperature side of the same winter, see our 2026/2027 US winter forecast . For what happens to the event after it peaks, we looked at the decay year .
Sources
| Source | What it supports here |
|---|---|
| NOAA Climate Prediction Center: ENSO Diagnostic Discussion | The 10 September 2026 alert status, the greater-than-90% and 75% probabilities, the August Niño index values, and the 8 October date for the next discussion, reconfirmed still current on 28 September |
| NOAA Climate Prediction Center: ENSO — Recent Evolution, Current Status and Predictions (28 September 2026) | The latest weekly Niño index readings — Niño-3.4 +2.2°C, Niño-3 +3.1°C, Niño-1+2 +3.9°C, Niño-4 +0.1°C — on the relative convention this briefing uses for weekly monitoring, and the note that a different SST dataset (OISSTv2.1) underlies weekly monitoring than the monthly ONI/RONI tables |
| NOAA Climate.gov: S(no)w pain, S(no)w gain — how does El Niño affect snowfall over North America? | The 1959–2023 composite, the “great snowfall suppressor” conclusion, and the regional pattern of above- and below-average snow |
| NOAA Climate.gov: Snow during El Niños from 1950 to 2009 | The largest positive departures being in California, Nevada, Utah, Colorado, New Mexico and Arizona |
Checked 18 August 2026; re-checked 13 September 2026. Re-checked again 28 September 2026, when CPC’s ENSO discussion was confirmed still current and its weekly monitoring briefing was read in full for the first time to test a secondhand weekly-reading claim. This article contains no snowfall totals and no seasonal snow prediction. No affiliate links, and no payment was received for any link on this page.
How we verified this
✅ The metro figures are computed from station data, not repeated from NOAA. Eight analog winters were selected from the Oceanic Niño Index at a +1.6 °C threshold, and each metro’s snowfall was compared against its own 1991–2020 normal. 🔴 The anomalies are DETRENDED. Comparing raw snowfall across 1958–2024 confounds the El Niño signal with the warming trend; on an earlier winter page that mistake produced a north–south pattern that vanished once the trend was removed. The ranked chart and the counts use the residual series. The normal-versus-actual chart shows raw inches and says so. ⚠️ One first-order station stands in for each metro, and snowfall varies sharply across a metro area. Three of the 30 metros have no published snowfall normal and are absent. The single most important thing on this page is that no snow forecast exists. NOAA does not issue a national seasonal snowfall map. Its flagship Winter Outlook, published in autumn, forecasts temperature and precipitation probabilities. Any article giving a snowfall total for a state this winter is not working from a NOAA forecast, and this page prints no totals for anywhere.
The regional pattern comes from NOAA’s own composites, and is labelled as a retrospective throughout. The 1959–2023 analysis, based on ERA5 data and published by NOAA Climate.gov, compares snowfall in El Niño winters against the 1991–2020 average. A separate Climate.gov analysis covering 1950–2009 is the source for the largest positive departures being in California, Nevada, Utah, Colorado, New Mexico and Arizona. Both describe what happened in past events. Neither is a prediction of this one.
✅ The strength figures are from the Climate Prediction Center discussion issued 10 September 2026, read on the CPC’s own page: alert status El Niño Advisory, greater than 90% chance of a very strong event for autumn and winter 2026-27, and a 75% chance that October–December exceeds every El Niño back to 1950. They replace the 13 August figures this page previously carried, where that last probability was 69% — the numbers did move, exactly as the page said they could. The next discussion is 8 October 2026, and re-checking CPC’s page on 28 September confirms it had not posted yet — this remains the current discussion. ⚠️ CPC states the historic-event threshold as a three-month RONI of +2.5 °C or more, not as an ONI value. This page quotes the probability with the index CPC used and does not convert between the two, because they are not interchangeable — for June-August 2026 they read +1.36 and +1.80 respectively. The analog winters below are selected on the ONI, which is the series with the continuous record the selection needs; that is a deliberate and consistent choice, not a mixing of the two. 🔴 A claim reached us that a WEEKLY Nino-3.4 reading hit roughly +3.0 °C around 16 September — meaningfully above the +1.8 °C MONTHLY figure above — and we could not stand it up against a primary source on a matching basis. CPC’s own weekly monitoring briefing, ENSO: Recent Evolution, Current Status and Predictions, dated 28 September 2026, gives the latest weekly Nino-3.4 reading as +2.2 °C — but on a relative (tropical-mean-subtracted) convention that briefing now uses for its weekly SST monitoring, which is not the same convention as the plain monthly anomaly this page quotes at +1.8 °C, so neither number should be read against the other directly. It is also not the +3.0 °C figure itself. The nearest weekly readings to +3.0 °C in that same briefing belong to Nino-3 (+3.1 °C) and Nino-1+2 (+3.9 °C) — different boxes of the Pacific, not Nino-3.4, which raises the possibility the original claim named the wrong region. We separately tried CPC’s older, non-relative weekly SST file to test +3.0 °C against a matching convention and could not retrieve current rows from it, so that specific number is neither confirmed nor refuted and does not appear as fact anywhere on this page.
The chart shows five regions on each side, and that is not the same as a 50-50 split. NOAA’s finding is that the below-average area is larger than the above-average area. The chart’s own footnote says so, because five bullets against five bullets would otherwise read as a balance that the underlying maps do not show.
This page replaces an earlier one on the same subject. The previous version, published 13 August, carried the same NOAA sources and the same conclusions; this one is organised around where the snow goes, adds the source table the earlier page lacked, and the old URL redirects here.
Nothing here forecasts snowfall, and nothing here says this winter will resemble the composite. Twenty-odd events is a thin sample, the most recent very strong event inverted the expected west-coast pattern, and the drivers that dominate any individual month — the Madden-Julian Oscillation, the polar vortex — are not predictable at this range.