2026-27 US El Niño Snow Predictions: Where NOAA's Record Says Snow Goes

- NOAA’s own phrase for it is the opposite of the headlines. Its analysis of 1959-2023 concludes that “El Niño appears to be the great snowfall suppressor over most of North America” — the losses cover more ground than the gains.
- The gains are concentrated and mostly high up. Above-average snow shows up in California, Nevada, Utah, Colorado, New Mexico and Arizona, on the high plains of eastern Colorado, Nebraska, Kansas and northern Texas, and in the Mid-Atlantic and southern Appalachians.
- The losses run from the Pacific Northwest to New England. Below-average snow shows up across the Pacific Northwest, the northern Rockies, the Great Lakes, interior New England, western Canada and most of Alaska.
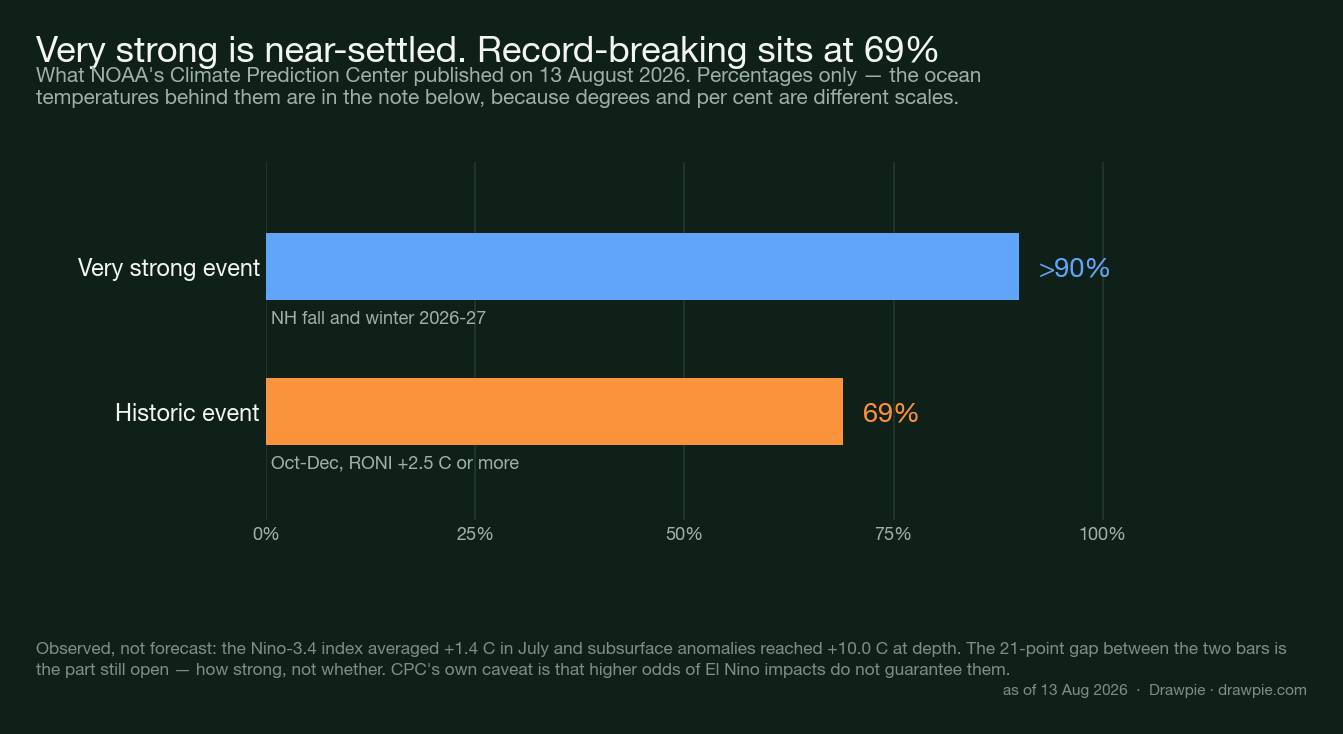
- A stronger El Niño does not mean more snow, and NOAA says so explicitly. On 13 August the Climate Prediction Center put a very strong event above 90% and a record-breaking one at 69% — but its composites are retrospectives, not forecasts, and it warns that stronger events do not reliably produce stronger impacts.
NOAA’s own summary of the evidence is that El Niño takes snow away from more of North America than it gives it to. Its phrase, from an analysis of 1959 to 2023, is that “El Niño appears to be the great snowfall suppressor over most of North America” — which is not the impression you get from a headline about a record-breaking event.
That matters this year, because the event really is heading for records. On 13 August 2026 the Climate Prediction Center put a very strong El Niño above 90% for the coming autumn and winter, and gave October to December a 69% chance of being the strongest since at least 1950.
Those two facts sit together uncomfortably, and the rest of this article is about how.
What did NOAA just say about El Niño’s strength?
Very strong is close to settled; record-breaking is likely but not certain.
| CPC figure | Value |
|---|---|
| Alert status | El Niño Advisory |
| Very strong | >90% |
| Historic, Oct–Dec | 69% |
| Niño-3.4, July | +1.4 °C |
The synopsis is unambiguous: El Niño is strengthening, with a greater than 90% chance of a very strong event during Northern Hemisphere autumn and winter. Beneath the surface, temperature anomalies reached +10.0 °C at depth, which is the reservoir that feeds the surface over the following months.
The 69% figure is the one worth reading twice. It is the probability that October to December produces a historic event — one exceeding every El Niño back to 1950, defined as a three-month RONI of +2.5 °C or more. So the gap between the two bars, about 21 points, is the part still open. It is not whether. It is how much.
Will El Niño bring more snow this winter?
For most of the country, the historical signal points the other way. NOAA’s snow composites are blunt about it: the below-average signal covers the Pacific Northwest, the northern Rockies, the Great Lakes, interior New England, western Canada and most of Alaska. The above-average signal is real but narrower.
| Region | Snow signal |
|---|---|
| Sierra and Southwest | Above |
| Southern Rockies | Above |
| High Plains | Above |
| Mid-Atlantic | Above |
| Southern Appalachians | Above |
| Pacific Northwest | Below |
| Northern Rockies | Below |
| Great Lakes | Below |
| Interior New England | Below |
| Alaska | Below |
The gains are concentrated where elevation keeps the extra moisture frozen. NOAA’s 1950-2009 analysis puts the largest positive departures in California, Nevada, Utah, Colorado, New Mexico and Arizona — the high country reached by the subtropical jet. A second, more consistent signal appears on the high plains of eastern Colorado, Nebraska, Kansas and northern Texas, and in the Mid-Atlantic and the southern Appalachians of West Virginia, Virginia and North Carolina.
The mechanism is the jet stream. El Niño pulls the subtropical jet north and east across the southern United States, which wets the southern tier, and weakens the northern storm track, which dries the north. Snow follows only where the wetter air is also cold enough.
Does a stronger El Niño mean more snow?
No, and NOAA says so directly. This is the single most misused idea in coverage of a record-breaking event: that a bigger number in the Pacific scales up into bigger impacts on land.
NOAA’s caveats, in its own framing, are four:
- Composites are retrospectives, not forecasts — average historical maps, not a prediction of this winter.
- El Niño “nudges the odds in favor of certain climate outcomes, but never ensures them”.
- A strong El Niño does not necessarily produce stronger impacts.
- The sample is small — roughly 20 events in the record — so confidence in any particular regional signal is limited, and other drivers can overshadow it.
The clearest illustration is the last very strong event. In 2015-16, Southern California stayed dry and the Pacific Northwest came in wet — close to the reverse of the textbook pattern, and the reverse of what most forecasts had said. A very strong El Niño was correctly forecast. The regional consequences were not.
Why can a wetter winter be a less snowy one?
Because El Niño’s southern tier is wetter partly by being milder, and a milder storm delivers rain. This is the trap in reading a precipitation outlook as a snow outlook. The same storm track that raises seasonal precipitation totals across the south can raise the freezing level with it, so the extra moisture arrives as rain at lower elevations and snow only above them.
It is why the gains in the table cluster in mountains and on the high plains rather than across the whole wet zone, and why a Sierra ski season and a Los Angeles winter can come out of the same pattern looking nothing alike.
Two further cautions carry over from any seasonal outlook. The biggest snow events do not come from the seasonal signal — a blocking pattern or a sudden stratospheric warming can deliver a month of snow in three days, and none of that is visible in August. And regional averages hide the extremes: 1982-83 was among the wettest US winters on record and also ran more than two degrees warmer than average nationally.
When does NOAA publish the actual snow forecast?
In the autumn, and it still will not be a snow map in the way people expect. The flagship Winter Outlook — the one with the regional temperature and precipitation maps that circulate every year — is issued by the Climate Prediction Center in the autumn, not in August. What exists now is the monthly ENSO discussion and the long-lead seasonal outlooks.
It is worth knowing that even that flagship product forecasts temperature and precipitation, not snowfall totals. Seasonal snowfall is not something NOAA issues as a national forecast map, which is precisely why articles promising “how much snow your state will get this winter” are working from something other than a NOAA forecast.
What this article cannot tell you
How much snow will fall where you live. Nothing here is a snowfall prediction, and we have not printed a total for any place this winter. What we have printed is the direction the historical record leans, region by region, with NOAA’s own warning that the record is a retrospective.
It also cannot tell you whether this winter behaves like the composite at all. Twenty events is a thin sample, the last very strong one inverted the expected west-coast pattern, and the drivers most likely to dominate any individual month — the Madden-Julian Oscillation, the polar vortex — are not predictable at this range.
For the temperature side of the same winter, and what past strong El Niño winters actually did to US temperatures, see our 2026/2027 US winter forecast . For what happens to the event itself after it peaks, we looked at the decay year .
How we verified this
The El Niño numbers are from NOAA’s Climate Prediction Center discussion of 13 August 2026, read on the CPC’s own page. The alert status is El Niño Advisory; the synopsis reads “El Niño is strengthening, with a greater than 90% chance of a very strong event during the Northern Hemisphere fall and winter 2026-27”; the Niño-3.4 index averaged +1.4 °C in July; subsurface anomalies reached +10.0 °C at depth; and October-December carries a “69% chance of a historic event that would exceed the strength of previous El Niño events dating back to 1950 (+2.5 °C or more)”.
The snow patterns are NOAA’s, not ours, and they are composites rather than a forecast. The regional signal comes from NOAA Climate.gov’s analysis of snowfall during El Niño winters — one piece using ERA5 reanalysis for 1959-2023, another covering 1950-2009. NOAA’s own wording is that “composites (average historical maps during El Niño) are retrospectives and they are not a forecast” and that El Niño “nudges the odds in favor of certain climate outcomes, but never ensures them”. We have not produced a snowfall forecast of our own and there is no snow total in this article for the coming winter.
The chart keeps percentages and degrees on separate scales. The two CPC probabilities are the only things plotted; the Niño-3.4 and subsurface temperatures sit in the note beneath, because per cent and degrees Celsius are different measurements and putting them on one axis would invite a false comparison. The “>90%” bar is a lower bound and is labelled as one.
We did not find verified city-level snowfall totals for past strong El Niño winters and so have not printed any. One widely cited resort-snowfall write-up refused an automated request. The regional direction here comes from NOAA’s composites; individual season totals for named places do not.
The flagship forecast does not exist yet. NOAA’s Winter Outlook, the product with the regional maps most people picture, is issued in the autumn. What exists in August is the ENSO discussion and the monthly long-lead seasonal outlooks, which is what this article uses and says so.
This is a companion to our winter forecast page, not a replacement. That page covers temperature, the ENSO record and what past strong El Niño winters did overall; this one covers snow specifically. Where they overlap, both use the same NOAA sources.