Donald Trump State Approval Ratings: Where He Stands in All 50 States
Update log (1)
- — Refreshed the whole 50-state table, both charts and every stamped date from the Civiqs reading of 19 August 2026 to the reading of 1 September 2026 (127,432 responses). The national 35/59 and the 11/39 split are unchanged, but the top of the ranking reordered: Wyoming fell from +21.6 to +12.3, putting North Dakota (+19.3) first and West Virginia (+17.2) second, and Nevada replaced Georgia as the weakest battleground. Also resolved a contradiction between the body text and the 22 August correction over whether Civiqs publishes per-state margins of error.
Civiqs is a rolling daily tracker, so every figure on this page decays continuously. Two states are inside a point of the zero line on the current reading — Tennessee at +0.8 and Utah at −0.1 — so the headline 11-positive/39-negative split can flip on any given day. Re-read the tracker at least fortnightly.
Everything else on the page is unaffected; the figures below still say when they were read.

- Trump’s job approval is net positive in 11 states and net negative in 39, on the Civiqs rolling tracker read on 19 August 2026. Nationally that tracker has him at 35% approve and 59% disapprove.
- Wyoming is his strongest state at +21.6 and Hawaii his weakest at −59.9 — a spread of 81.5 points. Utah is almost exactly even, at 45.4% each way.
- All seven 2024 battlegrounds are net negative: Arizona −12.7, North Carolina −15.9, Wisconsin −17.3, Pennsylvania −19.4, Nevada −21.4, Michigan −22.1 and Georgia −22.6.
- The decline is not confined to blue states. Wyoming has gone from +46 at the start of the second term to +21.6, South Dakota from +27 to +9.5, and Alabama from +24 to +5.9.
- Two well-known trackers disagree badly. Civiqs has Trump at net −24 nationally; Morning Consult, also polling registered voters and updated two days earlier, has him at net −11. Numbers from the two cannot be mixed.
Donald Trump’s job approval is net positive in 11 states and net negative in 39, according to the Civiqs rolling tracker read on 1 September 2026. Nationally that tracker has him at 35% approve, 59% disapprove. Where each state stands is one question; how far it has moved since inauguration is another, and we work that one through in the state-by-state trend since January .
Below is every state, the battleground picture, and — because it matters more than any single number here — why a different well-known tracker will tell you something noticeably different.
What are Trump’s approval ratings by state?
They range from +19.3 in North Dakota to −59.8 in Hawaii, a spread of 79.1 points. Net approval is the share who approve minus the share who disapprove, so a state at −20 is one where disapproval leads by twenty points.
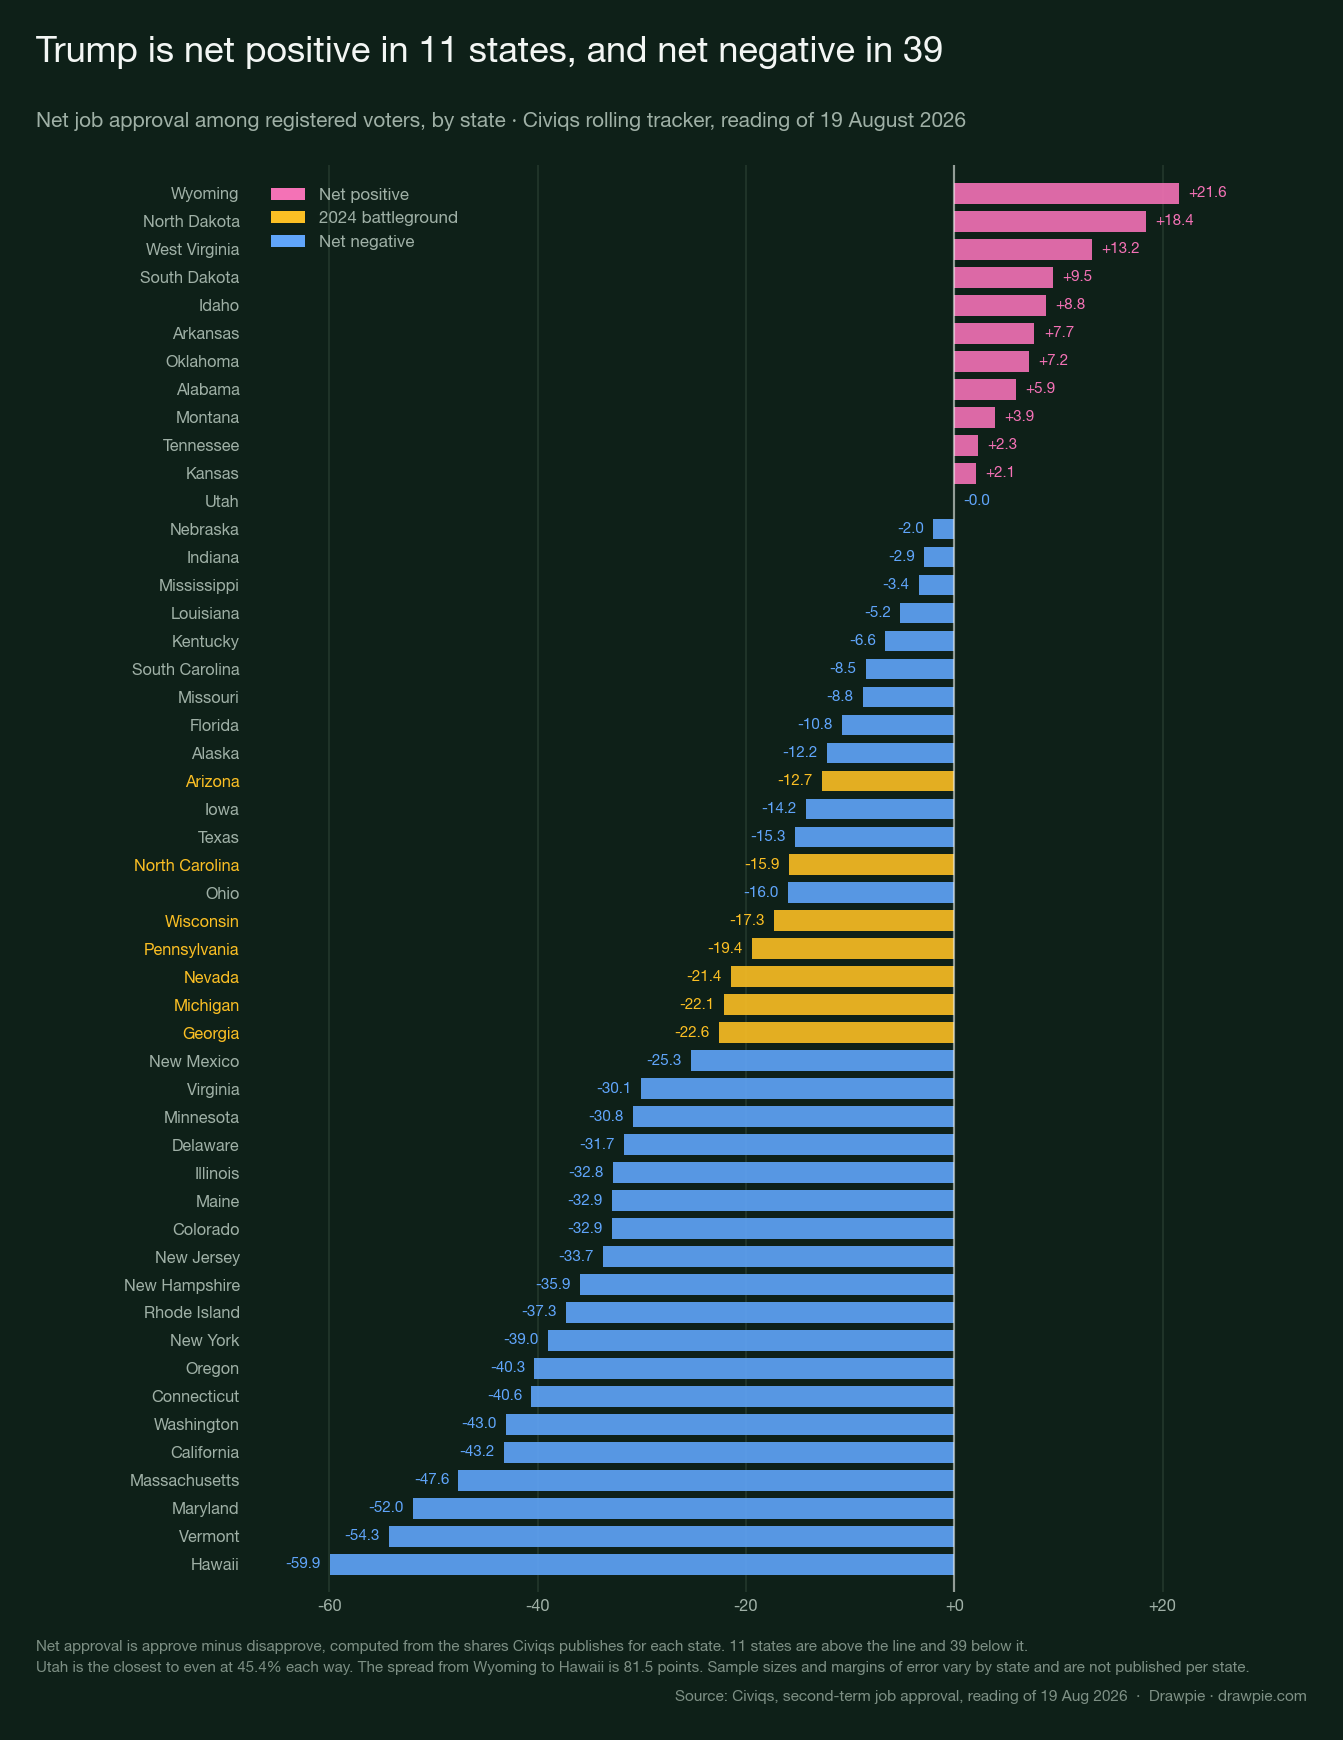
The single most useful thing on that chart is the zero line. Eleven states sit above it. Utah sits almost exactly on it, at 45.5% approve and 45.5% disapprove.
Which states approve of Trump the most?
North Dakota, narrowly. No state now sits above +20; North Dakota comes closest at +19.3, with West Virginia at +17.2 behind it.
| State | Approve | Disapprove | Net |
|---|---|---|---|
| North Dakota | 55.9% | 36.6% | +19.3 |
| West Virginia | 54.2% | 37.1% | +17.2 |
| Wyoming | 51.6% | 39.4% | +12.3 |
| South Dakota | 51.1% | 39.2% | +11.9 |
| Montana | 51.2% | 42.6% | +8.7 |
Six states have him above 50% approval outright — the five above plus Oklahoma, at 50.4%. The other five net-positive states are Idaho, Arkansas, Alabama, Kansas and Tennessee, ranging from +7.1 down to +0.8.
Which states disapprove of Trump the most?
Hawaii, where disapproval runs more than four to one — 77.9% disapprove against 18.0% who approve. The five weakest states are all reliably Democratic, and in every one of them disapproval is above 70%.
| State | Approve | Disapprove | Net |
|---|---|---|---|
| Hawaii | 18.0% | 77.9% | −59.9 |
| Vermont | 20.5% | 74.8% | −54.3 |
| Maryland | 21.1% | 73.1% | −52.0 |
| Massachusetts | 23.8% | 71.5% | −47.6 |
| California | 26.0% | 69.2% | −43.2 |
How is Trump doing in the 2024 battleground states?
He is net negative in all seven of them, and in six of the seven by more than fifteen points.
| Battleground | Approve | Disapprove | Net |
|---|---|---|---|
| North Carolina | 40.3% | 53.6% | −13.4 |
| Arizona | 38.8% | 54.5% | −15.7 |
| Wisconsin | 39.0% | 55.4% | −16.4 |
| Pennsylvania | 37.3% | 55.6% | −18.3 |
| Michigan | 36.7% | 57.0% | −20.3 |
| Georgia | 34.6% | 57.9% | −23.3 |
| Nevada | 32.8% | 60.4% | −27.6 |
For context on what that does and does not imply for November, see our 2026 midterm House forecast , which treats presidential approval as one input among several rather than as a result.
Has Trump’s support fallen in Republican states too?
Yes, and by more than in most of the country’s Democratic strongholds — because there was more room to fall.
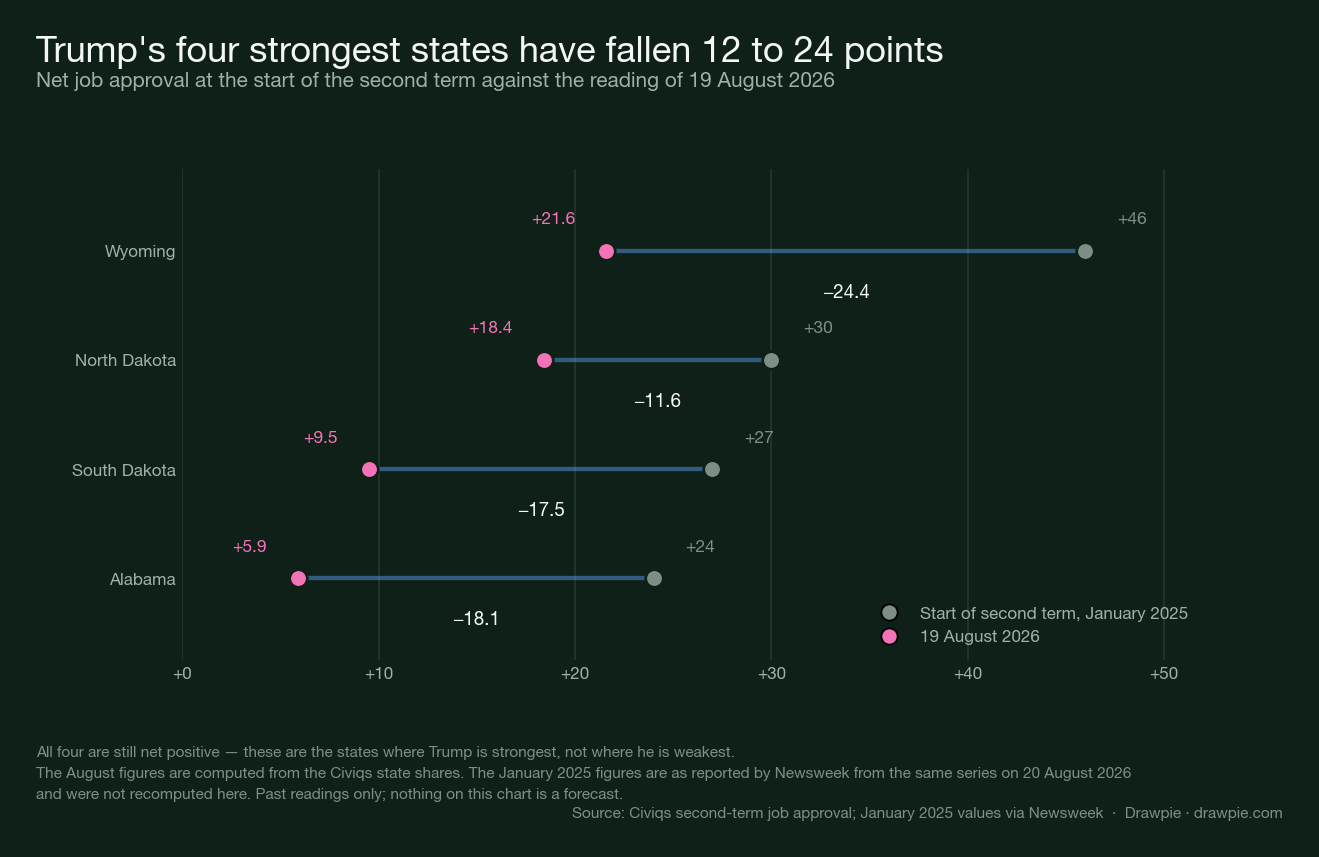
All four of those states remain net positive. That is the point: these are his best results, and they have still moved 11 to 34 points.
Two states have crossed the line during the term. Indiana went negative in late June and now sits at −0.7. Mississippi crossed in May and is at −5.6. Elsewhere in reliably Republican territory the numbers are lower than the 2024 results would suggest: Texas is at −18.2, Iowa −15.5, Florida −10.9 and Alaska −10.9.
Why do different Trump approval trackers disagree?
Because they are different surveys, and the gap is large enough to change the story.
| Source | Reading | Approve | Disapprove | Net |
|---|---|---|---|---|
| Civiqs | 19 Aug 2026 | 35% | 59% | −24 |
| Morning Consult | 17 Aug 2026 | 43% | 54% | −11 |
| Pew Research Center | Late Apr 2026 | 34% | — | — |
Civiqs and Morning Consult were read two days apart, both survey registered voters, and they differ by 13 points of net approval. Pew, which surveys all adults on a probability-based panel, had approval at 34% in late April.
There is no trick to reconcile these. Panels are recruited differently, weighted differently, and roll responses over different windows; house effects of this size are ordinary in polling and are the reason professionals compare a tracker to itself over time rather than to a rival.
The practical rule for a reader is simple: never mix them. A state figure from one house and a national figure from another do not belong in the same sentence, and a state that looks like it has moved may only have changed sources.
Is the Morning Consult state map still current?
No. This is worth knowing because it is the other state-by-state map that circulates widely.
Morning Consult’s “Trump Approval Rating Polls: All 50 States” page is stamped “Updated on Feb 9, 2026”, and its own methodology line reads “Surveys conducted September–November 2025”. Its headline finding — that Trump’s net approval is above water in 22 states, down from 24, with Alaska and Iowa the most recent to turn negative — therefore describes autumn 2025, roughly ten months before this article.
The page also says it updates monthly, which it has not. Morning Consult’s national tracker is the fresher of its two, last updated 17 August 2026, but it carries no state breakdown at all — and despite describing itself as weekly it has not moved in over a fortnight.
So if you see a 50-state Trump map, check two things before quoting it: whose data it is, and what the fieldwork dates are.
What do these numbers not tell you?
How votes will fall. Approval is not a ballot test. A voter who disapproves of a president does not necessarily vote against that president’s party, and turnout in a midterm is a separate question again.
How precise any single state is. Civiqs does not publish per-state sample sizes or margins of error. The big states rest on far more interviews than the small ones, so treat two- and three-point gaps between neighbours in the table as noise rather than as ranking.
Anything about tomorrow. This is a rolling tracker and it moves. Every figure here is the reading of 19 August 2026 and is stamped that way for a reason.
The full 50-state table
Ranked by net approval. Civiqs second-term job approval among registered voters, reading of 19 August 2026.
| # | State | Approve | Disapprove | Net |
|---|---|---|---|---|
| 1 | North Dakota | 55.9% | 36.6% | +19.3 |
| 2 | West Virginia | 54.2% | 37.1% | +17.2 |
| 3 | Wyoming | 51.6% | 39.4% | +12.3 |
| 4 | South Dakota | 51.1% | 39.2% | +11.9 |
| 5 | Montana | 51.2% | 42.6% | +8.7 |
| 6 | Oklahoma | 50.4% | 42.1% | +8.3 |
| 7 | Idaho | 49.9% | 42.8% | +7.1 |
| 8 | Arkansas | 49.9% | 43.4% | +6.6 |
| 9 | Alabama | 48.3% | 42.2% | +6.1 |
| 10 | Kansas | 48.3% | 44.5% | +3.8 |
| 11 | Tennessee | 46.2% | 45.4% | +0.8 |
| 12 | Utah | 45.5% | 45.5% | -0.1 |
| 13 | Indiana | 46.3% | 46.9% | -0.7 |
| 14 | Nebraska | 45.1% | 46.9% | -1.8 |
| 15 | Louisiana | 44.0% | 48.0% | -4.0 |
| 16 | Mississippi | 43.3% | 48.9% | -5.6 |
| 17 | Kentucky | 39.8% | 49.1% | -9.3 |
| 18 | South Carolina | 41.6% | 51.0% | -9.5 |
| 19 | Missouri | 41.4% | 51.9% | -10.5 |
| 20 | Alaska | 41.1% | 52.0% | -10.9 |
| 21 | Florida | 42.0% | 52.9% | -10.9 |
| 22 | North Carolina | 40.3% | 53.6% | -13.4 |
| 23 | Iowa | 37.3% | 52.8% | -15.5 |
| 24 | Arizona | 38.8% | 54.5% | -15.7 |
| 25 | Wisconsin | 39.0% | 55.4% | -16.4 |
| 26 | Ohio | 37.6% | 55.7% | -18.1 |
| 27 | Texas | 37.6% | 55.9% | -18.2 |
| 28 | Pennsylvania | 37.3% | 55.6% | -18.3 |
| 29 | Michigan | 36.7% | 57.0% | -20.3 |
| 30 | Georgia | 34.6% | 57.9% | -23.3 |
| 31 | Nevada | 32.8% | 60.4% | -27.6 |
| 32 | New Mexico | 32.8% | 61.6% | -28.8 |
| 33 | Virginia | 32.4% | 62.1% | -29.7 |
| 34 | Minnesota | 30.7% | 61.5% | -30.8 |
| 35 | Delaware | 30.4% | 63.8% | -33.4 |
| 36 | Colorado | 30.1% | 64.6% | -34.5 |
| 37 | Maine | 29.1% | 64.3% | -35.2 |
| 38 | New Hampshire | 28.6% | 64.4% | -35.8 |
| 39 | New Jersey | 29.7% | 65.7% | -35.9 |
| 40 | Illinois | 29.4% | 65.5% | -36.1 |
| 41 | Washington | 27.7% | 66.5% | -38.8 |
| 42 | New York | 27.7% | 66.7% | -39.1 |
| 43 | Rhode Island | 27.0% | 66.5% | -39.6 |
| 44 | Oregon | 27.5% | 67.4% | -39.9 |
| 45 | Connecticut | 27.1% | 67.5% | -40.4 |
| 46 | California | 25.1% | 70.1% | -45.0 |
| 47 | Massachusetts | 24.5% | 70.7% | -46.2 |
| 48 | Maryland | 21.7% | 71.9% | -50.2 |
| 49 | Vermont | 20.1% | 74.4% | -54.3 |
| 50 | Hawaii | 17.8% | 77.6% | -59.8 |
Sources
| Source | Used for |
|---|---|
| Civiqs — Donald Trump job approval, second term | Every state figure on this page, computed from the approve and disapprove shares the page publishes; the national 35/59; the registered-voter sample and the 20 January 2025 to 19 August 2026 fieldwork range |
| Newsweek, 20 August 2026 | Independent cross-check of 19 state figures and the 124,759 sample size, and the start-of-term values for Wyoming, North Dakota, South Dakota and Alabama |
| Morning Consult — state-by-state tracker | The “Updated on Feb 9, 2026” stamp, the September–November 2025 fieldwork window, and the 22-states finding that belongs to that period |
| Morning Consult — national tracker | The current national reading of 43% approve and 54% disapprove on 17 August 2026 |
| Drawpie — 2026 midterm House forecast | The Pew approval trend and the treatment of approval as a forecasting input |
How we verified this
🔴 The 50-state figures were computed here from the source’s own data, not copied from a news report. Civiqs embeds its state breakdown in its results page as JSON — {"demographic":"Hawaii","Approve":0.18,"Disapprove":0.7791,...} — and every net figure on this page is approve minus disapprove, calculated from those shares. The snapshot is committed to the repository as data/civiqs-trump-state-approval-2026-09-01.json so the charts stay reproducible; Civiqs is a rolling daily tracker, and fetching live would silently break the match between the charts and the text.
✅ The snapshot was cross-validated against an independent reading of the same data. Newsweek published its own account of this Civiqs series on 20 August 2026, quoting a sample of 124,759 responses — the exact figure on the Civiqs page at that date — and 19 individual state numbers, all of which matched the 19 August snapshot after rounding. That cross-check validates the method used here; it does not validate the figures now in the table, which come from a later reading of the same tracker (1 September 2026, 127,432 responses).
⚠️ Civiqs failed a control test and is used anyway, for a reason stated here. An invented question path on civiqs.com returns HTTP 200, so a successful response proves nothing about whether a page is real. This source is judged on content instead: the page identifies itself as the second-term question, gives a fieldwork range ending 19 August 2026, and its embedded numbers reproduce an independent outlet’s published figures.
🔴 The other well-known state map is six months out of date, and most coverage does not say so. Morning Consult’s “Trump Approval Rating Polls: All 50 States” tracker is stamped “Updated on Feb 9, 2026” and its fieldwork is “Surveys conducted September–November 2025” — despite the page also promising monthly updates. Its headline finding, that Trump is above water in 22 states, describes autumn 2025 and is not comparable with anything on this page. A search summary presented that tracker to us as current July–August 2026 data; opening the page showed it was not.
⚠️ The two trackers disagree by 13 points and this page does not adjudicate. Civiqs has net −24 on 19 August; Morning Consult’s weekly national tracker has 43% approve and 54% disapprove, net −11, on 17 August. Both sample registered voters. Different panels, weighting and rolling windows produce different levels, and a third source, Pew Research Center, had approval at 34% among all adults in late April. No attempt is made here to say which is right — only that figures from different houses must not be combined.
Per-state sample sizes are not published; a per-state uncertainty is. Civiqs gives no interview count by state. It does publish a confidence band for every state inside the same data, and those bands are wide: about 10 points in the largest states, close to 20 in the smallest. So a gap of two or three points between adjacent states in the table below should not be read as a real difference, and in the small states a gap several times that size should not either. Corrected 22 August 2026 — this paragraph previously said no margin of error was published at all, which was wrong; see the state-by-state trend for the bands and what they do to the map.
This page contains no forecast, no seat projection and no betting or prediction-market number of any kind. It reports survey readings that have already been taken.