CPI Inflation Report August 2026: What It Means for Fed Rates, Stocks and Bonds
Update log (1)
- — The July CPI release was published by the BLS at 08:30 ET on 12 August 2026. Figures here are from that release. The August CPI report is scheduled for 11 September and July PCE for 3 September.

- Headline CPI rose 0.1% in July and 3.4% over the year, down from 3.5% in the 12 months to June. Core — all items less food and energy — rose 0.2% on the month and 2.5% on the year, its own step down from 2.6%.
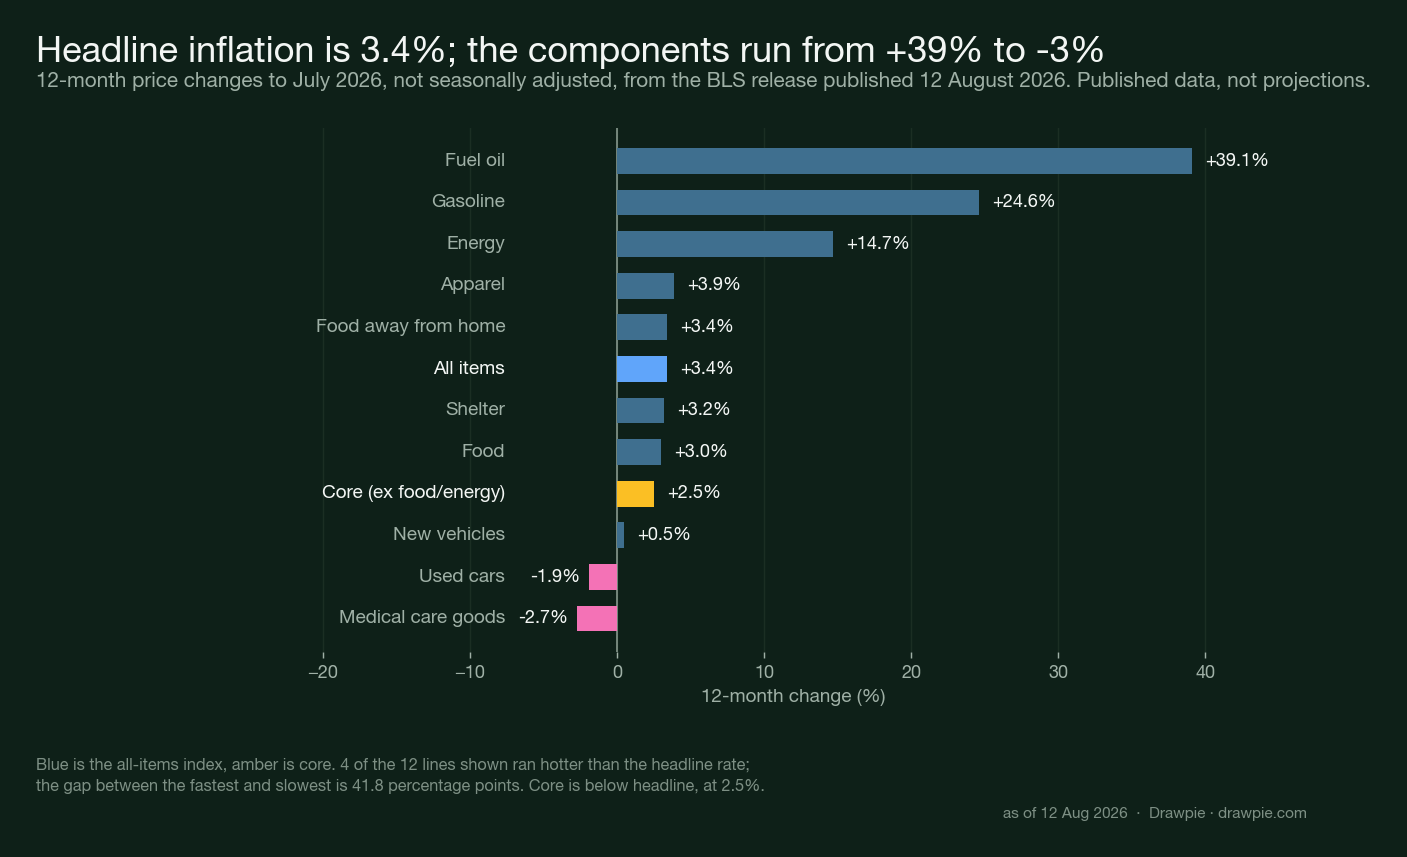
- Core is running below headline, and the gap is energy. The energy index fell 1.5% in July but is still up 14.7% over 12 months, with gasoline up 24.6% and fuel oil up 39.1%. Strip food and energy out and the 12-month rate is 2.5%.
- Shelter did most of the monthly work while barely moving. It rose just 0.1% but accounted for roughly two-thirds of the entire monthly increase, because so much else fell.
- CPI is not the index the Fed’s 2% target is defined on — that is the headline PCE price index, and July’s PCE does not publish until 3 September. Before the FOMC meets on 15–16 September it will also have August CPI, due 11 September.
The July CPI report, published on 12 August 2026, showed prices up 0.1% on the month and 3.4% over the year. Core inflation — all items less food and energy — rose 0.2% on the month and 2.5% on the year.
Both 12-month rates came down a notch: headline from 3.5%, core from 2.6%.
This article does not forecast inflation, rates or markets, and carries no one else’s price target. What follows is what the release says, what the Fed’s target actually measures, and the dates already on the calendar.
What did the July CPI report show?
Headline CPI +0.1% on the month, +3.4% on the year; core +0.2% and +2.5%. The monthly gain follows a 0.4% fall in June.
| Measure | Monthly | 12-month |
|---|---|---|
| All items | +0.1% | +3.4% |
| Core | +0.2% | +2.5% |
| Energy | −1.5% | +14.7% |
| Food | +0.1% | +3.0% |
| Shelter | +0.1% | +3.2% |
The BLS notes that shelter accounted for roughly two-thirds of the monthly all-items increase despite rising only 0.1% — a reflection of how much else was flat or falling.
Indexes that rose over the month included medical care, airline fares, communication, education and recreation. Motor vehicle insurance was among those that fell.
Why is core inflation below the headline rate?
Because energy is doing the opposite of what it did in June, and it is enormous in both directions. The 12-month picture makes the spread obvious.
| Component | 12-month |
|---|---|
| Fuel oil | +39.1% |
| Gasoline | +24.6% |
| Energy | +14.7% |
| All items | +3.4% |
| Core | +2.5% |
| Used cars | −1.9% |
| Medical goods | −2.7% |
A single “3.4% inflation” number covers components running from +39.1% to −2.7% — a spread of nearly 42 percentage points. Core sits below the headline rate precisely because the two fastest-moving categories are the ones it excludes.
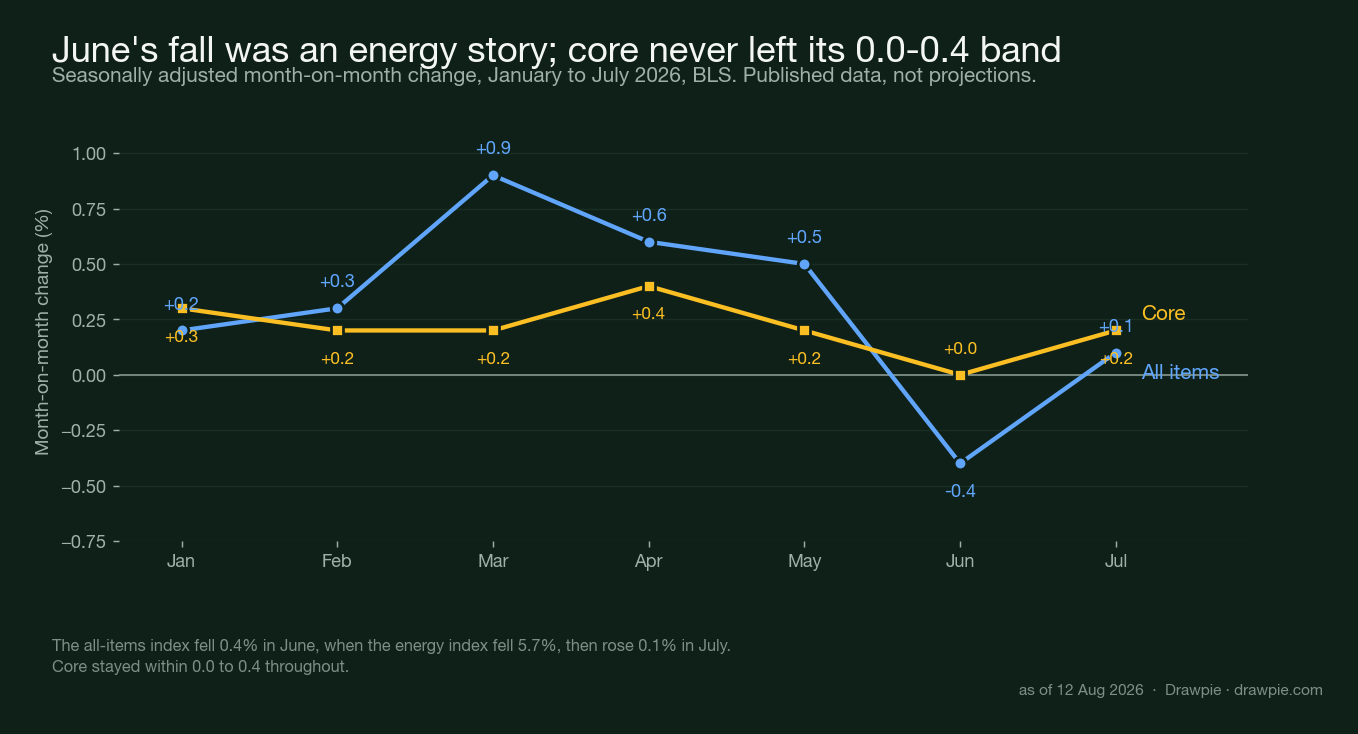
The monthly series shows the same thing from the other side:
| Month | All items | Core |
|---|---|---|
| May | +0.5% | +0.2% |
| Jun | −0.4% | 0.0% |
| Jul | +0.1% | +0.2% |
June’s fall was an energy event — the energy index dropped 5.7% that month. Core never left a 0.0 to 0.4 band across the whole seven months. Almost all of the volatility in the headline number came from outside core.
Is CPI the number the Fed targets?
No. The FOMC’s 2% goal is defined on the headline PCE price index, which is produced by a different agency, on a different schedule, with a different basket weighting.
This matters for reading any CPI day. A CPI print is the most-watched inflation number and the earliest to arrive, but it is not the series the target is written against. Our July FOMC breakdown sets out the same distinction alongside the decision itself.
Two practical consequences:
- CPI arrives first. July CPI published 12 August; July PCE does not publish until 3 September.
- They can move differently, because their weights and their treatment of health care and housing differ.
What does this mean for Fed rates?
The honest answer is that it is one input into a meeting that has not happened, and this article will not tell you the outcome. What can be stated is the sequence.
The FOMC held its target range at 3.50–3.75% on 29 July 2026, with three officials dissenting in favour of a rise. The next meeting is 15–16 September, and it is one of the meetings that comes with projection materials.
| Date | Event |
|---|---|
| 3 Sep | July PCE (BEA) |
| 11 Sep | August CPI (BLS) |
| 15–16 Sep | FOMC, with projections |
So the committee will see one more PCE report and one more CPI report before it decides anything. Both of those are already scheduled, and neither has happened.
What does it mean for stocks and bonds?
The mechanism is established; the direction is not something this article will give you. No index level or yield appears here, for a specific reason: the release landed at 08:30 ET and markets were open as this was written, so any figure would be an intraday snapshot with a short shelf life.
What is worth understanding is the chain rather than the outcome. Inflation data feeds expectations about the policy rate; the policy rate path feeds the short end of the Treasury curve; the curve feeds discount rates used to value equities, and directly reprices existing bonds. That transmission is well documented and it runs in both directions depending on the surprise.
Which is exactly why the useful question is not “what happens next” but “what would change the picture” — and that is a list of scheduled data, not a prediction.
What should you watch from here?
Four things, all of them dated.
| Watch | Why it matters |
|---|---|
| Energy base effects | Drove both June and July |
| Shelter, 3.2% | Largest single weight |
| Core band, 0.0–0.4 | Where the stability is |
| PCE on 3 Sep | The Fed’s actual target |
Energy base effects. Energy is +14.7% over 12 months while falling 1.5% in the month. Those two facts are not in tension — they say the level is high relative to a year ago and moving down now. The 12-month figure will keep reflecting last year’s prices until they roll out of the window.
Shelter. At +3.2% over the year it is above core and it carries the largest weight, which is why a 0.1% monthly move still accounted for two-thirds of the monthly increase.
Whether core stays in its band. Seven consecutive months between 0.0% and 0.4% is the most stable thing in this release.
The PCE print on 3 September, because that is the index the target is defined on.
Bottom line
Headline 3.4%, core 2.5%, both a notch lower than the month before. Energy is the reason the two numbers differ, and shelter is the reason the monthly figure moved at all.
Before the Fed meets on 15–16 September it will see July PCE on 3 September and August CPI on 11 September. This article does not forecast any of them, and does not carry anyone else’s forecast either.
Sources
Read on 12 August 2026.
| Source | What it supports here |
|---|---|
| BLS: Consumer Price Index Summary, 2026 M07 | Every CPI figure: the 0.1% monthly and 3.4% annual headline, 0.2% and 2.5% core, the shelter two-thirds statement, the energy, food, gasoline and fuel oil changes, the monthly series in Table A, and the components that rose and fell |
| BLS: CPI release schedule | July 2026 data released 12 August and August 2026 data due 11 September, both at 08:30 |
| BEA: news release schedule | Personal Income and Outlays for July 2026 scheduled for 3 September 2026 |
| Federal Reserve: FOMC calendar | The 28–29 July meeting and the 15–16 September meeting, and that September is a projection-materials meeting |
How we verified this
🚫 This article contains no forecast and no third-party price target. It does not say where inflation, rates, stocks or bonds go next, and it quotes no bank or analyst projection. Every number in it is published data or a scheduled date. That is a standing rule for finance coverage here, not a disclaimer attached to this piece.
Every CPI figure comes from the BLS release itself, read on the day. The release is titled “Consumer Price Index Summary — 2026 M07 Results” and covers July 2026 data. Month-on-month figures are seasonally adjusted; 12-month figures are not, which is how the BLS presents them, and the article says which is which each time rather than mixing them.
🔴 CPI is not the Fed’s target measure, and that distinction is load-bearing here. The FOMC’s 2% goal is defined on the headline PCE price index, not on CPI and not on core. Our July FOMC piece states the same thing, and this article is consistent with it. Any piece that treats a CPI print as “the Fed’s inflation number” is describing a different index from the one in the Fed’s own statement.
Release dates were taken from the agencies’ schedule pages, not inferred from the monthly rhythm. The BLS CPI schedule lists July 2026 data on 12 August and August 2026 data on 11 September, both 08:30. BEA’s release schedule lists Personal Income and Outlays for July 2026 on 3 September — worth checking rather than assuming, because that date has moved since we last recorded it. The FOMC calendar on federalreserve.gov lists 15–16 September as the next meeting, marked as one with projection materials.
No market prices appear in this article. The release landed at 08:30 ET and US markets were still trading when this was written, so any index or yield level quoted here would be an intraday number that could be stale within the hour. Rather than publish a moving figure, the article describes the transmission mechanism — which is established — and leaves the levels out entirely.
This updates one line in our August monthly round-up. That piece, published 9 August, flagged that “CPI lands on 12 August” and carried the 12-month rate as of the June release. The July release supersedes that figure: 3.4% for the 12 months to July, against 3.5% to June.
A regex sweep was run over the finished text for forecast language — will rise, will fall, expect, forecast, poised, likely to, price target, outlook, undervalued, bullish, bearish. The only matches are inside explicit negations in this panel.