Canada Winter Storm Outlook 2026–27: Snow, Cold, El Niño & Regions at Risk
The next NOAA CPC ENSO diagnostic discussion is scheduled for 10 September 2026 and supersedes the El Nino reading here.
Everything else on the page is unaffected; the figures below still say when they were read.

- Of 30 city-winter combinations — six Canadian cities across the five strongest El Niño winters since 1980 — 28 came in milder than that city’s own long-run December-to-February average. The two exceptions were Montreal and Halifax, both in the same winter.
- Winnipeg is the extreme case: December to February ran 7.2°C above its long-run average in both 1997–98 and 2023–24, and never less than 4.1°C above.
- Snowfall does not follow the temperature signal. Vancouver recorded no measurable snow at all in two of the five, while Halifax finished at or above its average in four of five.
- None of this is a forecast. It is a record of five past winters, and five is a small number — the article says what it cannot tell you as clearly as what it can.
There is no Canadian winter forecast on this page, because there is no published one that can be checked. What there is instead is a measurement: what the five strongest El Niño winters since 1980 actually did at six Canadian cities, computed from Environment Canada’s own station records.
That turns out to be a more useful thing to have than an outlook, because the answer is unusually consistent — and because the place it stops being consistent is the interesting part.
Is there an official Canadian winter forecast for 2026–27?
Not in a form anyone can quote. Environment and Climate Change Canada does run a seasonal prediction system and does publish its output, but that output is a set of probability maps: coloured images, with no text explaining what they say.
That is a real limitation rather than an oversight on our part. Reading “40% chance of above-normal temperatures in southern Ontario” off a colour ramp is guesswork, and a reader could not check it. So this page does not attempt it. What follows is history, measured rather than interpreted.
What did past strong El Niño winters do in Canada?
Twenty-eight of thirty city-winters came in milder than normal, and the two that did not were in the same winter as each other. Six cities, five winters, one number each — the anomaly against that city’s own long-run December-to-February average.
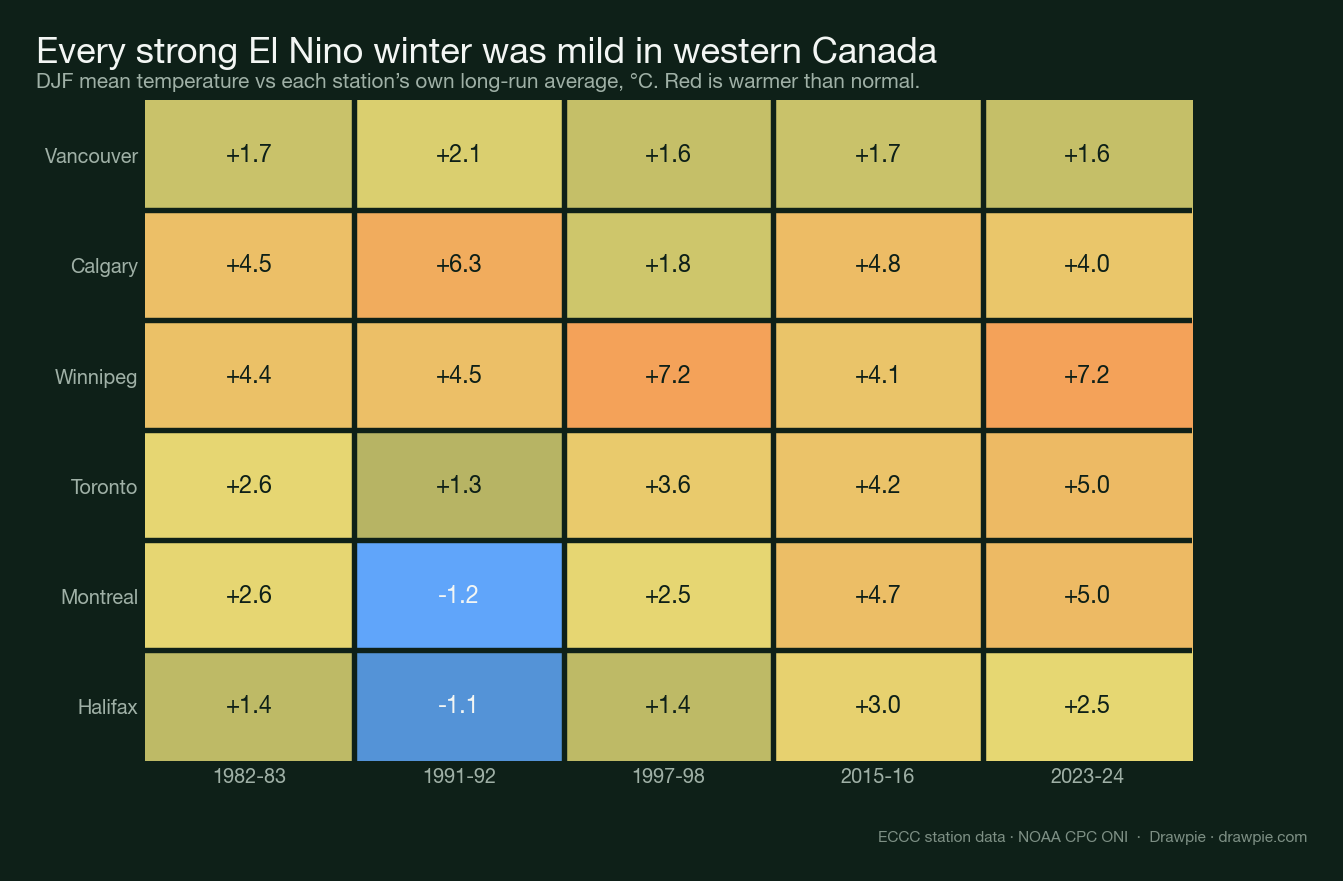
The five winters are 1982–83, 1991–92, 1997–98, 2015–16 and 2023–24. Those are not a hand-picked set: they are every winter since 1980 whose December-to-February value on NOAA’s Oceanic Niño Index reached +1.5, which is the conventional threshold for a strong event.
Which regions ran warmest?
The prairies, by a wide margin, and Vancouver by the narrowest. The two ends of the country behave in almost opposite ways, and it is not the way most people would guess.
Winnipeg is the extreme: +7.2°C against its long-run average in both 1997–98 and 2023–24, and never less than +4.1°C. Calgary follows a similar pattern, ranging from +1.8°C to +6.3°C. On a base December-to-February average of −15.4°C, Winnipeg’s mild El Niño winters are still cold in absolute terms — but seven degrees is the difference between a hard prairie winter and a manageable one.
Vancouver does the opposite. Its anomalies land between +1.6°C and +2.1°C in all five winters — the tightest range of any city here. Vancouver’s El Niño signal is small but it is the most reliable one in the table.
Central and eastern Canada sit in between and get less consistent the further east you go. Toronto ran between +1.3°C and +5.0°C, Montreal between −1.2°C and +5.0°C, Halifax between −1.1°C and +3.0°C.
What happened to snowfall?
Snow splits the country, and it does not simply follow the temperature. A milder winter is not automatically a less snowy one, and Canada’s coasts prove it in opposite directions.
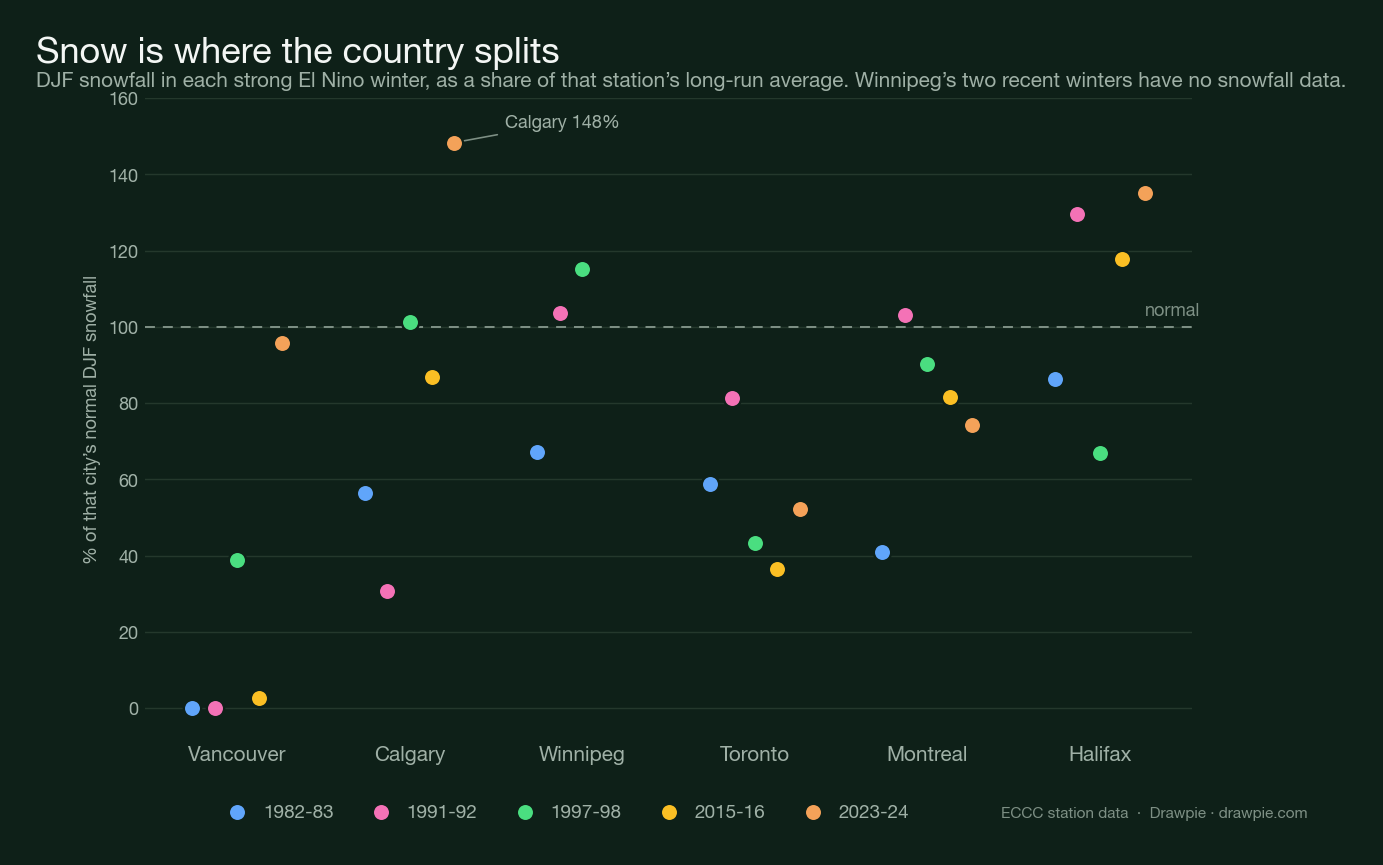
Vancouver is the headline. It recorded no measurable snow at all between December and February in 1982–83 and in 1991–92, and one centimetre in 2015–16, against a long-run average of 39.5 cm. For scale: across the 74 winters in that station’s record with a complete snow series, exactly five had no measurable snow — and two of those five were strong El Niño winters, out of the three the record covers. Three is far too small a number to build a rule on, but it is what the record contains.
Halifax runs the other way. Four of its five El Niño winters finished at or above its long-run average of 162 cm, reaching 219 cm in 2023–24. A milder Atlantic winter can be a wetter one, and on that coast the extra moisture still arrives as snow.
Toronto sits with Vancouver rather than Halifax: all five winters below average, three of them under half. Calgary is mixed, and its 2023–24 winter reached 148% of normal — the single snowiest El Niño winter in this table relative to its own baseline, in the same year Winnipeg was 7.2°C above average.
Winnipeg’s two most recent winters have no snowfall figure at all here, because the automated station that replaced the old airport site records temperature but not snow.
What counts as a normal Canadian winter?
It depends enormously on where you are — Winnipeg’s average winter is more than nineteen degrees colder than Vancouver’s, and Halifax gets four times the snow Vancouver does. These are the baselines every anomaly above is measured against, each taken from that city’s own station record.
| City | Avg °C | Snow | Record |
|---|---|---|---|
| Vancouver | 3.9°C | 40 cm | 1937–2013 |
| Calgary | −8.2°C | 47 cm | 1881–2012 |
| Winnipeg | −15.4°C | 63 cm | 1938–2007 |
| Toronto | −4.8°C | 87 cm | 1937–2013 |
| Montreal | −8.1°C | 155 cm | 1941–2013 |
| Halifax | −4.6°C | 162 cm | 1953–2012 |
Two things are worth noticing before reading the anomalies. The reference periods are not the same length, because each station’s record is not the same length — Calgary’s runs back to 1881, Halifax’s only to 1953 — so a “normal” here means normal for that station, not a common national baseline.
And the snowfall column explains why the second chart is drawn as percentages rather than centimetres. A 40 cm swing means almost nothing in Montreal and would be more than a whole winter’s worth in Vancouver.
Why did Montreal and Halifax go the other way in 1991–92?
Because that winter was the weakest El Niño of the five, and the eastern signal is the first thing to break. Its December-to-February index value was +1.54, barely over the strong threshold; the other four ran from +1.84 to +2.50.
Montreal came in 1.2°C below its average that winter and Halifax 1.1°C below. Every other city still ran warm — Calgary was +6.3°C in the same winter, its largest anomaly of the five. So the pattern did not fail everywhere at once; it failed at the eastern end while holding at the western end.
That is the practical shape of the whole table. The further west you are, the more reliably these winters ran mild. The further east, the more the outcome depended on how strong the event actually was.
Where is El Niño right now?
Climbing, and just short of the strong threshold. NOAA’s index has risen every season since the spring: −0.39 in December–February, then −0.21, +0.11, +0.46, +0.95, and +1.39 for May–June–July 2026, the most recent season on file.
Whether it reaches +1.5 by mid-winter, and whether it stays there, is not something this page will guess at. What can be said is that the five winters measured above all sat at +1.54 or higher, and the current value is below that.
What does this actually tell you about the coming winter?
Less than a forecast would, and more than most forecasts can prove. The honest summary is that in five out of five strong El Niño winters, western and central Canada were milder than usual, with the prairies mildest of all; that Vancouver’s mild signal was small but never absent; and that snowfall behaved differently on each coast.
What it does not tell you is what happens next. Five events is a small sample, the two most recent winters were measured on replacement instruments, and the current event has not yet reached the strength of any of them. A sixth winter is under no obligation to resemble the first five.
If you want the American half of the picture, our NOAA winter forecast explainer covers what the US outlook actually says and when the next update lands.
How we verified this
This page quotes no Canadian seasonal forecast, because there is not one to quote in a form that can be checked. Environment and Climate Change Canada publishes its seasonal outlook as probability maps — GIF images with no accompanying text — and reading values off a colour map would not be verifiable by a reader or by us. Rather than paraphrase a picture, the page measures what past El Niño winters actually did.
✅ Which winters count as strong El Niño was decided by NOAA’s file, not by hand. The build script reads CPC’s Oceanic Niño Index series, selects every winter since 1980 with a December–February value of at least +1.5, and asserts that the resulting list matches the five used here. If the file changed, the script would refuse to run rather than quietly produce different numbers.
✅ Every temperature and snowfall figure is computed from Environment Canada station observations, downloaded from its bulk climate data service. Thirty of thirty city-winters resolved for temperature and twenty-eight of thirty for snowfall.
🔴 A data defect nearly put a false claim on this page, and it is worth describing. Winnipeg’s 2015–16 and 2023–24 snowfall initially came out as zero. The station that replaced the old airport site, Winnipeg A CS, reports a temperature for every winter day and a snowfall value for none of them — so summing its blank fields produced a zero that read exactly like an observation. Published as it stood, this page would have said Winnipeg had no snow in two winters, which is plainly false. The calculation now returns snowfall only when at least 80 of roughly 90 winter days carry a value, and a separate check refuses to draw the chart if any sub-5 cm total belongs to a city other than Vancouver. Those two cells are reported as missing.
✅ Vancouver’s zeros were then checked to make sure they were not the same bug. They are not: the raw monthly fields read “0.0” rather than being blank. For context, across the 74 winters in that station’s record with a complete snow series, exactly five had no measurable December-to-February snow at all.
⚠️ Three caveats sit on the comparison and none of them is hidden. Five events is a small sample. The three older winters come from one station per city and the two recent ones from its replacement at the same airport, with no correction for instrument or siting differences. And each city is compared with its own station’s full record, so the reference period differs — 1881–2012 at Calgary, 1953–2012 at Halifax — rather than a single common baseline.
No forecast appears anywhere on this page. Nothing here predicts temperature, snowfall or storms for the coming winter, and the ENSO figure quoted below is dated to the season it describes.