Bitcoin Price August 2026: Biggest Weekly Rally of the Year
Update log (1)
- — Bitcoin kept going after this page first ran. It traded around $76,600 at 13:38 UTC on 21 August, reached $79,511.10 in the preceding 24 hours, and reclaimed $69,000 on 20 August for the first time since 2 June. A correction as well: the first version of this page described the July FOMC minutes as the only scheduled event of 19 August. They were not — the Treasury announced larger long-end bond buybacks the same day, and the SEC had proposed a crypto rule the day before.

- Bitcoin traded around $76,590 at 13:38 UTC on 21 August 2026, having reached $79,511.10 in the previous 24 hours. Over the seven completed days to 21 August it gained about 15%, the largest seven-day run in the past year, ahead of the 11.6% week that ended on 5 October 2025.
- It is still not a record. Bitcoin is about 39% below its all-time high of $126,080, set on 6 October 2025, and about 12% below where it started 2026. Returning to that high from here would take a further gain of roughly 65%.
- Three dated official events sit inside the run. The SEC proposed Regulation Crypto Assets on 18 August, the Treasury said on 19 August it would at least double its long-end buyback operations from 9 September, and the July FOMC minutes were released on 19 August. The minutes were the hawkish one.
- The most-quoted number about this rally cannot be checked. Figures for short liquidations and spot-ETF flows come from feeds that are either paywalled or blocked to us, so this page prints neither, and says so rather than repeating them.
Bitcoin traded around $76,590 at 13:38 UTC on 21 August 2026, after reaching $79,511.10 in the previous 24 hours. Over the seven completed days to 21 August it has gained about 15% — the largest seven-day run of the past year.
It is also about 39% below its all-time high.
Both of those sentences describe the same asset in the same hour, and an article that gives you only one of them is not telling you what happened.
This article does not forecast the bitcoin price and does not carry anyone else’s price target. It reports what has already happened and is explicit about what cannot be known.
How high is bitcoin right now?
Around $76,590, after a 24-hour session that ran as high as $79,511.
| Reading | Value | Source, timestamped |
|---|---|---|
| Spot price | $76,576.70 | Coinbase, 13:38 UTC 21 Aug |
| Spot price | $76,599.90 | Kraken, 13:38 UTC 21 Aug |
| Spot price | $76,463 | CoinGecko aggregate, 13:36 UTC 21 Aug |
| 24-hour high | $79,511.10 | Kraken |
| 24-hour low | $71,224.20 | Kraken |
| 24-hour open | $73,001.20 | Kraken |
| 24-hour change | about +4.9% | computed from the open above |
The two exchange quotes are $23 apart, or 0.03%. CoinGecko’s cross-venue aggregate, read two minutes earlier, sits $114 lower — which on a day with an 11.6% range between low and high is less a disagreement than a demonstration. Bitcoin has no closing price. Every number on this page therefore carries the minute it was read, and a number without one is not a price, it is an anecdote.
Is this a record?
No. Bitcoin is roughly 39% below its high, and about 12% below where it started the year.
This is the part most coverage of a rally leaves out, and it changes what the run means.
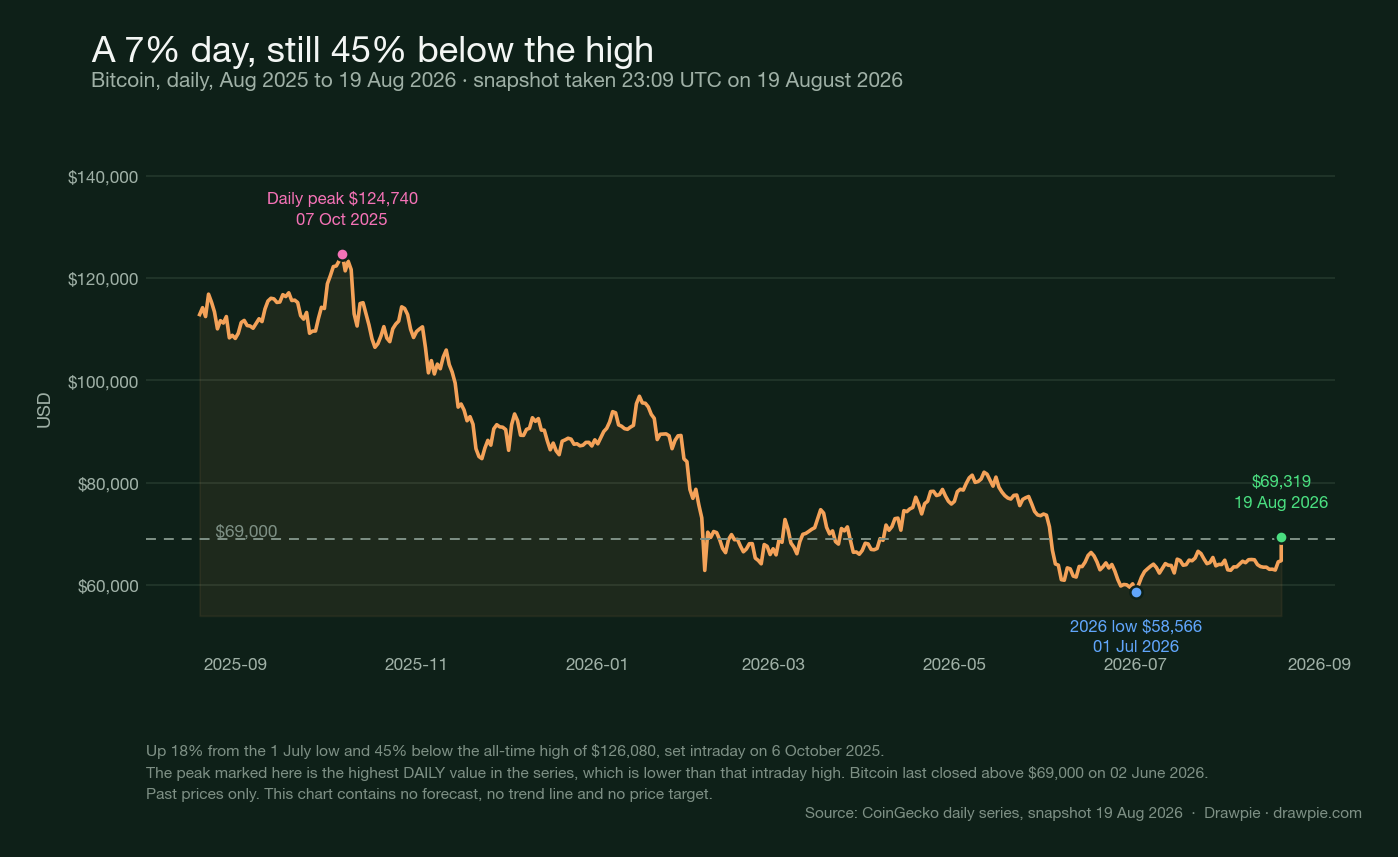
| Measure | Value |
|---|---|
| All-time high | $126,080, intraday on 6 October 2025 |
| Current distance from it | about −39% |
| Gain that would be needed to return to it | about +65% |
| 2026 low | $58,566 on 1 July 2026 |
| Gain from that low | about +31% |
| Change since 1 January 2026 | about −12% |
| $69,000 | reclaimed 20 August 2026, last held on 2 June 2026 |
So the accurate description of the week to 21 August is: bitcoin has recovered levels it last held in late May and early June, is up sharply from a low it made seven weeks ago, and remains a long way below where it was ten months ago.
That 65% is arithmetic, not a target. A 39% fall requires a 65% gain to undo — the asymmetry is a property of percentages, and this page takes no view on whether it happens.
What’s driving the rally?
Nobody can tell you, and anyone who says otherwise is describing a story rather than showing evidence. What can be done honestly is to lay out the dated events that sit inside the run, and let you weigh them.
There are three, all of them documented by the body that issued them.
| Date | Event | What the issuing body actually said |
|---|---|---|
| 18 Aug 2026 | SEC proposes Regulation Crypto Assets | Proposed rules creating “a clear and fit-for-purpose framework for certain investment contracts involving crypto assets” |
| 19 Aug 2026 | Treasury enlarges long-end buybacks | Buyback operations in the 10–20 and 20–30 year sectors go from a $2bn maximum to “at least $4 billion per operation”, effective 9 September |
| 19 Aug 2026 | July FOMC minutes released | Participants discussing whether policy was restrictive enough, with the target range held at 3.50–3.75% |
The SEC proposal is the one aimed squarely at this asset class. Its rules would create two exemptions from Securities Act registration — a one-time exemption for offerings up to $5 million over four years, and a second permitting up to $75 million in any 12-month period — plus a conditional safe harbor from the term “investment contract”. SEC Chairman Paul S. Atkins framed it as an attempt “to provide crypto asset entrepreneurs and market participants with clear pathways to raise capital under the federal securities laws”. The comment period runs 60 days from publication in the Federal Register.
The Treasury announcement is not about crypto at all, which is exactly why it is worth knowing about. Doubling the size of long-dated buyback operations is a liquidity operation in the government bond market, and Treasury described it as reflecting a “desire to provide greater liquidity support in longer-dated nominal sectors”. Whether that has anything to do with the price of bitcoin is precisely the sort of question this page will not pretend to answer.
The Fed minutes point the other way. The Committee held its target range at 3.50% to 3.75%, noting inflation “remained elevated relative to the Committee’s 2 percent” goal, and recorded that:
“Many participants assessed that policy tightening would likely be necessary if inflation did not decline. Some participants commented that financial conditions might not currently be sufficiently restrictive to facilitate a return of inflation to 2 percent.”
The minutes also record that the market-implied policy path had moved up, that Fed communications had been “perceived as more restrictive than expected”, and that markets had been pricing a rate increase by September.
Read those three against each other and no single story survives. Two are the kind of news conventionally read as supportive for risk assets; the third records participants discussing further tightening. We are not claiming any of them moved the price — the point is that a write-up which picks whichever one matches the direction of the chart is not explaining the move, it is selecting for it. And bitcoin did not move alone: ether rose even more sharply over the same seven days , which makes a market-wide explanation more plausible than a bitcoin-specific one.
Why single-day attribution cannot be settled. Bitcoin trades every hour of every day, across dozens of venues, with no disclosure requirement about who is buying. There is no equivalent of a company announcement that a price move can be pinned to. Any claim that a specific factor caused a specific move is an inference from correlation, and on a single episode it cannot be tested. We have written before about why no formula reliably explains bitcoin’s price , and a rally is that same problem with the sign reversed.
There is a second reason to be careful here. The numbers most often quoted as evidence for this rally — the scale of short liquidations, the size of spot-ETF inflows — come from feeds that are either paywalled or closed to us, and the two most-repeated liquidation figures do not even agree with each other. This page prints neither, which is a smaller claim than most coverage makes and a checkable one.
How unusual is a week like this?
Rare. On completed daily prices it is the largest seven-day gain in the past year, ahead of the run into bitcoin’s October 2025 peak.
We computed every rolling seven-day change across the 365 completed days in the snapshot behind the chart.
| Rank in the past year | Seven days ending | Gain |
|---|---|---|
| 1 | 21 August 2026 | +15.1% |
| 2 | 5 October 2025 | +11.6% |
| 3 | 4 October 2025 | +11.5% |
| 4 | 16 March 2026 | +10.4% |
Ranks 2 and 3 are consecutive days inside the same October 2025 run, not two separate weeks — rolling windows overlap, and the run into that peak is the only thing in the past year that comes close.
The single days behind it were large but not unprecedented: 20 August gained 7.35%, the second-biggest day of the past year, and 21 August added 5.19% on top.
| Rank in the past year | Date | Daily change |
|---|---|---|
| 1 | 7 February 2026 | +11.9% |
| 2 | 20 August 2026 | +7.4% |
| 3 | 5 March 2026 | +6.5% |
| 4 | 26 February 2026 | +5.9% |
| 5 | 3 December 2025 | +5.8% |
Over the same 365 days there were seven days that gained more than 5% and six that lost more than 5%, the worst of them −14.07% on 6 February 2026. That is worth putting beside the table above, because the largest up-day of the year came the day after the largest down-day of the year. Big single days are how this asset behaves in both directions; on their own they are not evidence of a turning point.
The current session says the same thing from another angle: a 24-hour range from $71,224.20 to $79,511.10 is an 11.6% spread inside one day.
What should you watch from here?
Dated events and base rates — the things published on a schedule, rather than opinions about where the price is heading. Every row below is an input you can check for yourself, not an output someone has predicted.
| What to watch | When | Why it is on this list |
|---|---|---|
| Jackson Hole symposium | 27–29 August 2026 | The Kansas City Fed’s announced theme is “Financial Innovation: Implications for Payments and Policy” — a central-bank agenda item, on the record, in this subject area |
| Next FOMC meeting | 15–16 September 2026 | Carries a Summary of Economic Projections. The July minutes tie the tightening discussion explicitly to whether inflation declines |
| SEC comment period | 60 days from Federal Register publication | Regulation Crypto Assets is a proposal, not a rule. What the final text says is a separate, later, checkable event |
| Treasury buyback operations | From 9 September, through 4 November 2026 | The larger operations run to the end of the refunding quarter; Treasury says the next sizing decision comes at the 4 November refunding |
| Whether $69,000 holds as a daily close | Daily | It was reclaimed on 20 August after eleven weeks below. Whether it stays above is observable; whether it “should” is not |
| The size of daily moves, not their direction | Ongoing | Seven up-days and six down-days beyond 5% in a year is the base rate. A single large day is normal behaviour, not a regime change |
What this page will not tell you
- Where bitcoin goes next. No forecast, no target, no range, no “if it breaks X” level. That is a site-wide rule for anything with a market price.
- What any bank or analyst thinks it is worth. Third-party price targets are not republished here, even with attribution.
- Whether to buy, sell or hold anything. Nothing on this page is investment advice.
- What caused this move. Not because it is uninteresting, but because it is not knowable from any source available to a reader, and pretending otherwise is the most common failure in crypto coverage.
- How much was liquidated, or how much went into ETFs. Both numbers are quoted everywhere. Neither could be verified from a source we can actually read, so neither is printed.
Sources
| Source | What it supports here |
|---|---|
| Coinbase spot price API | The $76,576.70 reading at 13:38 UTC on 21 August 2026, and the control test that an invented pair returns an error |
| Kraken public ticker API | The $76,599.90 reading, the 24-hour high of $79,511.10, the low of $71,224.20 and the open of $73,001.20 |
| CoinGecko bitcoin market data | The $76,463 aggregate timestamped 13:35:50 UTC, the all-time high of $126,080 and its 6 October 2025 date, and the drawdown percentage |
| CoinGecko daily market chart | The 365-day series behind the chart, the 1 July 2026 low of $58,566, the 2 June 2026 date bitcoin last held $69,000, the year-to-date change, and every seven-day and daily-change ranking |
| SEC: SEC Proposes New Regulation Crypto Assets (18 Aug 2026) | The 18 August date, the proposal’s name and purpose, the $5 million and $75 million exemptions, the conditional safe harbor, the 60-day comment period, and the quoted remarks from Chairman Paul S. Atkins |
| U.S. Treasury: increased sizes of nominal long-end liquidity support buybacks (19 Aug 2026) | The increase from a $2 billion to an at-least-$4 billion maximum per operation, the 10–20 and 20–30 year sectors, the 9 September effective date, the 4 November end of the refunding quarter, and Treasury’s stated reason |
| Federal Reserve: FOMC calendars | That the minutes of the 28–29 July 2026 meeting were released on 19 August 2026, and that the next meeting is 15–16 September 2026 with projections |
| Federal Reserve: minutes of the 28–29 July 2026 FOMC meeting | The 3.50–3.75% target range, the quoted passages on tightening and financial conditions, and the market pricing described in them |
| Federal Reserve Bank of Kansas City: Jackson Hole Economic Symposium | The 27–29 August 2026 dates and the announced theme, “Financial Innovation: Implications for Payments and Policy” |
Checked 21 August 2026, with every price stamped to the minute it was read.
This article contains no price forecast, and quotes no third-party price target. It is a record of prices that have already occurred and of published documents from the SEC, the U.S. Treasury and the Federal Reserve. Cryptocurrency prices are volatile and can fall as well as rise. Nothing here is investment advice or a recommendation to buy, sell or hold any asset. Do your own research and consider a licensed professional before acting on anything you read about markets.
How we verified this
Every price here was read from an exchange or market-data API and stamped, not taken from coverage. In a single one-second window at 13:38 UTC on 21 August 2026, Coinbase’s spot endpoint returned $76,576.70, Kraken’s ticker returned $76,599.90, and CoinGecko’s aggregate — timestamped 13:35:50 UTC, about two minutes earlier — returned $76,463. Kraken’s rolling 24-hour figures at that moment were a high of $79,511.10, a low of $71,224.20 and an open of $73,001.20.
All three price endpoints were control-tested, and one of them needs its body read rather than its status code. An invented trading pair on Coinbase returns 404 and an invented coin on CoinGecko returns 404, so a successful response from either means something. Kraken returns HTTP 200 for a nonsense pair — the giveaway is in the body, which carries EQuery:Unknown asset pair instead of a price. A status code alone would have passed that check.
⚠️ The three sources agree less closely than they did on 19 August, and that is reported rather than smoothed over. The first version of this page said three readings inside seven dollars were the reason it was willing to print a price. The two exchange quotes here are $23 apart, or 0.03%, and CoinGecko’s cross-venue aggregate sits $114 below Coinbase. On a day whose 24-hour range spans 11.6%, that is what a continuously traded asset looks like when it is moving quickly — and it is the reason every figure on this page carries the minute it was read.
The chart and the article carry different timestamps on purpose. The chart is built from a CoinGecko daily snapshot taken at 13:33 UTC on 21 August, whose live point is stamped 13:30 UTC at $76,891.62; the prices in the text were read at 13:38 UTC. Bitcoin has no closing price, so there is no single correct moment — the honest alternative is to say exactly when each figure was taken.
⚠️ The final point of a CoinGecko daily series is not a completed day, and every “day” and “week” figure here excludes it. With interval=daily the live price is appended to the series, so the last two entries share a date. Treating that as a closed day would overstate every daily change. All completed-day statistics on this page — the seven-day run, the daily rankings, the counts of 5% days — are computed on the 365 completed points only.
The seven-day claim in the title is asserted in code, not typed. The chart script computes every rolling seven-day change in the snapshot and asserts that the largest one ends on the latest completed day. If a future snapshot breaks that, the script fails rather than rendering a chart whose headline no longer matches the data. On completed points the run is +15.14%, against +11.63% for the week ended 5 October 2025.
⚠️ The chart’s peak and the article’s all-time high are deliberately different numbers. The daily series peaks at $124,740 on 7 October 2025; the recorded all-time high is $126,080, set intraday on 6 October. A daily series cannot contain an intraday extreme. Every drawdown percentage here is measured against the intraday high, and the chart footnote says which figure it is showing.
The SEC and Treasury documents are the agencies’ own, and both passed a control test. SEC press release 2026-76, dated 18 August 2026, announces proposed rules titled “Regulation Crypto Assets” and is quoted from directly; an invented press-release path on the same host does not return it. Treasury’s release of 19 August 2026 announcing larger long-end buybacks was read on home.treasury.gov, where an invented release number returns 404. Note the SEC proposal is dated 18 August, a day earlier than much of the coverage of it.
The Federal Reserve material is from the Fed, not from commentary about it. Its FOMC calendar records the minutes of the 28–29 July meeting as released on 19 August 2026 and lists the next meeting as 15–16 September, with projections. The quoted passages come from the minutes document itself. An invented minutes URL on the same host returns 404.
⚠️ The Jackson Hole dates were read in a browser because that host does not answer us any other way. Requests to kansascityfed.org return no response at all — for the real page and for an invented one alike — so the status-code check has no power to tell them apart. Loaded in a browser, the page renders its own dates and theme, which is a stronger check than a status code: the content identifies itself.
🔴 No cause is asserted anywhere on this page. The three dated events are reported because they are dated and verifiable, not because we can show any of them moved the price. Nothing in the sourcing available to anyone outside the market can establish what caused a move in a continuously traded asset, and this page says so rather than picking whichever of the three fits the direction best.
⚠️ Two widely quoted numbers were sought and discarded. Figures for short liquidations during this run trace back to a derivatives data provider whose API requires a paid key, and the two most-cited versions of the number do not agree with each other. A widely used spot-ETF flow tracker returns HTTP 403 for both its real page and an invented path, so a working request cannot be distinguished from a blocked one — the same result as when this page was first written. Neither figure appears here.
This article contains no price forecast and quotes no third-party price target. That is a site-wide rule for anything with a market price, and it applies to the arithmetic too: the 65% figure is what a 39% decline implies in percentage terms, not a level anyone expects to be reached.