Best FPL Team 2026/27: GW1 Draft, Captain & Budget Picks
Update log (2)
- — Two days from the deadline, and the injury list is what has moved. On 6 August 512 of the game's players were available to pick; 481 are now, out of 592 in the game. Inside our filter the pool falls from 238 to 224. None of that changes the answer: prices are locked until the deadline and the proven optimum is still 2,603, with the same fifteen players. What has changed is the crowd — Haaland's ownership has fallen from 73.7% to 70.0%, João Pedro is up to 60.9%, and Kroupi Jr, still injured, has been sold down from 5.3% to 1.3%. Every table and all nine charts are re-run against a 19 August snapshot.
- — Correction: widening the pool from the 900-minute filter to all 512 selectable players does not move the unforced optimum. It is 2,603 on both, proven on both. This page previously said the wider pool gained roughly three points. Everything else re-run against a 6 August snapshot: prices have not moved and the solved squad is unchanged, but ownership has, and Kroupi Jr is now injured.
The Gameweek 1 deadline this draft guide built to — 17:30 UTC on Friday 21 August 2026 — has passed; prices are no longer locked, and availability and ownership will have moved on since the 19 August snapshot.
Everything else on the page is unaffected; the figures below still say when they were read.

- The GW1 deadline is 17:30 UTC on Friday 21 August 2026 — 18:30 BST. Prices are already live, transfers are unlimited until then, and the budget is £100.0m for fifteen players — 2 goalkeepers, 5 defenders, 5 midfielders, 3 forwards, maximum three from any one club.
- Solve for the most 2025/26 points buyable inside those rules and you get a 3-5-2 that spends the full £100.0m and does not contain Erling Haaland. At £15.5m he returned 15.4 points per £1m last season; Gabriel at £8.0m returned 26.1.
- But we measured what that actually costs, with a proven optimum rather than a guess. Forcing Haaland in gives up 103 points of theoretical maximum over a season; forcing Bruno Fernandes gives up 37; forcing both gives up 171. One premium is close to free, and both together is expensive but perfectly legal — the cheapest fifteen containing them costs £89.0m.
- Everton, Liverpool, Manchester United and Newcastle open with the kindest six fixtures on the game’s own difficulty ratings. Bournemouth open with the worst, including a GW1 trip to Manchester City.
- Every RAW INPUT is official — launch prices, last season’s actual returns, the game’s own fixture difficulty. The optimisation totals, the value averages, the goals-minus-xG gaps and the captain score are all derived by us from those inputs, and the captain score in particular is a forward-looking heuristic. No third-party projection is used anywhere.
The Gameweek 1 deadline is 17:30 UTC on Friday 21 August 2026 — 18:30 BST, and the prices are already out. You have £100.0m, fifteen players, a maximum of three from any club, and unlimited transfers until the deadline — which means nothing you pick before 17:30 UTC on 21 August costs anything to change.
This is what the numbers point at, and where they stop being useful.
What does the best FPL team for 2026/27 GW1 look like?
Solve for the most points buyable inside the rules and you get a 3-5-2 that spends every penny of the £100.0m — and leaves out the most expensive player in the game.
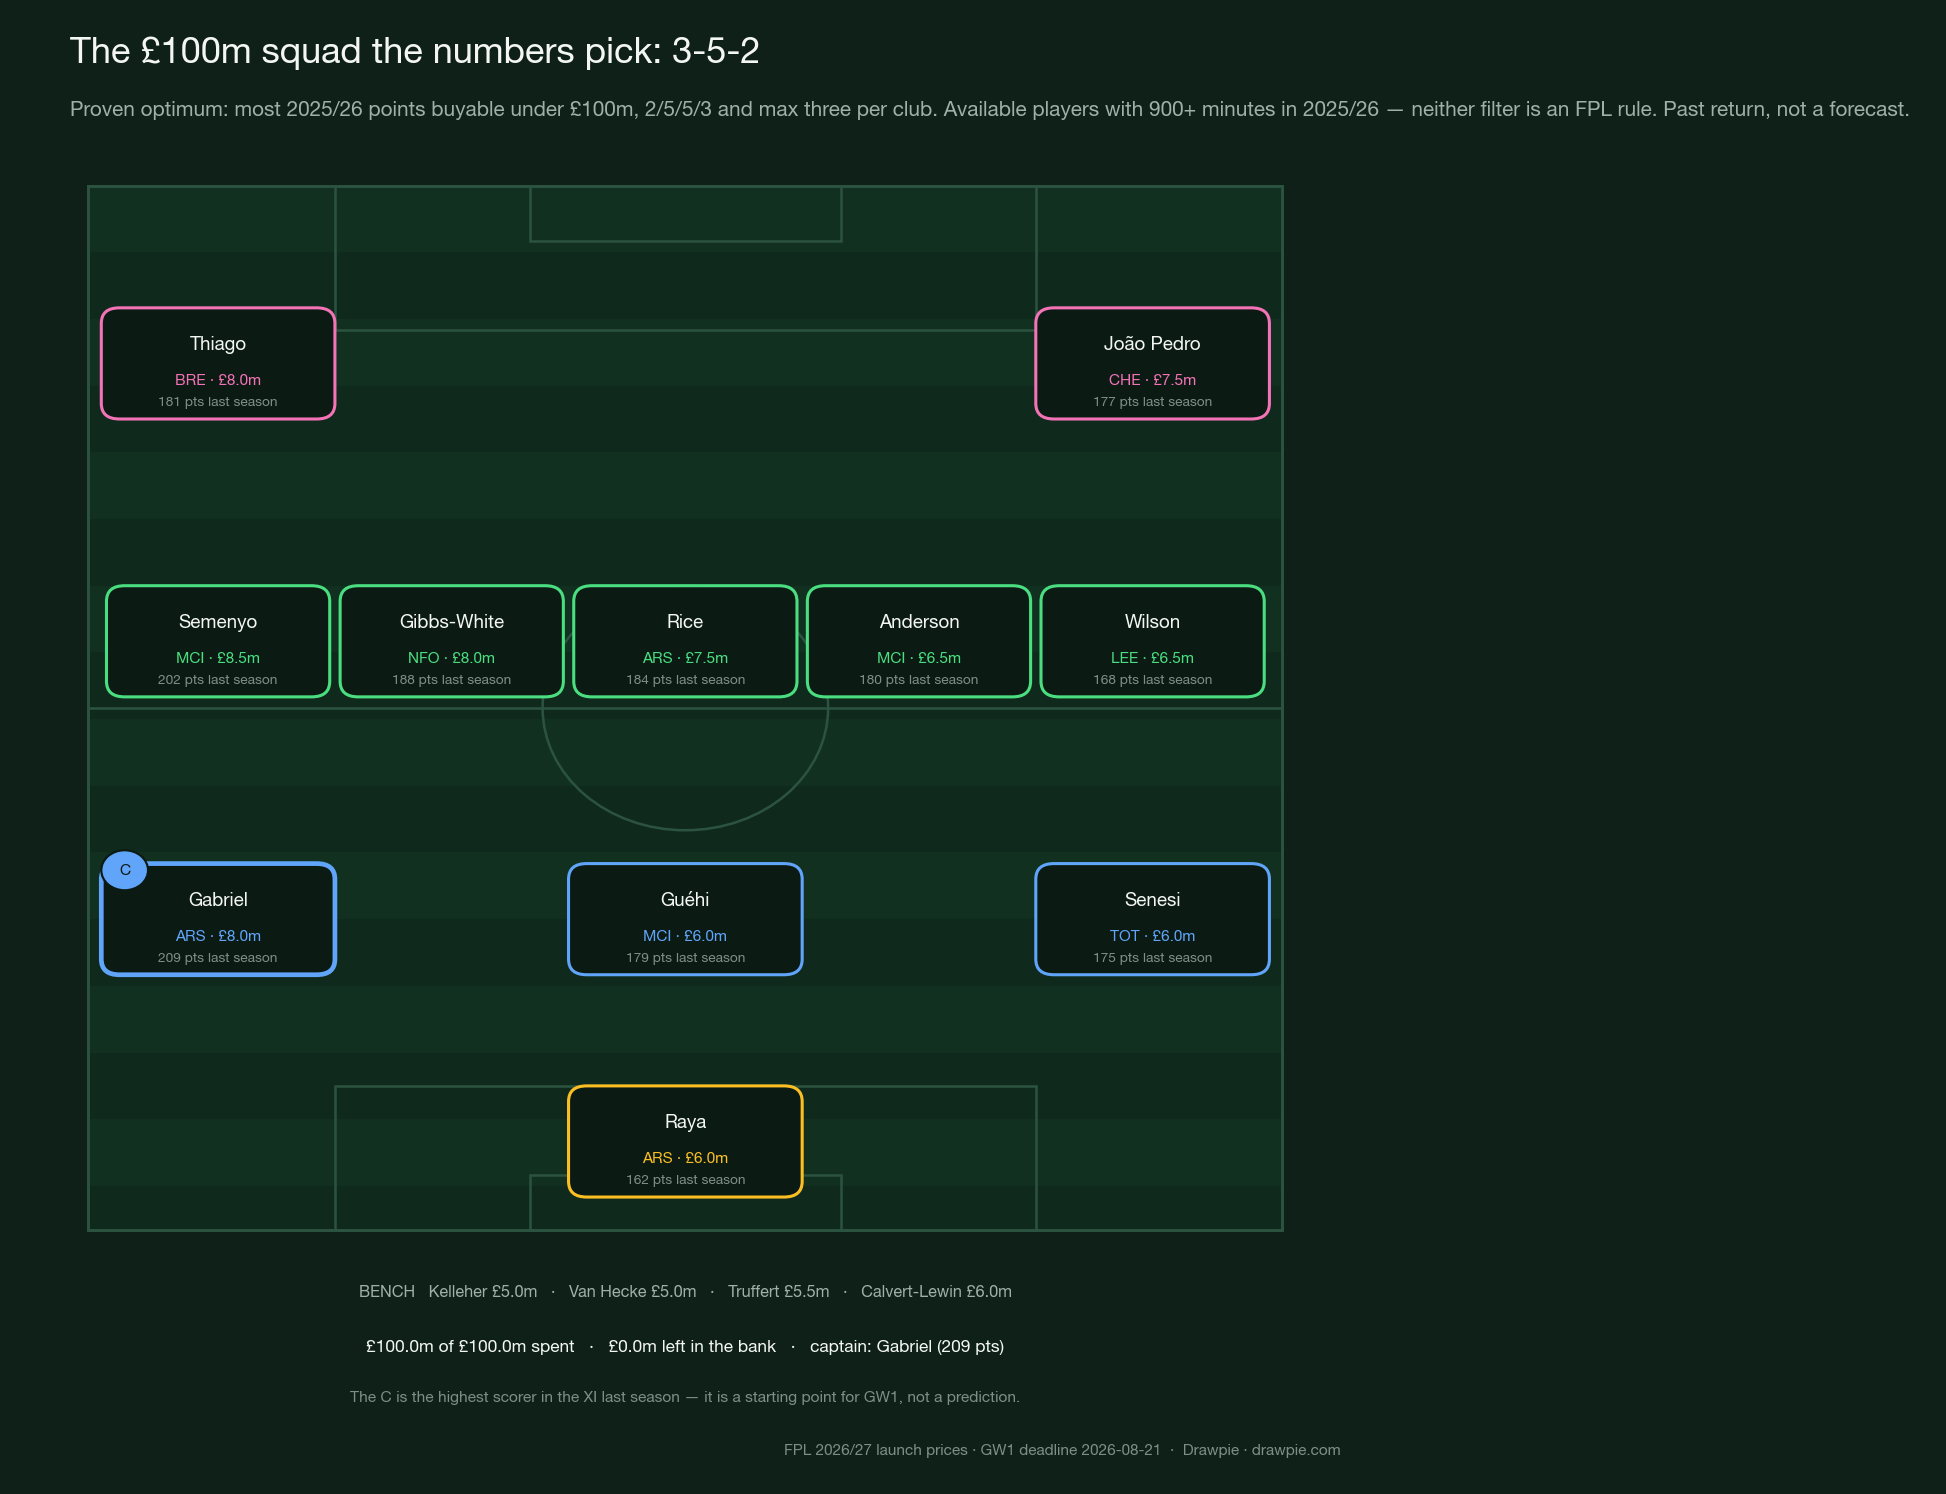
| Position | Players |
|---|---|
| GKP | Raya (ARS, £6.0m) |
| DEF | Gabriel (ARS, £8.0m) · Guéhi (MCI, £6.0m) · Senesi (TOT, £6.0m) |
| MID | Semenyo (MCI, £8.5m) · Gibbs-White (NFO, £8.0m) · Rice (ARS, £7.5m) · Anderson (MCI, £6.5m) · Wilson (LEE, £6.5m) |
| FWD | Thiago (BRE, £8.0m) · João Pedro (CHE, £7.5m) |
| Bench | Kelleher (£5.0m) · Truffert (BOU, £5.5m) · Van Hecke (TOT, £5.0m) · Calvert-Lewin (£6.0m) |
That is 2,603 points of 2025/26 return — the proven maximum, not a good guess. It only holds inside the filter the solver actually used: players who are currently available and logged at least 900 minutes last season, 224 of them on 19 August. Neither is an FPL rule; they are ours, to stop the optimiser filling the squad with players who did not play.
Read that as a value benchmark rather than a team sheet. It is the answer to one precise question — which fifteen-player squad maximises total 2025/26 points under 2026/27 prices and the stated constraints — and it is worth knowing exactly because it is not the team most people will pick. Note what it optimises: the fifteen-man total. The 3-5-2 is chosen afterwards, as the best-scoring legal eleven inside that squad.
Why is Haaland not in the squad?
Because he is the least efficient way to spend £15.5m — but the optimiser overstates how much that matters, and we can put a number on by how much.
Haaland scored 239 points last season, more than anyone. At a record £15.5m that is 15.4 points per £1m. Gabriel scored 209 at £8.0m, which is 26.1 per £1m — nearly 70% more return for every pound. An optimiser told to maximise points inside a fixed budget will take that trade every time, and it will keep taking it until the squad is full of £6m defenders.
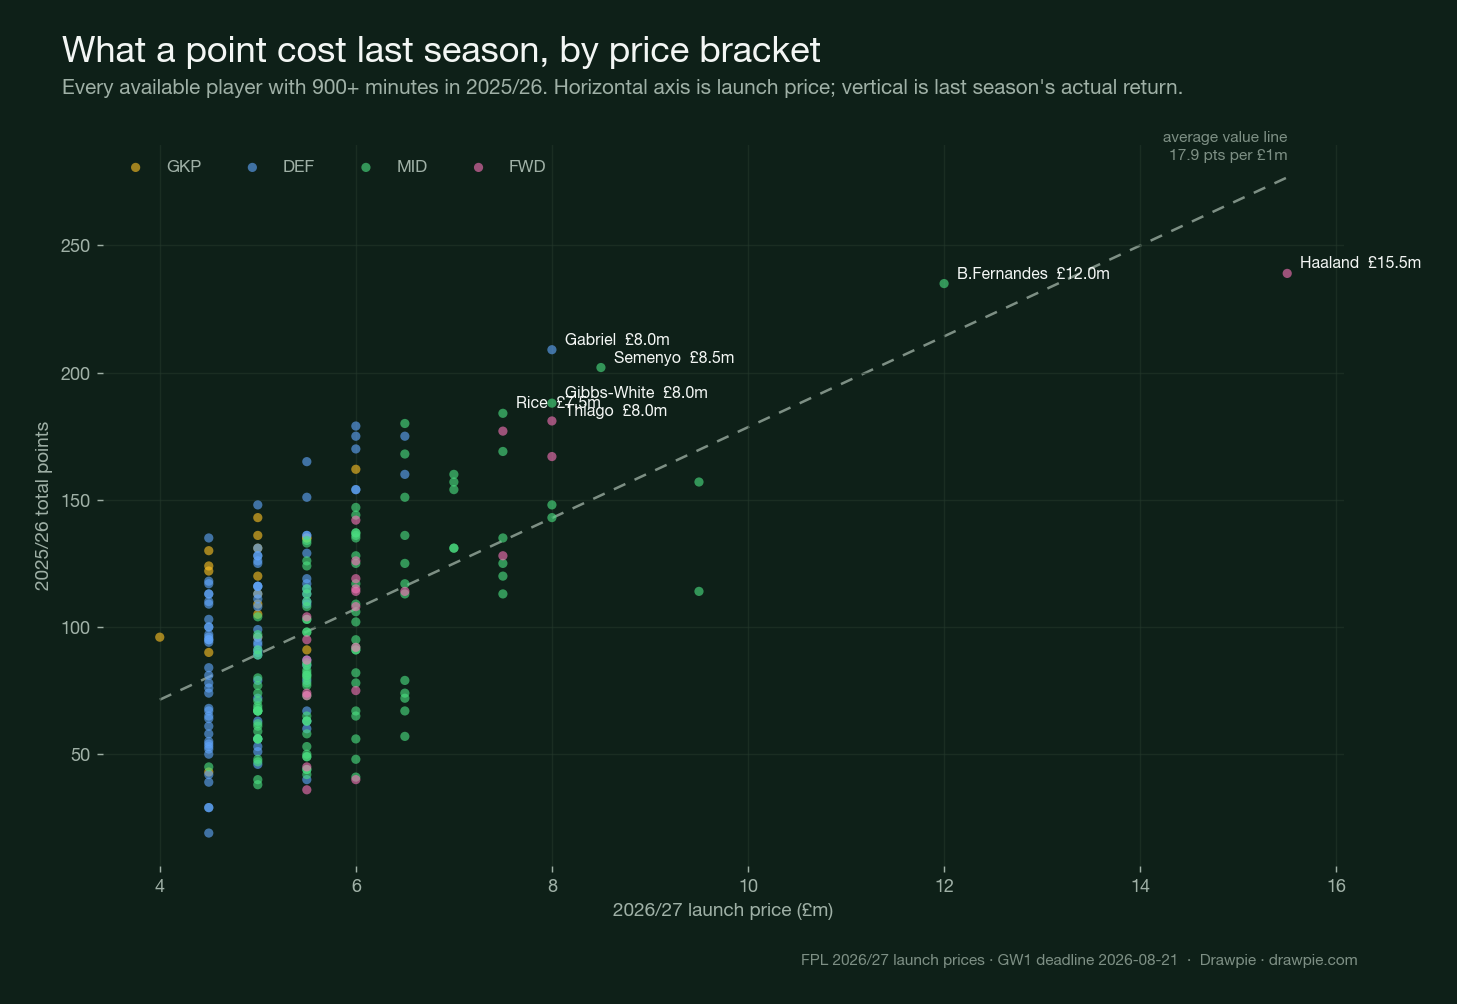
| Best points per £1m | Club | Pos | Price | 2025/26 pts | Pts per £1m |
|---|---|---|---|---|---|
| Truffert | BOU | DEF | £5.5m | 165 | 30.0 |
| Mitchell | CRY | DEF | £4.5m | 135 | 30.0 |
| Guéhi | MCI | DEF | £6.0m | 179 | 29.8 |
| Van Hecke | TOT | DEF | £5.0m | 148 | 29.6 |
| Senesi | TOT | DEF | £6.0m | 175 | 29.2 |
| Verbruggen | BHA | GKP | £4.5m | 130 | 28.9 |
| Kelleher | BRE | GKP | £5.0m | 143 | 28.6 |
Every name in that top seven is a defender or a goalkeeper, which is the whole point of the scatter: the value line is steepest at the cheap defensive end, and that is where an optimiser goes shopping. All seven are still available on 19 August, which is not true of every table on this page.
That is a real finding and a partial one. Here is what the arithmetic cannot price: 70.0% of managers own Haaland two days before the deadline — down from 73.7% on 6 August, but still more than two in three. If you leave him out you are not taking a small position against one player, you are taking a 70% differential every single gameweek. When he blanks you gain a little on seven managers in ten. When he hauls and doubles it as captain, you lose ground on seven in ten in ninety minutes.
What does carrying a premium actually cost?
So we measured it. Force a given player into the squad, re-solve for the best legal fifteen around him, and compare the total with the unconstrained optimum.
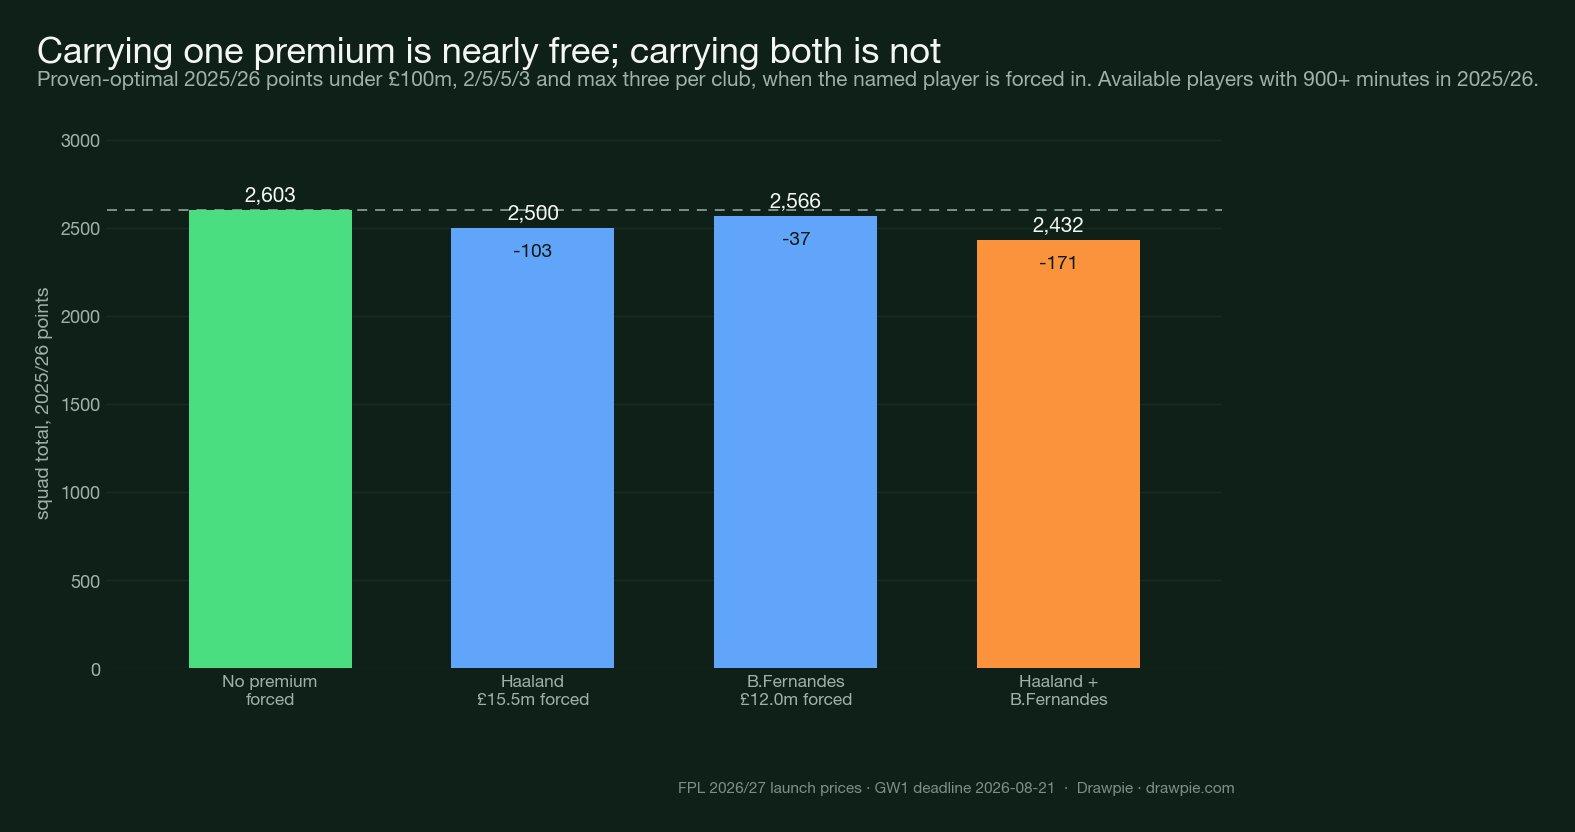
| Constraint | Proven-optimal squad, 2025/26 pts | Cost vs unconstrained |
|---|---|---|
| No premium forced | 2,603 | — |
| Bruno Fernandes (£12.0m) forced | 2,566 | −37 |
| Haaland (£15.5m) forced | 2,500 | −103 |
| Both forced | 2,432 | −171 |
That changes the argument. Carrying Bruno Fernandes costs 37 points of theoretical maximum across a whole season — one point a gameweek, which is noise. Carrying Haaland costs 103, under three a gameweek. Neither is the catastrophe that “worst value in the game” implies.
Carrying both is possible and costs 171. Within the same available, 900+ minute sample the cheapest fifteen containing them costs £89.0m; under FPL’s selection rules alone, with no minutes filter, the minimum is £82.5m. Either way the money is there — what it buys you is a thinner squad everywhere else.
So the honest version is narrower than the first chart suggests: one premium is close to free, both together cost about four and a half points a gameweek, and which you pick is a question about risk rather than value. Given that roughly three-quarters of the game owns Haaland, “close to free” is a bargain for the manager who does not want to spend the season 74% exposed.
⚠️ One limit on reading these totals as a “cost”. They add up all fifteen players’ points, but in a normal gameweek only the starting eleven score — the bench pays off through automatic substitutions or a Bench Boost, not week to week. Treat the gaps as a comparison between squads, not as points you would actually have banked.
One more caution about the squad above
Three of the players the optimiser picked out-scored their expected goals by a wide margin last season, and single-season xG overperformance is noisy and only partly persistent — some of it is finishing skill that carries over, most of it is not.
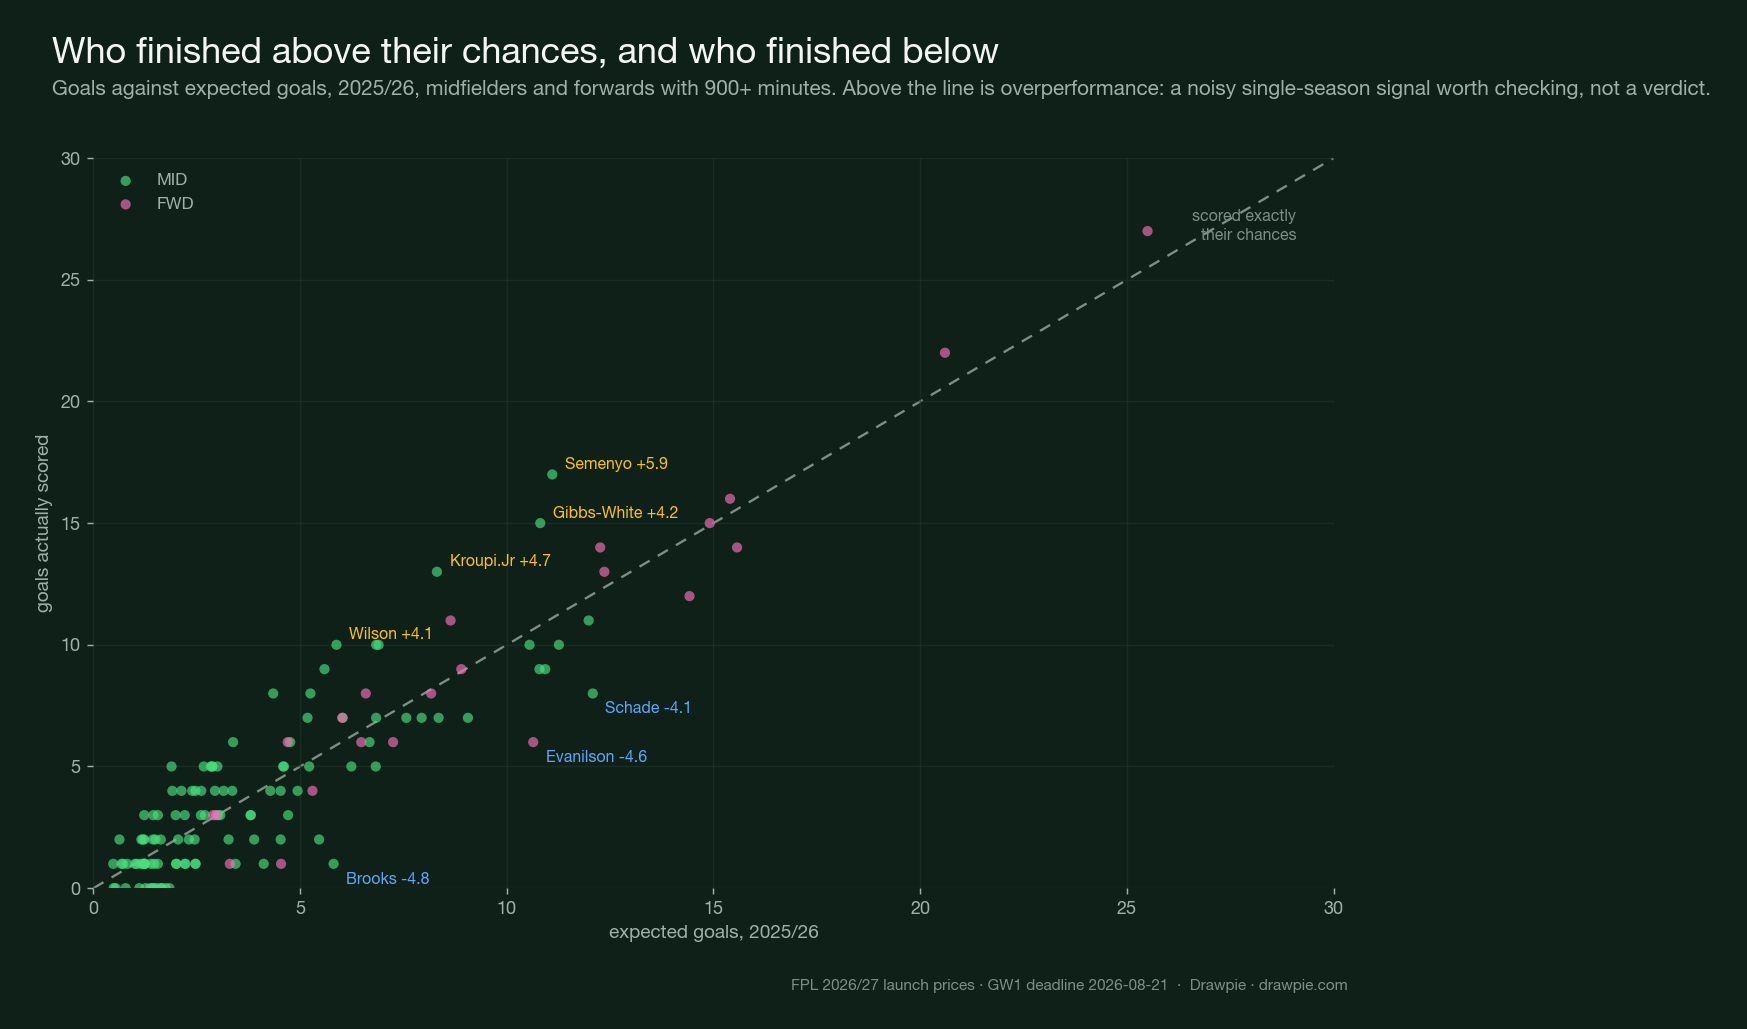
| Overperformed xG | Club | Price | Goals | xG | Difference |
|---|---|---|---|---|---|
| Semenyo | MCI | £8.5m | 17 | 11.1 | +5.9 |
| Gibbs-White | NFO | £8.0m | 15 | 10.8 | +4.2 |
| Wilson | LEE | £6.5m | 10 | 5.9 | +4.1 |
| Dewsbury-Hall | EVE | £6.5m | 8 | 4.3 | +3.7 |
| Bruno G. | ARS | £7.0m | 9 | 5.6 | +3.4 |
Kroupi Jr used to be second on that list — 13 goals from 8.3 xG, +4.7 — and he is not on it now because he is still flagged injured and the availability filter drops him. Managers have drawn the same conclusion: his ownership has fallen from 5.3% on 6 August to 1.3%. The xG record is still a fact about last season; he is simply not buyable.
Semenyo, Gibbs-White and Wilson are all in the solved squad. Their 2025/26 points are real; some of them came from finishing above what the chances were worth, and a single season of goals-minus-xG is a noisy measure that tends to pull back toward the chances. It is a flag to check, not a verdict — the research on finishing is clear that elite, high-volume shooters can and do beat their xG repeatedly, so the gap alone does not tell you which of these is luck and which is a finisher.
The other end of the scatter deserves the same caution in reverse. Evanilson scored 6 from 10.6 xG and Schade 8 from 12.1 — they got into the right positions all season and did not convert. That can mean the goals are owed, or it can mean the finishing is the problem. What the chart establishes is where to look, not what will happen.
| Underperformed xG | Club | Price | Goals | xG | Difference |
|---|---|---|---|---|---|
| Evanilson | BOU | £6.0m | 6 | 10.6 | −4.6 |
| Schade | BRE | £6.0m | 8 | 12.1 | −4.1 |
| Delap | CHE | £5.5m | 1 | 4.5 | −3.5 |
| Amad | MUN | £6.0m | 2 | 5.5 | −3.5 |
Brooks of Bournemouth headed this list on 6 August at −4.8 and has dropped off it for the same reason as Kroupi Jr: he is no longer flagged available.
Which teams have the best fixtures for GW1 to GW6?
Everton, Liverpool, Manchester United and Newcastle all open on a total difficulty of 17 — the kindest opening six in the league. Bournemouth open on 22, the worst, starting with a trip to Manchester City.
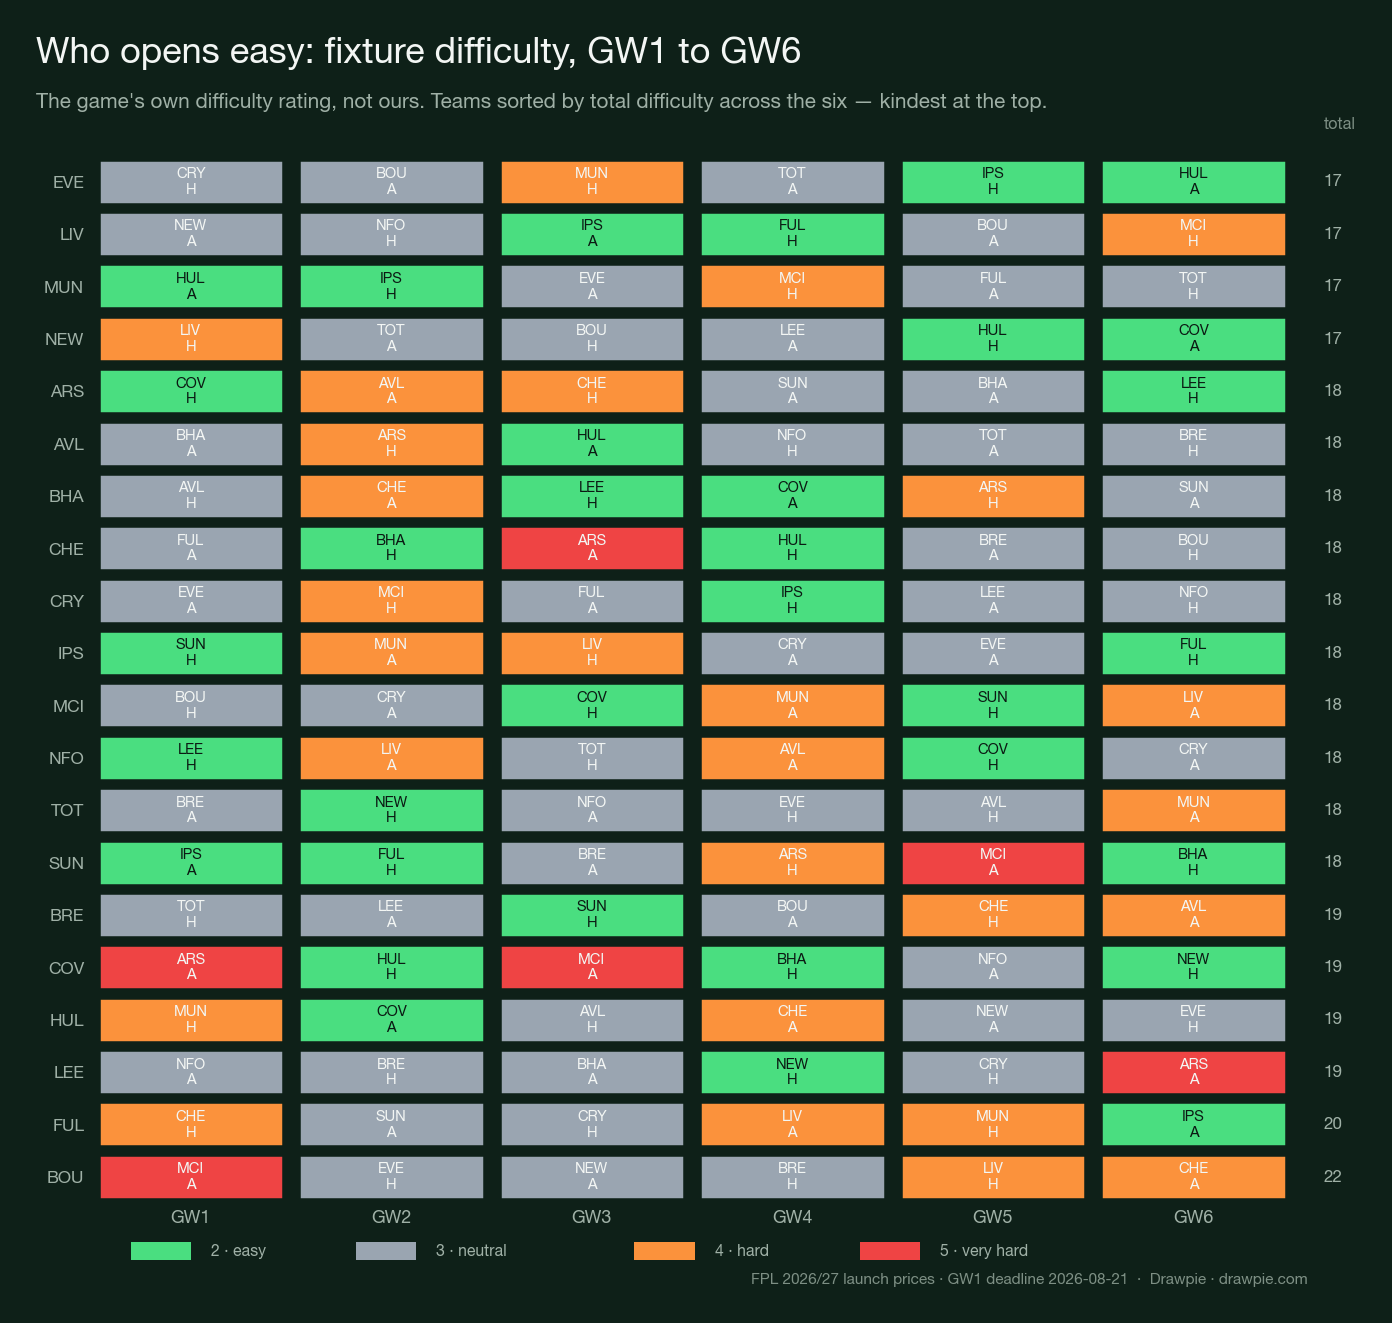
| Kindest opening six | Total | Hardest opening six | Total |
|---|---|---|---|
| Everton | 17 | Bournemouth | 22 |
| Liverpool | 17 | Fulham | 20 |
| Manchester United | 17 | Brentford | 19 |
| Newcastle | 17 | Coventry · Hull · Leeds | 19 |
Two cautions on reading that table. These are the pre-season ratings — the league reviews and updates FDR through the season using recent home and away form, so a row that looks kind in July can be repriced by September. And a six-week window is short enough that one fixture swing moves a team several places — Arsenal sit on 18 despite a difficulty-2 opener, because GW2 and GW3 are both 4s.
Where it is genuinely useful is at the cheap end. A £4.5m defender from a team with three green openers is a far better bet than the same price from Bournemouth, and that is a decision the heatmap makes for you.
How should you split the £100m budget?
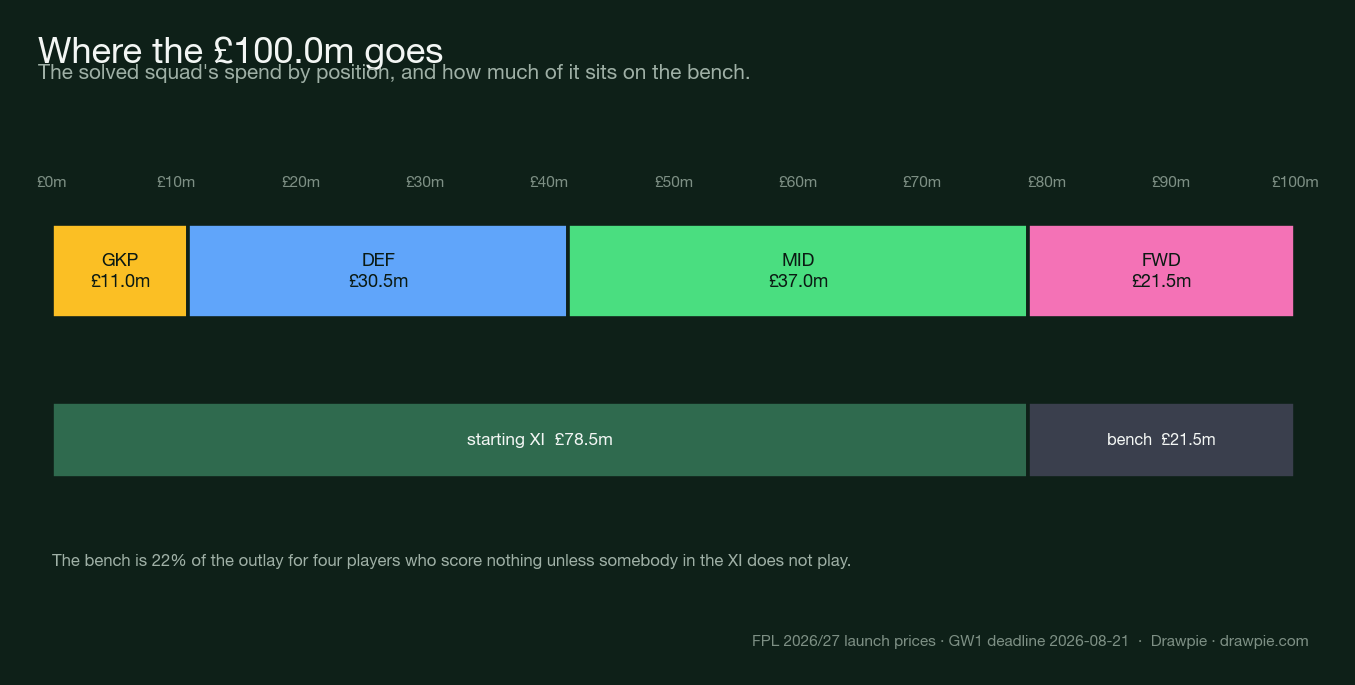
The solved squad spends £78.5m on the eleven who start and £21.5m on four who mostly will not play.
| Position | Spend | Share of £100m |
|---|---|---|
| GKP (2) | £11.0m | 11% |
| DEF (5) | £30.5m | 31% |
| MID (5) | £37.0m | 37% |
| FWD (3) | £21.5m | 22% |
| — starting XI | £78.5m | 79% |
| — bench | £21.5m | 21% |
That bench figure is the number most worth staring at. 21.5% of the budget sits on players who normally score nothing unless somebody in the XI does not play — bench points count through automatic substitutions, and in the one week you play a Bench Boost. The standard response is to go cheaper on the bench and put the savings into the XI — but a £4.5m fourth midfielder, the cheapest the game sells, is also a player you cannot use when your £8.0m midfielder is suspended.
The honest framing is that bench spend buys insurance, and how much insurance you want is a preference, not a solved problem.
How risky is the cheap end?
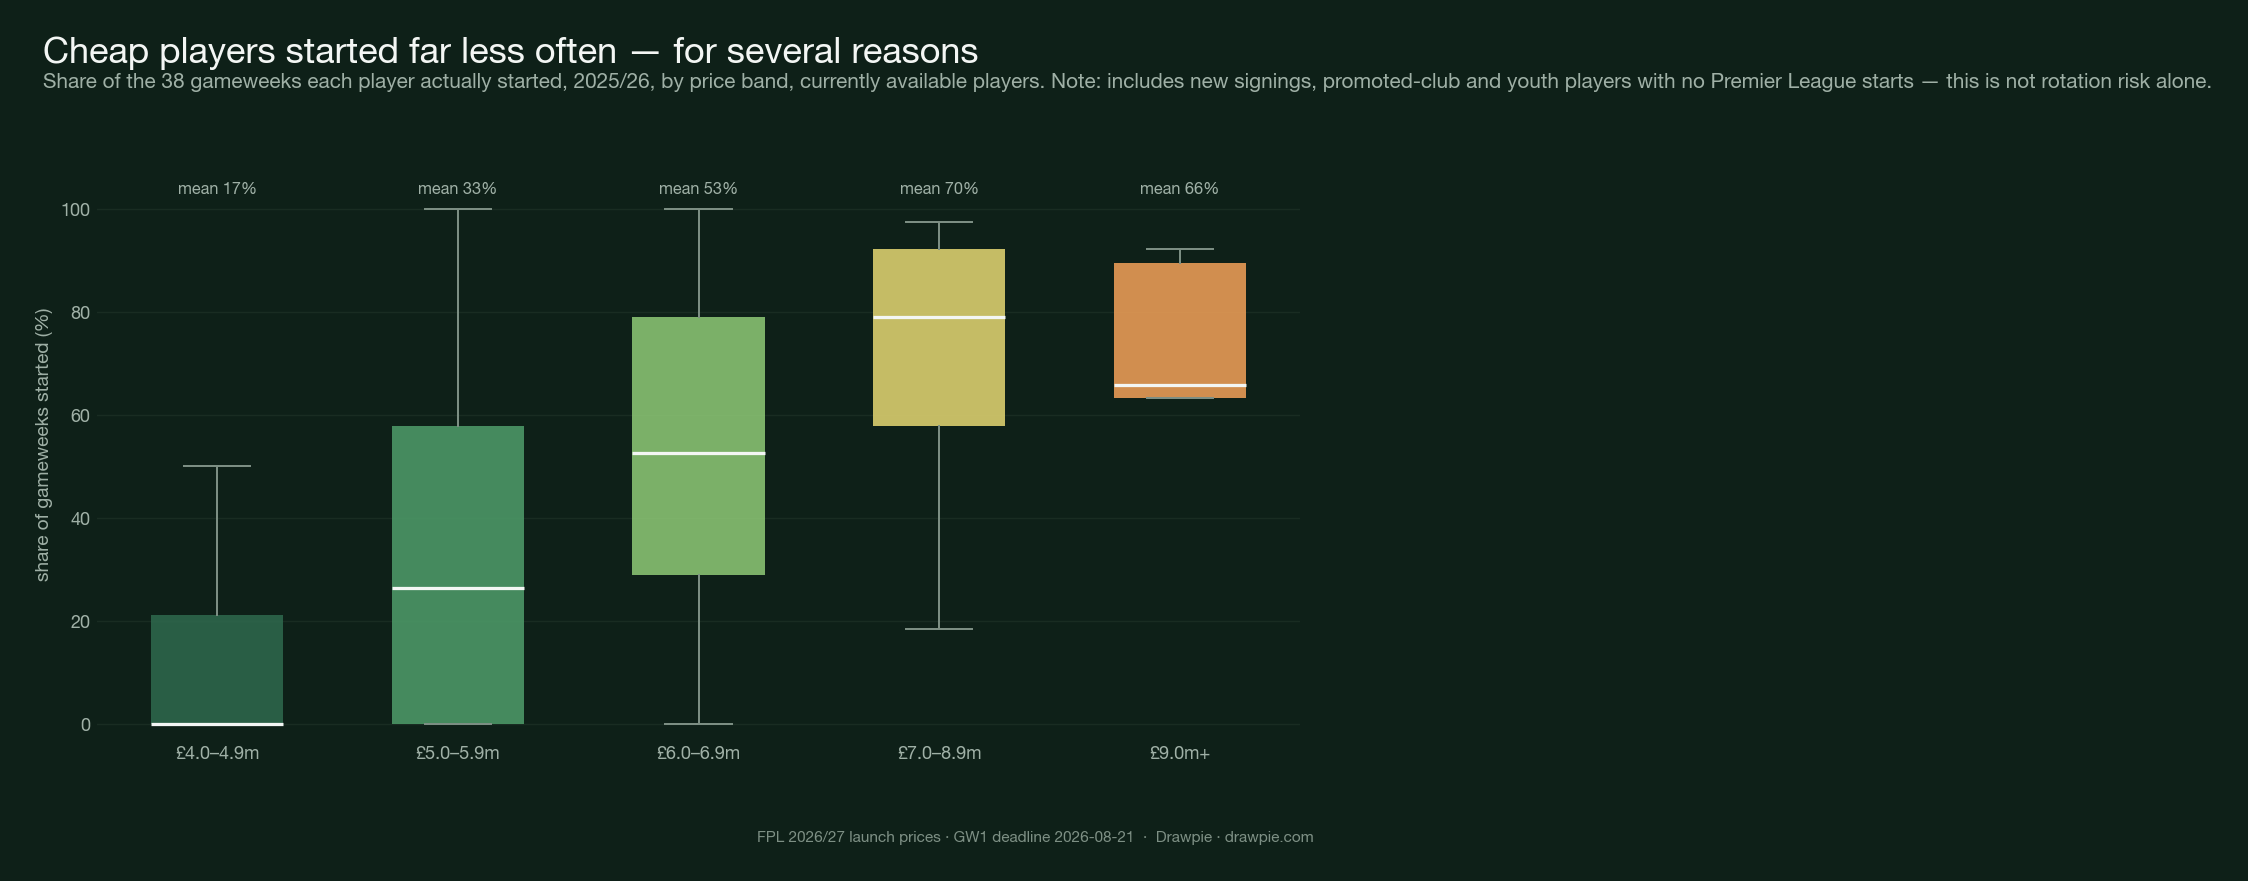
A £4m player started 17% of last season’s gameweeks. A £7-8.9m player started 72%.
| Price band | Mean share of gameweeks started |
|---|---|
| £4.0–4.9m | 17% |
| £5.0–5.9m | 31% |
| £6.0–6.9m | 53% |
| £7.0–8.9m | 72% |
| £9.0m+ | 66% |
Read the band, not the individual. The cheap bracket is not simply “players who get rotated” — it also holds new signings, promoted-club players and academy graduates who had no Premier League starts available to them last season, and their zeroes drag the band down. What the chart establishes is that a low price is no evidence of minutes, either way.
The failure mode it points at is real all the same. A cheap enabler is only cheap if he plays; if he starts a third of the time, the two bench slots you filled to save money quietly become a smaller squad. The spread inside each band matters as much as the mean — there are £4.5m players who started thirty games and £4.5m players who started two, and telling them apart is the single highest-value bit of homework before a deadline.
Where does the value actually sit?
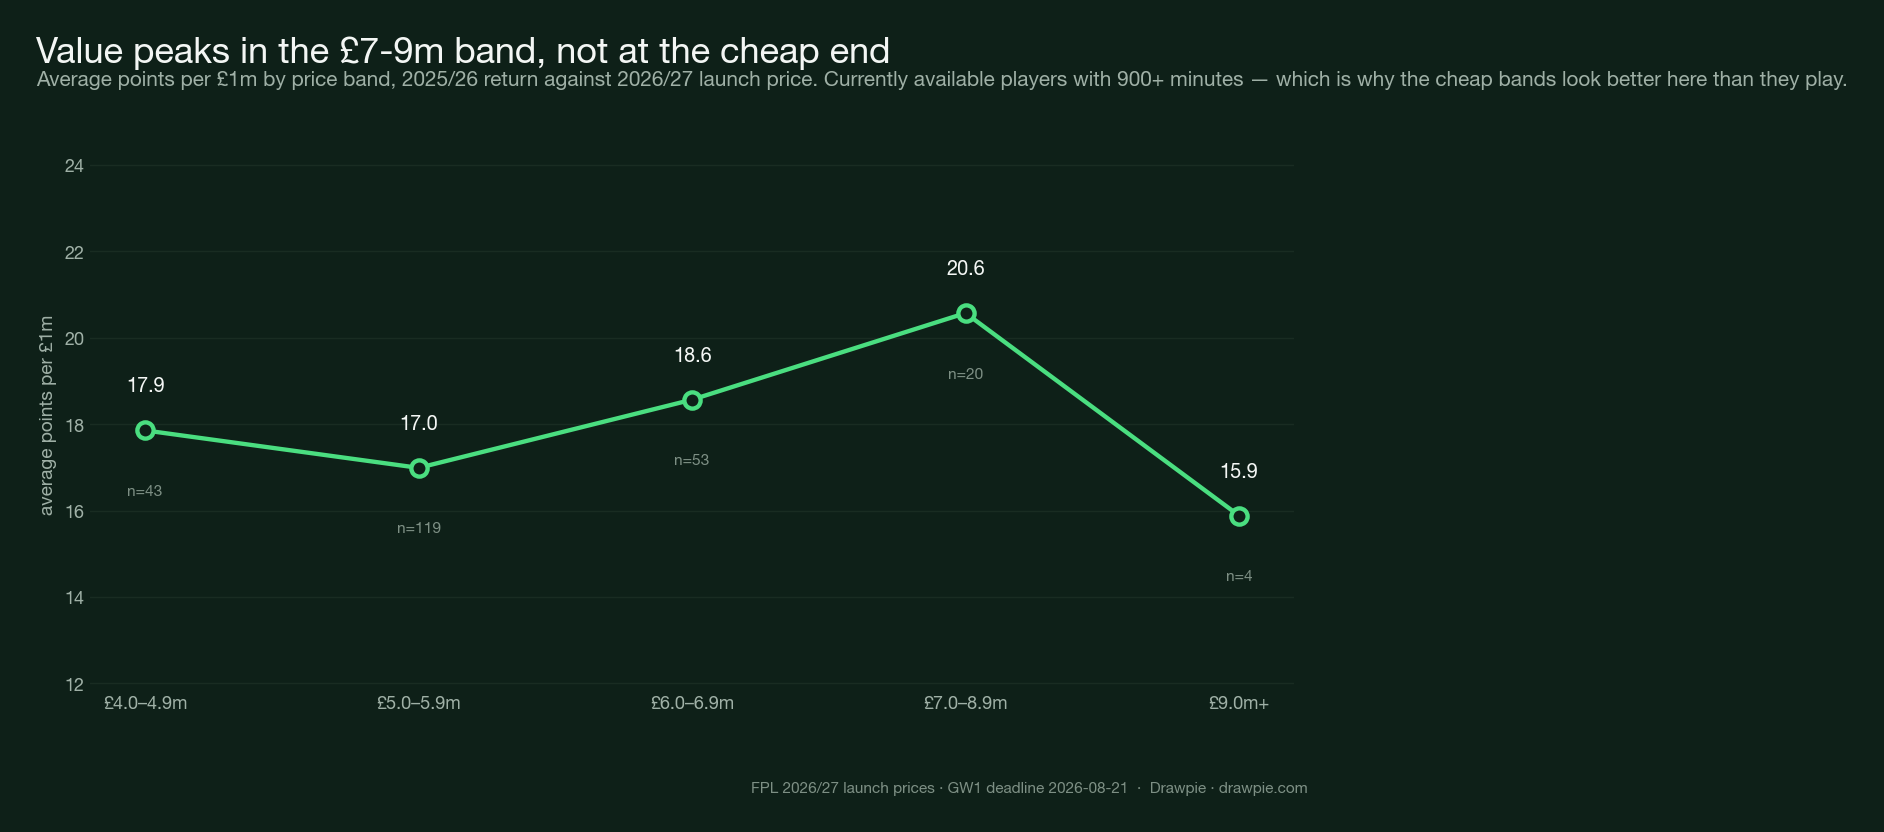
Not at the cheapest end. On this sample the best average return per pound came from the £7.0–8.9m band, at 21.1 points per £1m.
| Price band | Avg points per £1m | Players |
|---|---|---|
| £4.0–4.9m | 17.8 | 40 |
| £5.0–5.9m | 16.8 | 109 |
| £6.0–6.9m | 18.2 | 53 |
| £7.0–8.9m | 21.1 | 18 |
| £9.0m+ | 15.9 | 4 |
That is worth sitting with, because it cuts against the instinct the first scatter encourages. The individual best-value players are cheap defenders — but on average, the mid-price bracket returned more per pound than the cheap one, because the cheap bracket is full of players who barely played. The £9.0m+ figure comes from four players and should not be read as a trend.
Put the two charts together and the shape of a sensible squad falls out: the cheap end is where you take rotation risk, the £7-9m band is where the reliable value is, and one premium costs less than it looks.
Template picks or differentials?
Ownership and last season’s return are positively but imperfectly related — Pearson’s r is 0.66 on the 19 August snapshot — and the useful quadrant is the top-left: currently low-owned players who scored well in 2025/26.
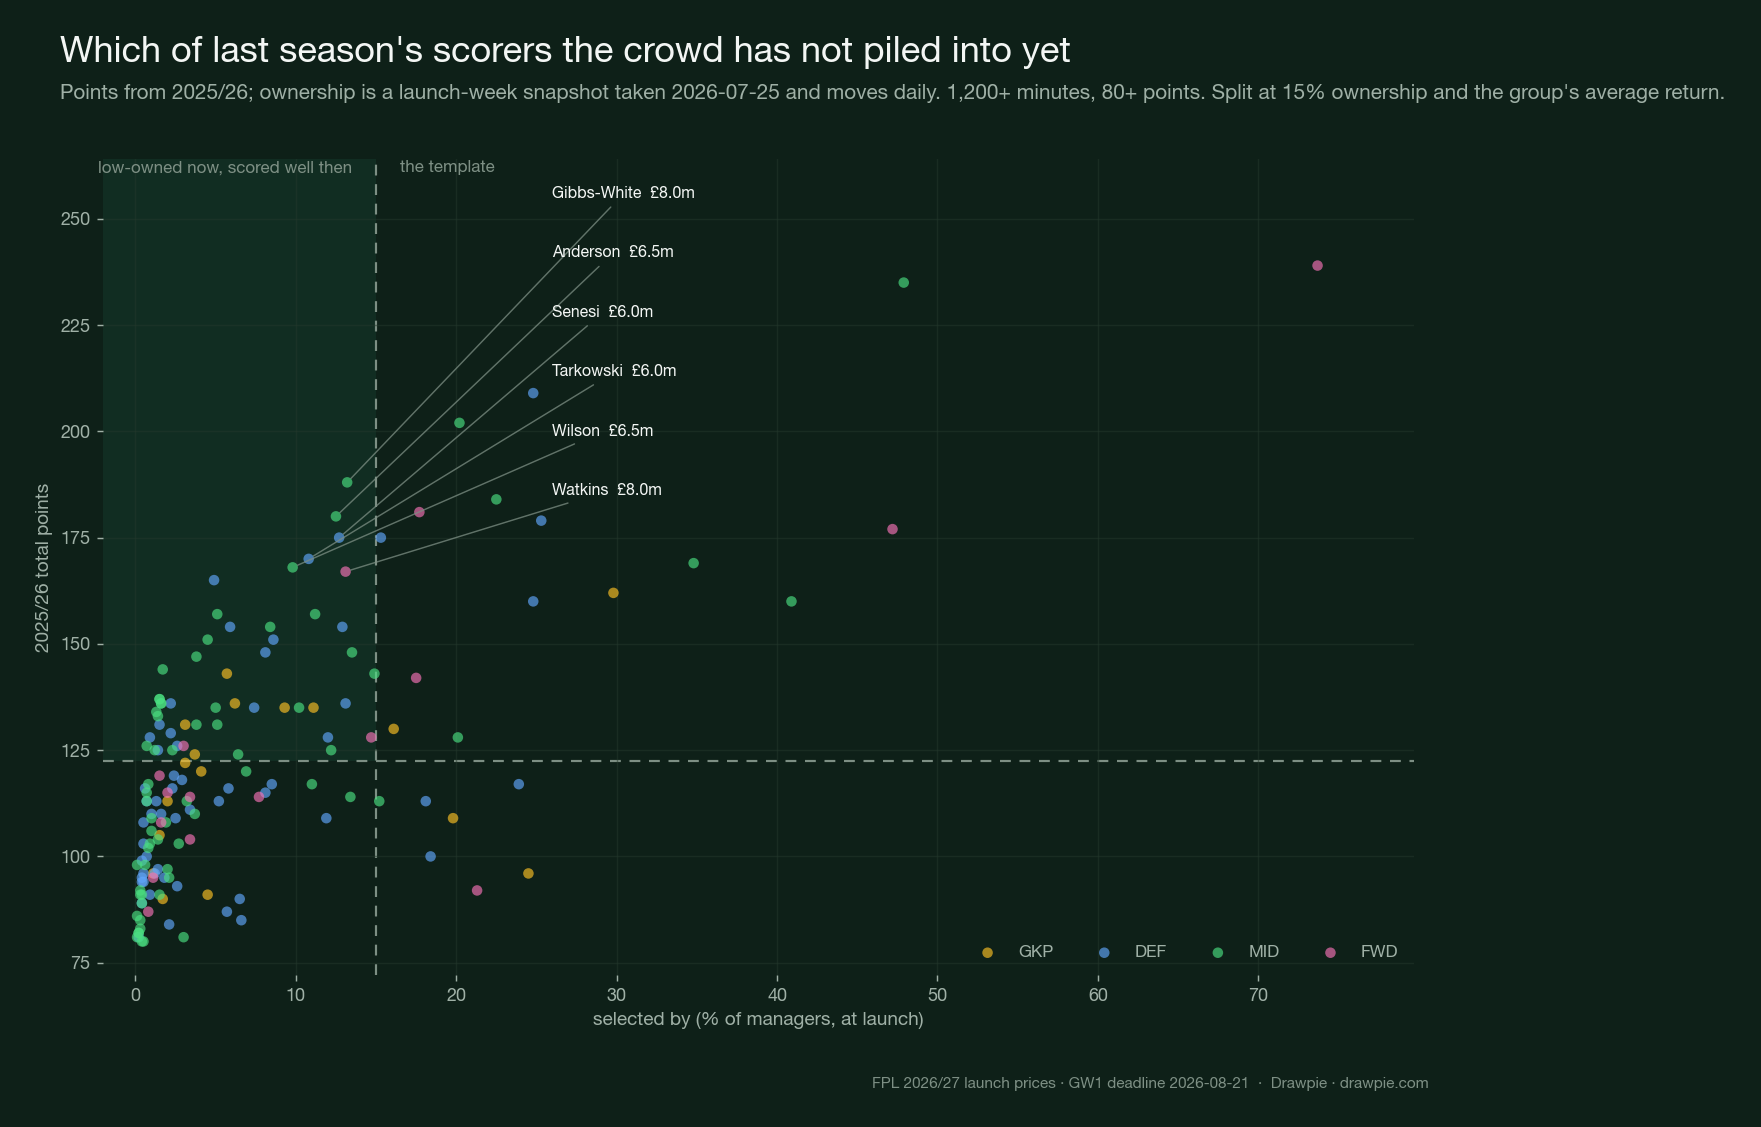
| Low-owned now, scored well last season | Club | Price | 2025/26 pts | Owned (19 Aug) |
|---|---|---|---|---|
| Gibbs-White | NFO | £8.0m | 188 | 11.9% |
| Anderson | MCI | £6.5m | 180 | 9.2% |
| Senesi | TOT | £6.0m | 175 | 9.3% |
| Tarkowski | EVE | £6.0m | 170 | 9.4% |
| Wilson | LEE | £6.5m | 168 | 7.1% |
| Watkins | AVL | £8.0m | 167 | 12.1% |
Two limits before reading it. The ownership figures are a snapshot taken on 19 August 2026 and move every day — they will not match the game exactly by the time you read this. And the horizontal axis is ownership now, in launch week 2026/27, against points from last season. It shows which of last season’s producers the crowd has not yet piled into — it does not show that they were differentials while they were scoring. A player can be lightly owned today precisely because everyone already knows what happened.
With that said: a differential is only worth having if it is good. The quadrant makes that concrete: the top-left corner is players who returned above the group average while owned by under 15% of managers, and those are the picks that actually move your rank. Everything in the bottom-left is simply a player most people correctly ignored.
One thing has changed since launch week and it lands inside our own squad. At launch Haaland was the only player owned by more than half the game; João Pedro has since crossed 50% too, and is now at 60.9% — and he is in the solved fifteen. The squad the optimiser hands you is no longer purely contrarian at the sharp end.
Note which way the two have moved in the fortnight to 19 August. Haaland is down, from 73.7% to 70.0%. João Pedro is up. Nothing in this article’s arithmetic caused that and nothing in it predicts where either goes next — but if you are weighing how big a differential you are taking, take the number from the game on the day you pick, not from any article.
The template exists for a reason — the heavily owned players are usually heavily owned because they score. The question is never “template or differential” in the abstract, it is how many differentials you can carry before a quiet week from all of them costs you more than the good ones win.
Who should you captain in GW1?
Bruno Fernandes, on last season’s return weighted by how kind the opening fixture is — not Haaland.
The calculation is deliberately narrow: points per ninety minutes last season, scaled by the game’s own GW1 difficulty rating, as PP90 × (6 − FDR) ÷ 5. Both inputs are published figures — but combining them into a shortlist for a match that has not happened is a forward-looking heuristic, and calling it anything else would be a dodge. It is a starting point with its working shown, not a projection engine, and not a claim about what will happen on 21 August.
| Player | Club | Price | Pts per 90 | GW1 fixture | Score |
|---|---|---|---|---|---|
| B. Fernandes | MUN | £12.0m | 6.90 | Hull (A), FDR 2 | 5.52 |
| Gabriel | ARS | £8.0m | 6.84 | Coventry (H), FDR 2 | 5.47 |
| Saka | ARS | £9.5m | 6.37 | Coventry (H), FDR 2 | 5.10 |
| Dorgu | MUN | £6.0m | 5.94 | Hull (A), FDR 2 | 4.75 |
| Merino | ARS | £6.0m | 5.89 | Coventry (H), FDR 2 | 4.71 |
| Isidor | SUN | £5.5m | 5.80 | Ipswich (A), FDR 2 | 4.64 |
| Calafiori | ARS | £5.5m | 5.78 | Coventry (H), FDR 2 | 4.62 |
| Haaland | MCI | £15.5m | 7.28 | Bournemouth (H), FDR 3 | 4.37 |
Haaland ranks eighth on this measure, and the reason is worth spelling out because it is easy to get backwards. He has the best raw return in the game — 7.3 points per ninety, more than anyone above him. But Manchester City’s GW1 fixture is rated 3, not 2.
That surprises people who have just read the heatmap, where Bournemouth have the league’s worst opening six starting with this same fixture. Both are true, because difficulty is rated from each team’s own side of the tie: Bournemouth away at City is a 5 for Bournemouth, and City at home to Bournemouth is a 3 for City. A fixture that is brutal for one team is not automatically a gift for the other — the ratings are not symmetric, and reading one team’s row as if it described the opponent is the most common way to misuse the table.
Two things the calculation cannot know. It does not know who is fit on 21 August, and it does not know who is starting — 6.0 points per ninety is worth nothing from the bench. Check the pressers before you set the armband.
When is the FPL 2026/27 GW1 deadline?
17:30 UTC on Friday 21 August 2026 — 18:30 BST, before the opening match of the season. Transfers are unlimited until that moment, so nothing you pick today costs anything to change, and prices do not move until it passes — after the deadline they change at midnight UK time. Gameweek 2 follows a week later, at the same time on 28 August.
How we verified this
Written 25 July 2026 (UTC), 27 days before the GW1 deadline, and last re-run against a live snapshot on 19 August, two days before it. Prices are locked until the deadline, so the solved squad has not moved; availability and ownership have, and every figure carrying an “as of” date on this page is the 19 August one.
ALL PLAYER AND FIXTURE DATA IS FIRST-PARTY, pulled directly from the Fantasy Premier League game’s own public API — the same endpoints the official site runs on — rather than from any fantasy-advice site. Prices are the 2026/27 launch prices. Points, minutes, expected goals and expected assists are 2025/26 figures, which is what the API carries before a ball is kicked this season. Fixture difficulty is the game’s own rating, not ours. Ownership is the launch-week figure and will move daily.
THE OPTIMISATION FIGURES ARE PROVEN OPTIMA, and were wrong when this piece first published. The original used a greedy fill plus a hill-climb and reported its output as the maximum; a same-cost swap beat it by 18 points, and it also failed to find any fifteen containing both premiums, which the article then printed as “no legal squad exists”. One exists at £89.0m. All four figures are now from an exact dynamic programme with the three-per-club cap resolved by full branching, and every returned squad was checked for fifteen distinct players. A heuristic that finds nothing has proved nothing — that was the real error, not the arithmetic.
🔴 THE OPTIMISATION FILTER IS OURS, NOT THE GAME’S. Every squad total on this page is the best buyable from currently available players with at least 900 minutes in 2025/26 — 224 of the 481 available, on the 19 August snapshot. The 900-minute floor and the availability check are our choices, made so the optimiser cannot fill a squad with players who did not play; neither is an FPL rule. Widening the pool to all 481 does not move the unforced optimum: it is 2,603 either way, proven on both pools. An earlier version of this page said the wider pool gained roughly three points, which was wrong. What the filter does change is the cheapest fifteen holding both premiums, £89.0m inside it. Whenever this page says “under every squad rule” it means the budget, the 2/5/5/3 split and the three-per-club cap — the filter is stated separately because it is not one of them.
⚠️ THESE TOTALS SUM ALL FIFTEEN PLAYERS. In a normal gameweek only the starting eleven score, so the gaps compare squads rather than measuring points anyone would have banked.
ONE FIELD WAS DELIBERATELY NOT USED. The API publishes an “expected points next gameweek” value that would have made an easy projection axis. Pre-season it is a placeholder: the whole player list shares 25 distinct values, clustered on 1.0, 1.5, 1.7 and 2.0, and the most expensive forward in the game carries the same figure as a rotation defender. Presenting it as projected points would have dressed a placeholder as a forecast, so every chart here plots figures that have already happened instead.
WHAT THIS DATA CANNOT SEE is the summer. A player who has changed club, lost his place, returned from a long injury or been handed set-pieces carries a 2025/26 number that either flatters or unfairly punishes him, and the API’s price is the only thing in the record that reflects 2026/27 at all. Team news between now and 21 August will matter more than anything on this page — and it is already the biggest mover here. Between 6 and 19 August the number of available players fell from 512 to 481 while the number in the game rose from 570 to 592.
THE PREMIER LEAGUE LINE-UP for 2026/27 in the fixture data includes Coventry, Hull, Ipswich, Leeds and Sunderland. Those are the fixtures the game itself has loaded, and the difficulty ratings are the game’s own.