Alphabet's Free Cash Flow Turned Negative for a Quarter: What GOOG's Q2 Showed

- Q2 free cash flow came in at −$5.855bn, as capex of $44.9bn ran ahead of $39.1bn of operating cash flow — a swing of $11.2bn from +$5.3bn a year earlier.
- This is one quarter, not a trend in the cash balance: Alphabet’s own disclosure puts trailing-twelve-month free cash flow at +$53.273bn, and the first half of 2026 at +$4.261bn.
- The reported EPS of $9.11 against roughly $2.90 expected is not what it looks like: a $99bn equity-securities gain contributed $6.26 of it, leaving about $2.85 once that single disclosed item is stripped out.
- Revenue and Cloud were genuinely strong — $119.8bn total, up 24%, with Cloud up 82% to $24.8bn.
- Management raised full-year capex guidance to $195–205bn and said 2027 will be higher again, so this is not a one-quarter effect.
Alphabet reported Q2 2026 results after the closing bell on Wednesday, and the headline was a 215% earnings beat: $9.11 per share against roughly $2.90 expected. The shares fell about 3% in after-hours trading anyway.
The reason both of those things are true is in the cash flow statement. Quarterly free cash flow came in at −$5.855bn — capital spending of $44.9bn against $39.1bn of cash generated by operations. And the enormous EPS beat was mostly a paper gain on investments, not the business.
One thing to fix in place before going further, because the headline invites the wrong conclusion: this is a single quarter. On Alphabet’s own trailing-twelve-month measure, free cash flow is +$53.273bn, and the first half of 2026 is +$4.261bn. The company is not burning cash. A quarter of unusually heavy building outran a quarter of cash generation.
Figures below were checked on 23 July 2026; market data is as of the 22 July close, the most recent session. This article is for information and education only. It is not investment advice, and not a recommendation to buy, sell, or hold any security.
What did Alphabet actually report?
| Metric | Q2 2026 | Change |
|---|---|---|
| Revenue | $119.8bn | +24% YoY |
| Google Cloud revenue | $24.8bn | +82% YoY |
| Search revenue | $63.3bn | +17% YoY |
| Operating income | $40.8bn | +30% YoY |
| Operating margin | 34% | — |
| Cloud operating profit | $8.81bn | more than tripled |
| Capital expenditure | $44.924bn | +100% from $22.446bn |
| Operating cash flow | $39.1bn | — |
| Free cash flow | −$5.855bn | from +$5.301bn a year earlier |
The operating business had a good quarter. Revenue growth of 24% at Alphabet’s scale is not a small thing, and Cloud growing 82% to $24.8bn — with operating profit more than tripling — is the fastest part of the company doing what shareholders have been waiting years for. Cloud accounted for 63% of the entire increase in operating income.
Google Cloud’s backlog — customer commitments contracted but not yet recognised as revenue — passed $514bn, over $500bn for the first time. That is the strongest single argument that the spending has something behind it. Two caveats worth keeping attached to the number: it is Cloud’s backlog specifically, not an Alphabet-wide figure, and a contracted commitment is not a guarantee of cash, margin, or of when it converts.
Why did free cash flow go negative?
Because capital expenditure was 115% of operating cash flow. That is the whole mechanism:
Operating cash flow      $39.1bn
Capital expenditure     −$44.9bn
─────────────────────────────────
Free cash flow           −$5.8bn
Revenue, operating income and operating cash flow all grew strongly. The quarterly figure turned negative because capital expenditure grew faster still — Alphabet generated $39.1bn of cash from operations and spent more than that on infrastructure in the same three months. That is a statement about the relative growth rates of two lines, not a verdict on how the business ran.
The year-on-year comparison is clean once you take it from the company’s own figures rather than from secondary summaries:
| Q2 2025 | Q2 2026 | Change | |
|---|---|---|---|
| Operating cash flow | $27.747bn | $39.069bn | +41% |
| Capital expenditure | $22.446bn | $44.924bn | +100% |
| Free cash flow | +$5.301bn | −$5.855bn | −$11.156bn |
Operating cash flow grew 41%. Capex grew 100%. The swing in quarterly free cash flow is $11.2bn in a single year.
Alphabet publishes its own trailing free cash flow table, and it is more informative than the single quarter on its own:
| Quarter | Operating cash flow | Capex | Free cash flow |
|---|---|---|---|
| Q3 2025 | $48.414bn | $23.953bn | +$24.461bn |
| Q4 2025 | $52.402bn | $27.851bn | +$24.551bn |
| Q1 2026 | $45.790bn | $35.674bn | +$10.116bn |
| Q2 2026 | $39.069bn | $44.924bn | −$5.855bn |
| Trailing twelve months | $185.675bn | $132.402bn | +$53.273bn |
Two readings come out of that table, and both are fair.
The direction is consistent. $24.5bn, $24.6bn, $10.1bn, −$5.9bn. Free cash flow has fallen in each of the last three quarters, and the quarter that turned negative is the continuation of a line rather than a one-off.
The level is still comfortable. Trailing twelve-month free cash flow of $53.3bn is a large positive number. Anyone reading “free cash flow went negative” as “Alphabet is running out of money” has the wrong picture. Alphabet was not the only large company to print a negative quarter on that line: Tesla did it too , for reasons that have nothing to do with datacentres.
Several outlets describe this as Alphabet’s first negative quarterly free cash flow since going public. That is consistent with everything we can see, though we have not verified it against the full filing history ourselves.
Was the EPS beat real?
This is the part that explains the share price better than anything else.
| Per share | |
|---|---|
| Reported GAAP diluted EPS | $9.11 |
| Disclosed after-tax effect of the equity-securities gain | −$6.26 |
| GAAP EPS excluding that one item | ≈ $2.85 |
| Analyst consensus | $2.88–$2.91 depending on the data provider |
Alphabet booked a $99.031bn net gain on equity securities, which the company describes as primarily unrealised increases in the value of its investment holdings. The after-tax effect was $77.1bn on net income and $6.26 on diluted EPS.
Strip out that one disclosed item and the figure lands at roughly $2.85, against a consensus of about $2.88–$2.91 — slightly under, rather than 215% over. The same adjustment has been made elsewhere against a $2.89 consensus.
Three things need saying precisely here, because it is easy to overclaim:
- This is not “operating EPS”. $2.85 is GAAP diluted EPS excluding one disclosed line. It still contains interest income, foreign exchange, debt securities, equity-method investments, other income and expense, and tax. Calling it the earnings power of the advertising and cloud businesses would be going further than the arithmetic supports.
- Alphabet did not publish an adjusted EPS. The subtraction is ours, not the company’s.
- The gain is largely, not entirely, unrealised. The disclosure covers both realised and unrealised amounts and says the gain is primarily the latter — so it is largely non-cash, but “none of it is cash” would be wrong. What is fair to say is that it cannot be reliably treated as recurring — gains and losses on these holdings will appear again, but the amount is highly volatile and can reverse — and that it says nothing about how the operating businesses performed.
How did the stock react?
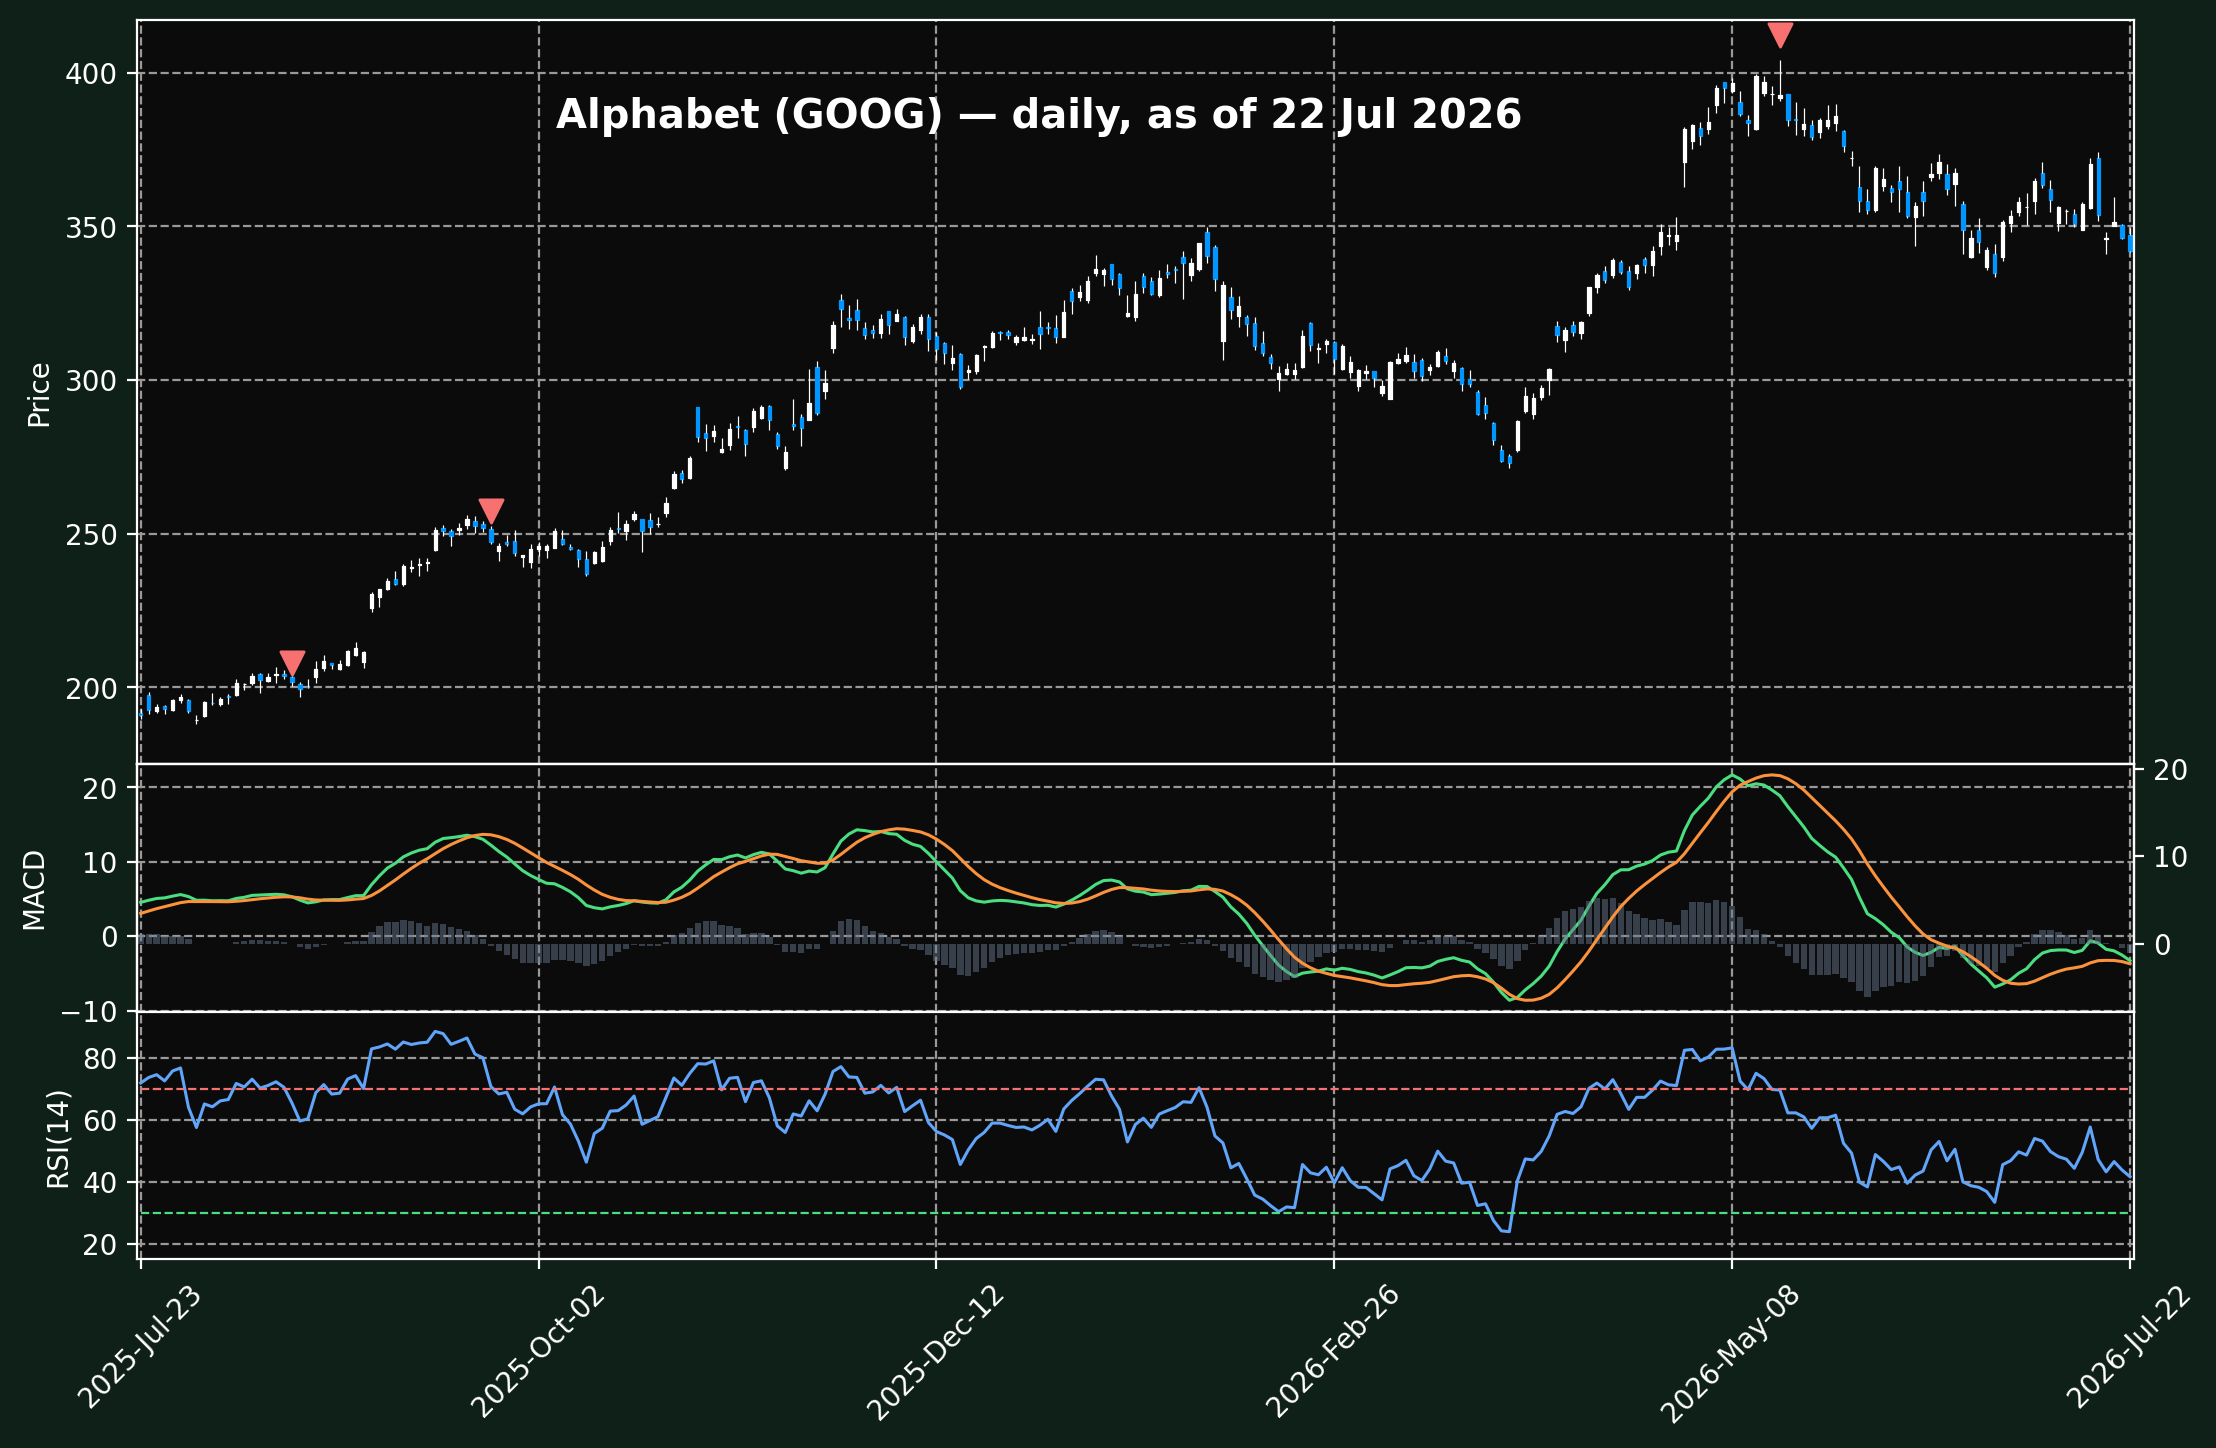
| Reading (to the 22 July close, the last completed session) | Value |
|---|---|
| Close, 22 Jul (before results) | $341.91, −1.2% |
| After-hours, shortly after the release | about −3% |
| Move, past five sessions | −7.6% |
| 52-week high | $404.47 (18 May 2026, unadjusted intraday) |
| Distance from that high | −15.5% |
| RSI (14) | 41.7 |
| Bearish MACD crosses marked (▼) | 19 Aug 2025 · 24 Sep 2025 · 18 May 2026 |
| Bullish crosses meeting our oversold filter (▲) | none in the period |
Technical illustration based on historical prices to the 22 July 2026 close — the last completed session. MACD and RSI are lagging indicators, frequently produce false signals, do not predict future prices, and are not trading signals.
Method, so the markers can be reproduced: indicators are calculated on dividend-adjusted closes from Yahoo Finance; MACD is EMA(12) − EMA(26) with a 9-period signal line, EMAs seeded from the first observation (adjust=False); RSI is the Wilder 14-period form. A ▼ is drawn only where a bearish MACD cross coincides with RSI above 65, and a ▲ only where a bullish cross coincides with RSI below 35 — which is why there are no ▲ markers in this period. The 52-week high is quoted from unadjusted prices, which is what quote screens show; on dividend-adjusted data the same high prints as $404.23. Indicators are computed on two years of data and then trimmed to the plotted year — EMA and Wilder RSI are seeded from the first observation, so the opening weeks of any series are warm-up artefacts that can produce spurious markers.
The sequence matters here, and it is easy to get backwards. Alphabet released the results after the closing bell. So the regular-session decline of 1.2% on 22 July happened before the market had seen any of this — it is not the reaction to the numbers. The reaction was in extended trading, where the shares fell roughly 3% following the capital-expenditure update.
Published figures for the move look contradictory but mostly are not. Reports of ~1.5%, ~3%, ~5% and ~7% are variously the regular session, after-hours, the GOOGL share class rather than GOOG, and the five-session move — different windows, not competing claims.
⚠️ Everything above stops at the 22 July close, the last completed session at the time of writing. The 23 July session was still running when this was published and the shares were trading materially lower — but an in-progress price is not a close, and quoting one as if it were is how a number that keeps moving ends up presented as settled.
Describing what the chart shows, without extending it into a prediction: price is roughly 15% below the May high, RSI at 41.7 sits in the lower half of its range but well above the conventional 30 oversold line, and the most recent marked bearish MACD cross came in mid-May, near the top of the move. There are no bullish crosses in the period that also met our oversold condition.
What did management say about the spending?
Full-year 2026 capex guidance was raised to $195–205bn, up from $180–190bn. Management also said 2027 spending will be significantly above 2026.
CFO Anat Ashkenazi pointed to a disciplined return-on-investment framework and stronger demand signals as the justification.
The implication for anyone reading the cash flow statement is straightforward: this quarter’s negative free cash flow is a feature of the plan, not an accident. Guidance going up rather than down means the capex line is expected to keep running hot.
What that does to free cash flow from here is not determined, and it would be overstating it to say the measure will stay under pressure. It depends on which line grows faster. Operating cash flow grew 41% year-on-year this quarter; if it kept outpacing capex growth, free cash flow would recover even with spending at these levels. The last three quarters have gone the other way — but that is an observed trend, not a mechanism that has to continue.
How should this be read?
Setting out what is supportable from the numbers, without recommending an action either way:
The bear reading has a specific mechanism. Spending is compounding faster than the cash generation it is meant to produce. Guidance was raised, so the pressure extends beyond this quarter. And the headline EPS is inflated by a non-cash item, which makes the quarter look better than the business performed.
The bull reading also has one. $514bn of contracted, unrecognised revenue is not a projection — it is signed. Cloud growing 82% with operating profit tripling is the return already showing up. Under the accounting, infrastructure is capitalised, so heavy building depresses free cash flow at exactly the moment the assets are being created rather than earning.
What the market appears to have priced. The share reaction is consistent with investors discounting the headline beat and focusing on cash generation and the raised guidance. That is an observation about what happened, not a claim about what should happen next.
What is genuinely unresolved. Whether $195–205bn a year converts into proportional profit is not knowable from this release. The contracted backlog is evidence, not proof — and the same question hangs over every large model provider currently competing on price and capability , where the compute bills are being paid now and the returns are still being argued about.
Frequently asked questions
Did Alphabet lose money in Q2 2026?
No. Alphabet was profitable, with operating income of $40.8bn. Free cash flow — cash from operations minus capital expenditure — was negative at about −$5.9bn, which is a different measure from profit.
Why did GOOG fall if earnings beat expectations?
The reported EPS of $9.11 included $6.26 from a gain on equity investments. Excluding it, the figure lands near the $2.90 expected. Alongside that, free cash flow turned negative and full-year capex guidance was raised.
What is Alphabet’s capex guidance for 2026?
$195–205bn for the full year, raised from a previous $180–190bn. Management indicated 2027 will be higher again.
Is Alphabet burning cash?
No. The negative figure is for the June quarter alone. Alphabet’s own disclosure puts trailing-twelve-month free cash flow at +$53.273bn, and free cash flow for the first half of 2026 at +$4.261bn.
Is negative free cash flow always a problem?
Not necessarily. It means capital spending exceeded operating cash flow in the period. For a company building infrastructure it can reflect investment rather than distress — but it does reduce the cash available for buybacks, dividends and debt reduction while it lasts.
Important information
This article is for informational and educational purposes only. It is not investment, financial, legal, or tax advice, and is not a recommendation, offer, or solicitation to buy, sell, or hold any security. Nothing here is tailored to your individual circumstances.
The technical analysis shown — candlesticks, MACD (12, 26, 9), RSI, and any “tops” or “bottoms” — is one interpretation of historical price data. These indicators are heuristic and lagging, frequently produce false signals, and do not predict future prices. Past performance does not guarantee future results.
Prices and indicator values are as of the date stated and change continuously; this content may be out of date by the time you read it. All investing involves risk, including the possible loss of principal.
The author is not a licensed financial adviser or broker-dealer. Do your own research and consult a qualified, licensed financial professional before making any investment decision. Drawpie and the author accept no liability for any loss arising from the use of this content. Price data via Yahoo Finance.