2027 Super El Niño Impacts: What the Decay Year Does
Update log (2)
- — Re-dated to CPC's 10 September 2026 discussion, which supersedes the 81% a second time and schedules the next for 8 October. The very-strong probability still lives only on the 2026/27 winter forecast page, by design, so that two pages cannot drift apart on one number. Two things are added rather than changed. CPC states its historic-event threshold as +2.5 on the RONI, not the Oceanic Nino Index this page's event list and decay tables are computed from, and the two have separated - June-August reads +1.36 on the RONI against +1.80 on the ONI. This page keeps using the ONI, consistently, and now says why and links to the full working. And there are now two unrelated 75% figures attached to this El Nino: NOAA's probability that the 2026 Atlantic hurricane season finishes below normal, which this page already carried, and CPC's probability of a historic October-December event, which it does not. The hurricane section flags the collision explicitly.
- — Corrected. This page still said the next ENSO diagnostic discussion was due on 13 August 2026. It was issued that day, and the discussion itself schedules the next one for 10 September 2026 - both sentences now say so. The 81 percent very-strong probability quoted here is the 9 July figure and has been superseded; the replacement stays in the 2026/27 winter forecast, which is the one article that read it, so the two pages cannot drift apart.

- 2027 is the decay year, not the peak year. NOAA’s forecasters put the peak in late 2026 and give a 97% chance El Niño lasts into early spring 2027 — which is the horizon of their statement, not a forecast for the rest of the year.
- We pulled NOAA’s own index back to 1950. Five El Niños peaked at +2.0 or higher, and every one of them was back below the El Niño threshold by midsummer of the following year. Four of the five reached La Niña inside that same calendar year.
- The Atlantic hurricane suppression NOAA is forecasting belongs to 2026, not 2027. In 1998 — the closest analogue — NOAA’s own assessment records El Niño conditions through early May and above-normal Atlantic activity from August to November of the same year.
Search for “2027 super El Niño” and you will find a lot of confident writing about a year nobody has forecast. What NOAA has actually said stops in early spring.
That matters more than it sounds, because 2027 is not the El Niño year. 2026 is. 2027 is the year afterwards — and the record is unusually clear about what the year afterwards looks like.
What is happening right now?
NOAA has an El Niño Advisory in force, and its 9 July 2026 discussion put an 81% chance on the event reaching the “very strong” tier during October to December 2026. Two later discussions, on 13 August and 10 September, have since raised that figure — see the winter forecast for the current one.
The Climate Prediction Center’s diagnostic discussion of 9 July 2026 is the document everything else is downstream of. It says El Niño continues and will strengthen through the end of the year, with a 97% chance it persists into early spring 2027, and that a very strong event in October–December would rank among the largest since records begin in 1950. At the time it was written the weekly Niño-3.4 index stood at +1.2 °C, with the far-eastern Niño-1+2 region already at +2.7 °C.
NOAA’s own caveat is worth carrying in full, because it is the thing most coverage drops. Even the strongest El Niño events, the discussion says, do not produce the typical impact everywhere; stronger events tilt the odds further, but they tilt odds rather than deliver outcomes.
Two dates to keep. The 10 September 2026 discussion is now the current one, and it names 8 October 2026 as the date of the next; the live date is on the US weather outlook hub . NOAA’s headline winter outlook does not arrive until the autumn.
⚠️ One thing to be careful of when reading about this event elsewhere. The 10 September discussion states its “historic event” threshold as +2.5 °C on the RONI, not on the Oceanic Niño Index this page’s tables are built from. The two indices have separated — June–August reads +1.36 on one and +1.80 on the other — so a peak figure quoted in one is not comparable to a threshold stated in the other. The winter forecast page works that through in full . Everything below uses the ONI, consistently, and says so.
Is a “super El Niño” an official category?
No. NOAA’s published tiers stop at “very strong”.
The Climate Prediction Center classifies events as weak, moderate, strong or very strong, using the Oceanic Niño Index — a three-month running mean of sea surface temperature anomalies in the Niño-3.4 region. “Super El Niño” is a media and forecaster shorthand with no fixed threshold behind it, which is why different articles apply it to different lists of years.
For this article we use +2.0 °C on the ONI as the cut, applied to the peak of each event. That is the conventional line for the very strong tier, and it produces a list that is longer than the one you usually see.
| Event | Peak ONI | Peak season |
|---|---|---|
| 2015–16 | +2.75 | Nov–Jan |
| 1997–98 | +2.40 | Oct–Dec |
| 1982–83 | +2.23 | Nov–Jan |
| 1972–73 | +2.12 | Nov–Jan |
| 2023–24 | +2.06 | Nov–Jan |
Most “super El Niño” lists name three: 1982–83, 1997–98 and 2015–16. On NOAA’s own index there are five at or above +2.0, and two of them are missing from the usual telling — 1972–73, and the event most people have actually lived through, 2023–24.
What does the decay year look like?
Every one of the five was back below the El Niño threshold by midsummer of the following year, and four of the five had reached La Niña before that year was out.
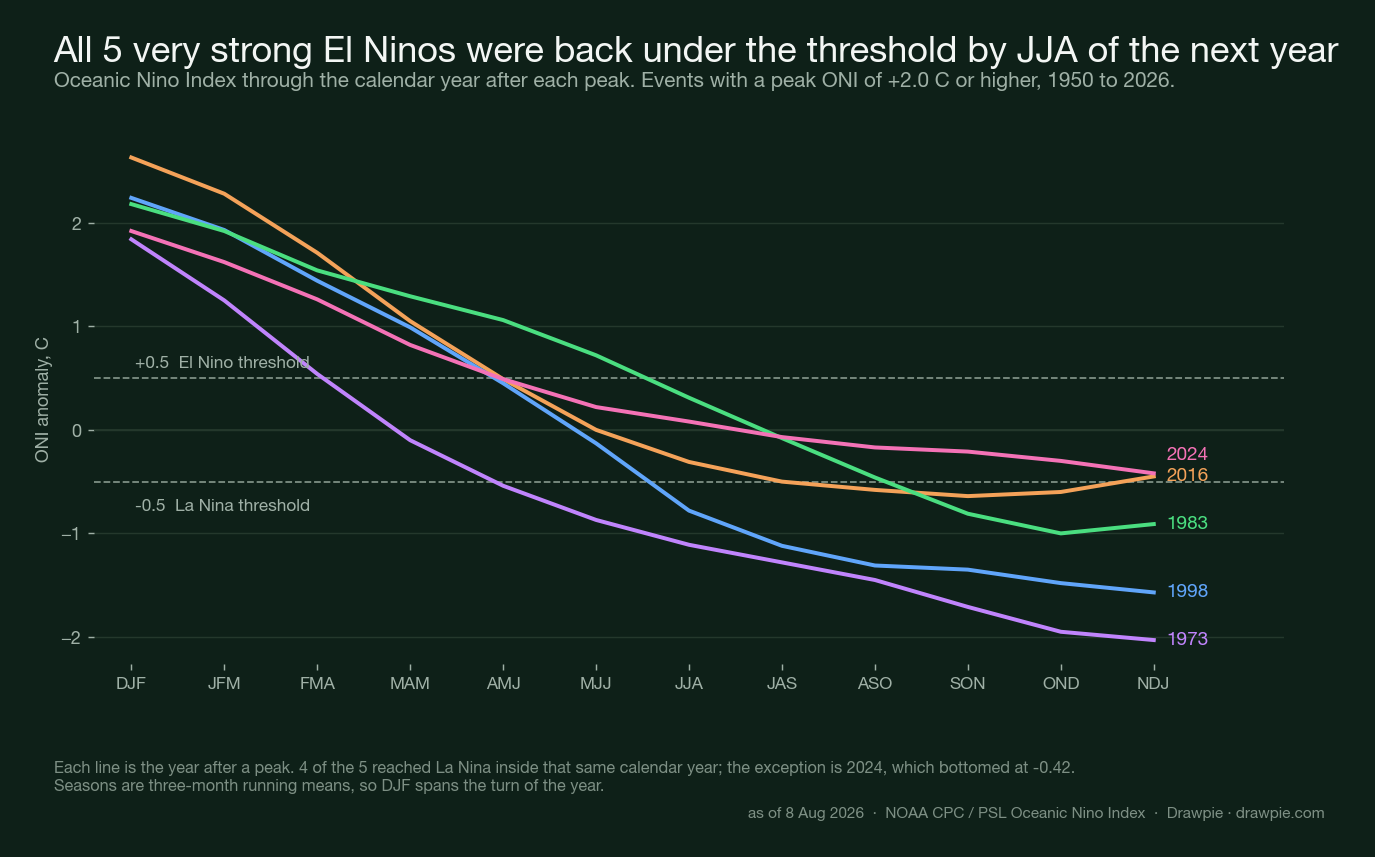
| Decay year | Under +0.5 by | La Niña by |
|---|---|---|
| 2016 | Apr–Jun | Aug–Oct |
| 1998 | Apr–Jun | Jun–Aug |
| 1983 | Jun–Aug | Sep–Nov |
| 1973 | Mar–May | Apr–Jun |
| 2024 | Apr–Jun | Never — bottomed at −0.42 |
Read the chart as a shape rather than as five separate histories. Each of these years opened with the ocean still near its peak — between +1.84 and +2.63 in January — spent the first quarter unwinding, crossed back under the El Niño line somewhere between March and August, and finished cooler than it started. In four cases the swing carried past neutral into a La Niña.
That is what makes a question about “2027 impacts” different from a question about this winter. The El Niño signal that shapes a US winter is doing its work in January, February and March. By the time 2027 has a summer, the ocean state that produced the winter has, in every past case at this strength, already gone.
How fast does it fall apart?
Between 1.9 and 3.2 °C off the peak in roughly six months.
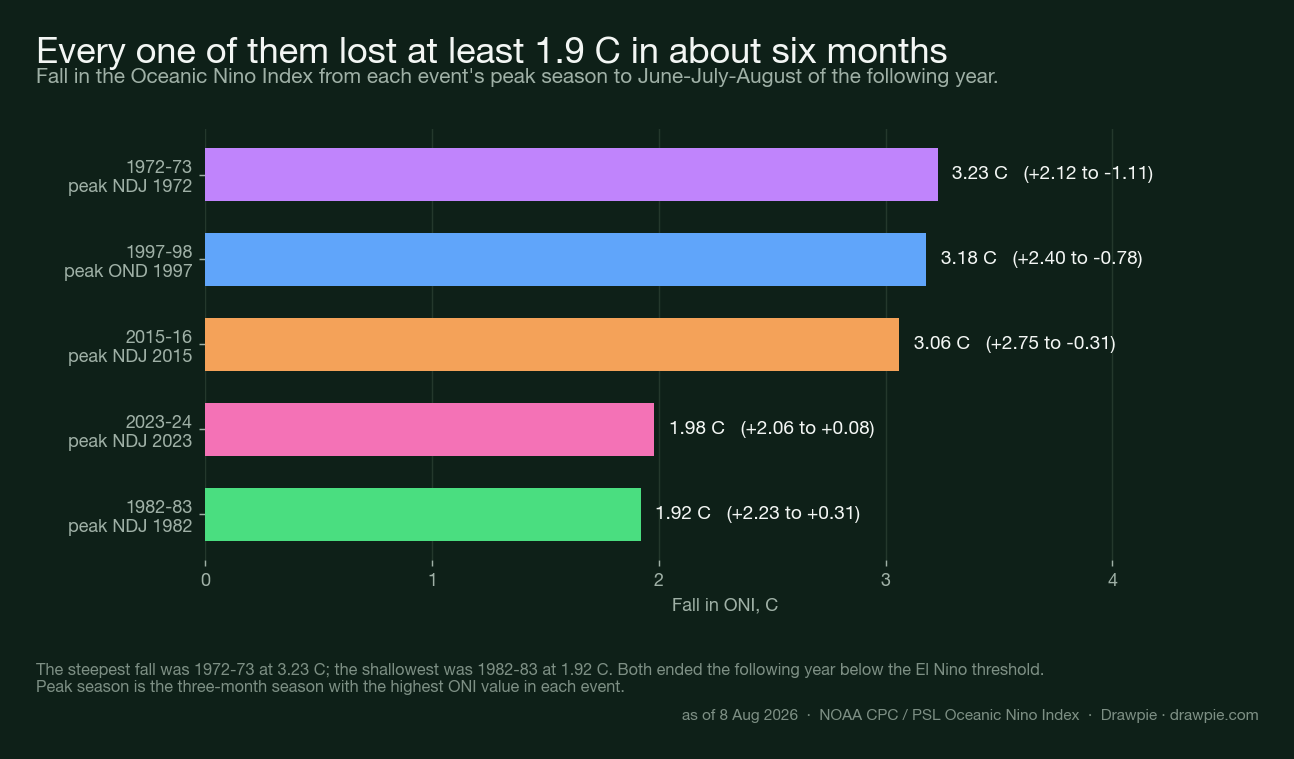
| Event | Peak to next summer | Fall |
|---|---|---|
| 1972–73 | +2.12 → −1.11 | 3.23 °C |
| 1997–98 | +2.40 → −0.78 | 3.18 °C |
| 2015–16 | +2.75 → −0.31 | 3.06 °C |
| 2023–24 | +2.06 → +0.08 | 1.98 °C |
| 1982–83 | +2.23 → +0.31 | 1.92 °C |
The three steepest falls are the three that ended in a solid La Niña. The two shallowest — 1982–83 and 2023–24 — were still hovering near neutral in midsummer, and 2024 never quite got to La Niña at all.
That split is the useful part. The speed of the collapse, not the height of the peak, is what decides whether the second half of the following year behaves like a warm event, a neutral one or a cold one. And the speed is not something the peak tells you in advance: the tallest event on record, 2015–16, fell less far than 1972–73, which peaked more than half a degree lower.
What happened in 1983, 1998 and 2016?
The closest documented analogue is 1998, and NOAA wrote it up itself. Its annual climate assessment for that year is titled, in effect, the story this article is about: the strong 1997–98 El Niño and the transition to a La Niña episode.
That assessment records El Niño conditions continuing from January into early May 1998 and La Niña conditions from July through the rest of the year. The US impacts it lists for the El Niño half of the year include a wet and stormy winter across the southern tier and California, an extremely mild winter and spring across North America with record temperatures in places, and — for the following spring into summer — record heat and drought across the south-central United States during April to June.
Then the sign flips. Among the impacts NOAA attributes to the La Niña conditions in the second half of that same year is above-normal tropical storm and hurricane activity across the North Atlantic from August to November.
One calendar year, both extremes, in NOAA’s own accounting. That is the single most useful thing to know about a decay year: it is not one weather regime, it is two, with the handover somewhere around midyear.
1983 and 2016 fit the same frame with different timing. 1983 decayed slowly — still weakly warm in midsummer at +0.31, only reaching La Niña in the autumn. 2016 crossed under the threshold in late spring and was in La Niña territory by August. The winters at the front of those years belonged to the El Niño; the second halves did not.
What about the 2027 hurricane season?
The suppression NOAA is currently forecasting applies to the 2026 season, not 2027 — and there is no 2027 outlook to quote.
NOAA’s updated Atlantic outlook, issued on 6 August 2026, keeps a below-normal call for this season: 7 to 13 named storms, of which 2 to 6 could become hurricanes, including 0 to 2 major hurricanes, against a typical season of 14, 7 and 3. The probabilities are 75% below-normal, 20% near-normal and 5% above-normal. Two named storms had formed by then, Arthur and Bertha, and no hurricanes.
🔴 There are now two different 75% figures in circulation about this El Niño and they have nothing to do with each other. The one above is NOAA’s probability that the 2026 Atlantic hurricane season finishes below normal, from a hurricane outlook issued on 6 August. The other, from CPC’s ENSO discussion of 10 September, is the probability that October–December produces a historic event on the RONI. Same number, different agency product, different subject, different date. If you see “NOAA says 75%” without which one it means, it is worth finding out.
The reason is the mechanism everything here turns on. El Niño strengthens upper-level westerly winds over the tropical Atlantic, which increases vertical wind shear and tears developing storms apart before they organise. NOAA’s lead hurricane forecaster, Matt Rosencrans, put it plainly in that release: when El Niño emerges it usually becomes the dominant factor in total hurricane season activity, and other mechanisms matter less against a mature event.
Now apply the decay table. The 2027 Atlantic season runs June to November. In every one of the five analogues, the ONI was already below the El Niño threshold by then — and in three of the five it was in La Niña territory, which is the state associated with the opposite effect. NOAA’s own 1998 assessment is the worked example: El Niño through early May, above-normal Atlantic activity August to November.
What that does not license is a 2027 forecast. Atlantic seasons are not decided by ENSO alone — Atlantic sea surface temperatures and the West African monsoon are both in NOAA’s own list of factors, and the 2026 release explicitly weighs them. NOAA issues its Atlantic outlook in late May each year. There is no 2027 number, from NOAA or from us.
What is not forecast yet?
Most of 2027. It is worth being exact about where the official record stops, because that boundary is where confident writing about “2027 impacts” starts.
| Question | What NOAA has said, and when it said it |
|---|---|
| Does El Niño last into early spring 2027? | 97% chance, from the 9 July 2026 discussion |
| Does it reach very strong in Oct–Dec 2026? | 81% on 9 July; the 13 August and 10 September 2026 discussions each raised it, and the current figure is in the winter forecast rather than here |
| What does the 2026/27 US winter look like? | Covered by the monthly long-lead seasonal outlooks; NOAA’s headline winter outlook comes in the autumn |
| What happens after early spring 2027? | Not addressed in any discussion NOAA has issued |
| Does it flip to La Niña in 2027? | No official forecast. Four of five past events at this strength did so inside the decay year |
| 2027 Atlantic hurricane season | No outlook until NOAA issues one, normally in late May |
The 10 September 2026 discussion schedules the next one for 8 October 2026 — the live date is on the US weather outlook hub — and each monthly update extends the horizon a little further. Until one of them says something about the second half of 2027, the honest answer to “what will a super El Niño do to the US in 2027” is: it will shape the first few months, the record says it will be gone by summer, and the rest is not forecast.
For what the front half of that looks like in detail — the temperature and precipitation tilts, and what the seven strongest El Niño winters actually delivered — see our 2026/2027 US winter forecast , which covers the winter this event is building towards, and the CPC temperature and precipitation outlook for the maps the agency has actually published.
Sources
Checked on 8 August 2026. The ENSO diagnostic discussion row was re-read at the source on 22 August 2026 and again on 13 September 2026, which is where the 8 October date, the RONI note and the second supersession of the 81% come from.
| Source | What it supports here |
|---|---|
| NOAA CPC — ENSO Diagnostic Discussion | The 9 July 2026 issue supports the El Niño Advisory, the 81% and 97% figures, the Niño-3.4 and Niño-1+2 values and NOAA’s caveat about impacts. The 13 August 2026 issue, read on 22 August, supports the first supersession of the 81%. The 10 September 2026 issue, read on 13 September, supports the second, the RONI wording of the historic-event threshold and the 8 October 2026 date for the next discussion |
| NOAA CPC — Relative Oceanic Niño Index | The +1.36 RONI value for June–August 2026, quoted here only to show that it is not the +1.80 this page’s own tables use |
| NOAA PSL — Oceanic Niño Index, 1950 to present | Every number in both charts and in the event, decay and fall tables — computed from this series, not quoted |
| NOAA CPC — 1998 annual climate assessment, ENSO section | The 1997–98 El Niño to La Niña transition, the US impacts listed for each half of 1998, and the above-normal Atlantic activity from August to November |
| NOAA — Atlantic hurricane season outlook update, 6 August 2026 | The 2026 storm ranges and probabilities, the season to date, the wind shear mechanism, and the Rosencrans quote |
The event list uses a peak ONI of +2.0 °C or higher as the cut for the very strong tier. Threshold crossings are the first three-month season in the decay year below +0.5 and below −0.5 respectively.
How we verified this
The index is ours, the odds are NOAA’s. Every figure about the five very strong events — peaks, decay curves, threshold crossings, the falls from peak to the following summer — is computed from NOAA’s Oceanic Niño Index series back to 1950, not quoted from a write-up. The forward-looking numbers (81%, 97%) are quoted from the Climate Prediction Center’s 9 July 2026 diagnostic discussion and are theirs, not ours.
The 81% has since been superseded twice, and this page still does not restate the replacement. The 13 August and 10 September 2026 discussions each raised the very-strong probability; that figure lives in the 2026/27 winter forecast , which is the one article that reads it. Two pages cannot disagree about a number only one of them is allowed to say. Corrected on 22 August 2026, when this page still described the 13 August discussion as upcoming, and re-dated on 13 September 2026 after the September discussion. Two unrelated 75% figures now exist and the page separates them explicitly. NOAA’s 6 August hurricane outlook gives a 75% chance the 2026 Atlantic season finishes below normal. CPC’s 10 September ENSO discussion gives a 75% chance of a historic October-December event. They are different products about different things and the coincidence is worth flagging rather than letting a reader merge them. The tables here are ONI and the CPC threshold is RONI, and that is stated rather than reconciled. This page’s event list, decay curves and threshold crossings all come from the Oceanic Nino Index, which is the series with a continuous record back to 1950 for the comparisons being made. CPC’s “+2.5 for a historic event” is a RONI figure, and for June-August 2026 the two read +1.80 and +1.36. Rather than restate one page’s number on another, the difference is explained once, on the winter forecast page, and linked to from here.
No forecast here. This article does not predict what 2027 will do. It reports what NOAA has said, how far ahead they said it, what five past events actually did, and where the record stops. Where a claim about 2027 would require going past NOAA’s stated horizon, the article says so instead.
A number we checked and did not use. Search results attribute a 55% below-normal probability to NOAA’s 2026 Atlantic hurricane outlook. NOAA’s 6 August 2026 update says 75% below-normal, 20% near-normal, 5% above-normal. We read the release and used its figures.
“Super El Niño” is not NOAA’s term. The Climate Prediction Center’s published tiers top out at “very strong”. We use +2.0 on the Oceanic Niño Index as the cut for that tier and say so on the chart, rather than importing an informal label with no fixed definition.
Impacts are quoted from NOAA’s own assessment, not reconstructed. The 1998 impact list comes from the Climate Prediction Center’s annual climate assessment for that year, which describes the El Niño-to-La Niña transition directly.