2026 Midterm Election Polls and Predictions: The House Forecast, and the Senate
Update log (4)
- — Removed a table of six individual generic-ballot averages. It was not sourced: the composite's publisher does not break the six out, the one aggregator we could read directly did not match the row we had given it, and the six leads formed a perfect one-tenth ladder from 7.0 down to 6.5, which is not how independent averages behave. The national figure — Democrats 48.2, Republicans 41.5, a 6.7-point lead — is the published composite and is unchanged. Gone with the table: a half-point spread across six averages, a 2.3-point spread in the levels, and an undecided range of 8.1 to 13.0 per cent.
- — Corrected the House composition. Earlier versions said five vacancies; the Clerk of the House records four, plus one independent — Kevin Kiley of California — who had been absorbed into the vacancy count by subtracting the two party totals from 435. Kiley caucuses with the Republicans, so the earlier line that they sit exactly on the majority line and would lose control on a single net loss was wrong: they command 219 votes. Three of the four vacancies were Democratic-held, so the six-seat gap is three seats taken from Republicans, not six.
- — Corrected the state map. The first version decoded the source's rating string by position against districts in FIPS order, but the string is not in FIPS order, so 21 of 50 states were misread — five with the parties exactly reversed, and North Carolina at 10 Democratic to 3 Republican when Cook has it 3 to 11. The ratings are now read from the source's per-district records. The national totals were right in the broken version too, because permuting the codes cannot change how many of each there are, which is why checking totals could never have caught it. Toss-ups sit in 14 states, not 16, and the evenly split delegations are Maine, Michigan, Minnesota and Pennsylvania.
- — Added a seat projection, then withdrew it as a single number and replaced it with a grid. Running the same rule at three definitions of 'in play' and against all three raters gives nine answers from 214 to 221 Democratic seats, three of them a majority — so the winner was being set by unstated choices rather than by any input. Eight of the nine cells would need the generic ballot to move between 6.4 and 41 points before changing hands. The published district models were added alongside for comparison: Decision Desk HQ 226 to 227 depending on which of its two same-day releases you read, Race to the WH 231, The Economist 234. Their win probabilities are deliberately not printed.

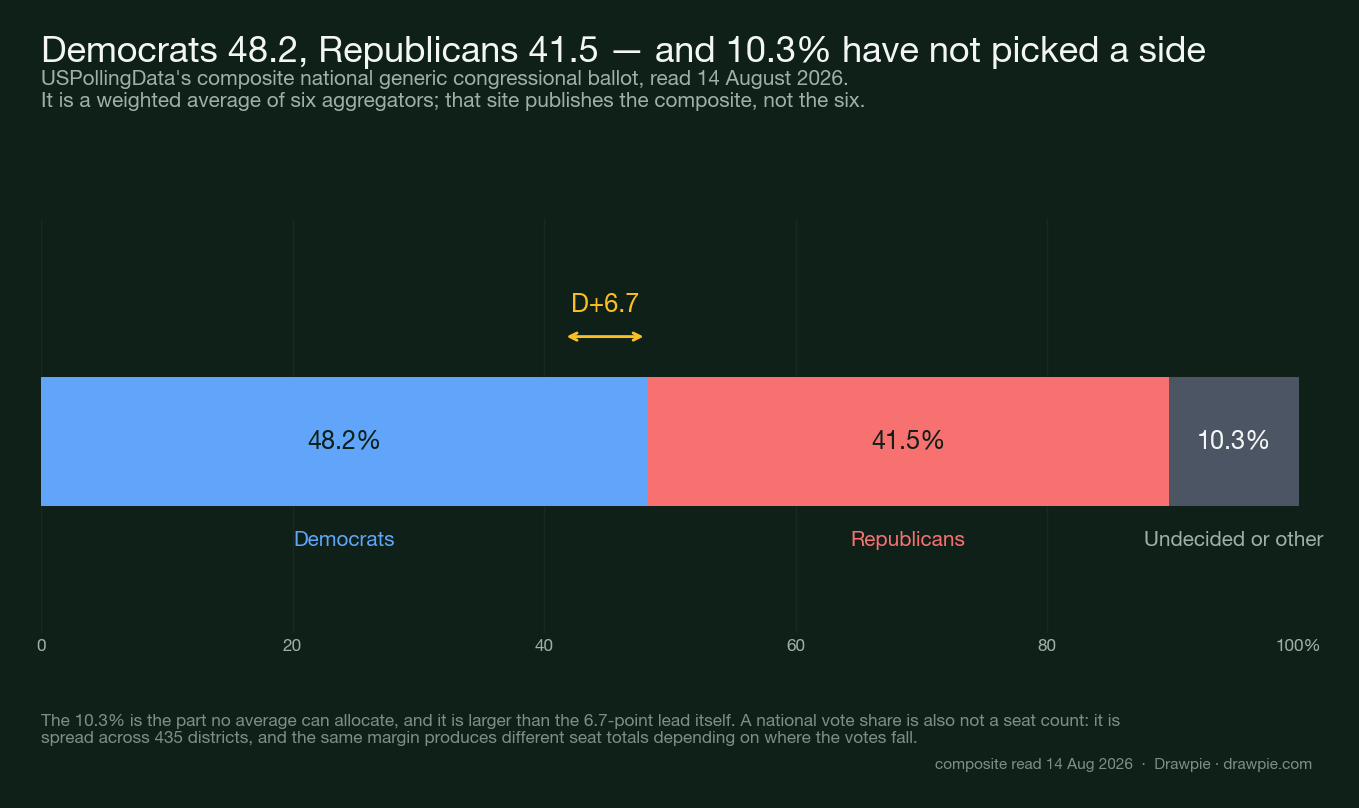
- The national number is a single composite: Democrats 48.2 to Republicans 41.5, a 6.7-point lead, read on 14 August 2026. It blends six aggregators the publisher does not break out, so treat it as one reading rather than six agreeing. The House turns on seats, not points, and nothing converts one into the other without an assumption.
- Democrats are six short of 218, but only three of those come off the Republican side. Three of the four vacancies were Democratic-held and the two runoffs with dates are Democrat-versus-Democrat, so the gap falls to four by 25 August. The independent, Kevin Kiley of California, caucuses with the Republicans, putting 219 votes there rather than 218.
- On the Cook ratings Democrats need 13 of the 19 toss-ups while Republicans need 7, so the ratings point the other way from the national numbers. And the national numbers are two rather than one: alongside the generic ballot, Pew has Trump approval at 34% in late April, down from 37% in January and 40% the previous autumn.
- Our own arithmetic gives no single answer. Three raters at three definitions of in play produce nine results from 214 to 221 Democratic seats, three of them a majority. On the narrowest reading Cook gives Republicans 220, Sabato gives Democrats 218 and Inside Elections gives Republicans 221 — four seats apart, with the majority line inside the gap.
- The Senate is a separate arithmetic problem with a much narrower path. Republicans hold it 53-47, and the August ratings leave Democrats needing to sweep all four toss-ups to reach 51 — we set that out seat by seat in our Senate guide.
The national generic ballot has Democrats ahead by 6.7 points. That is one composite figure rather than six averages agreeing — and either way, it does not tell you who wins the House.
The reason is that the House is decided by six seats, not by six points. Below is what the average actually says, where presidential approval sits, what the seat arithmetic requires, what our own arithmetic makes of the seats, and why crossing from one to the other takes an assumption rather than a calculation.
What do the 2026 generic ballot polls say?
Democrats 48.2 to Republicans 41.5, a lead of 6.7 points. That is one composite figure, published by USPollingData and read on 14 August 2026, and it is the only generic-ballot number the seat arithmetic uses.
| Measure | Share |
|---|---|
| Democrats | 48.2% |
| Republicans | 41.5% |
| Lead | D+6.7 |
| Undecided or other | 10.3% |
That composite is a weighted average of six aggregators — Decision Desk HQ, FiftyPlusOne, RealClearPolitics, Silver Bulletin, VoteHub and Race to the WH. The site that publishes it publishes the blend, not the six inputs.
One of the six is worth reading on its own. Silver Bulletin’s headline average, updated 14 August, is D+6.7 as published, and D+8.1 once it applies its likely-voter screen.
Hold on to that second number. A single aggregator’s own choice about who actually turns up moves its lead by 1.4 points — more than the distance between most published averages. And hold on to the 10.3%: the share no average can allocate is larger than the lead itself.
How many seats do Democrats need to win the House?
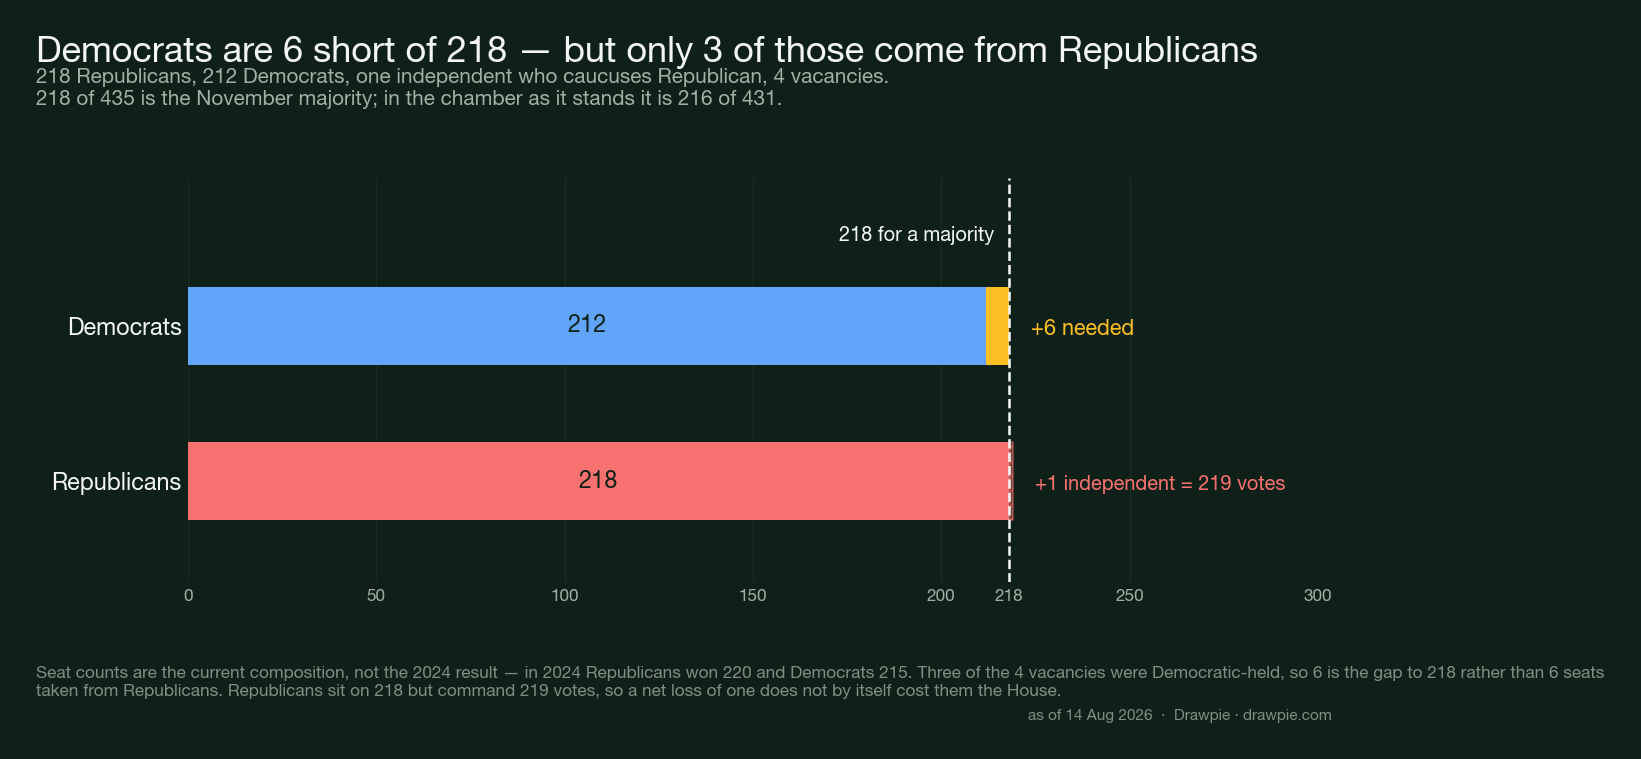
Six, on the current composition. This is the number that actually decides control, and it is smaller than the polling drama suggests.
| Measure | Seats |
|---|---|
| Total seats | 435 |
| Majority | 218 |
| Republicans now | 218 |
| Democrats now | 212 |
| Independent | 1 |
| Vacancies | 4 |
| Democrats need | +6 |
Two things worth pinning down, and the first one matters more than the six.
Six is the gap to 218. It is not six seats taken from Republicans. Three of the four vacancies were Democratic-held — Eric Swalwell’s California seat, Sheila Cherfilus-McCormick’s in Florida, and the late David Scott’s in Georgia — against one Republican, Tony Gonzales’s in Texas. Fill each with the party that held it and Democrats stand on 215. Three is the number that has to come off the Republican side, and it is the number the ratings section below is really about.
Second, Republicans are not one seat from losing control. Kevin Kiley of California sits as an independent and caucuses with them, so they command 219 votes, not 218. And in the chamber as it stands, with four seats empty, a floor majority is 216 of the 431 members sitting. The 218 used throughout this article is the November threshold, when all 435 seats are filled again.
The “seats needed” figure you see elsewhere is often not six. USPollingData states the House as 222 Republicans to 213 Democrats and puts the requirement at five. Measured against the 2024 result — Republicans 220, Democrats 215 — it is three. None of those is a different calculation; they are different starting compositions, which is why the one above is taken from the Clerk of the House and printed in full.
Which seats are actually rated for each party?
211 rated Republican, 205 rated Democratic, and 19 the raters decline to call. These are the Cook Political Report’s district ratings as of 13 August 2026 — the day Cook last moved a district, shifting CO-03, OH-10 and OH-15 from Safe to Likely Republican — read the following day and aggregated by state.
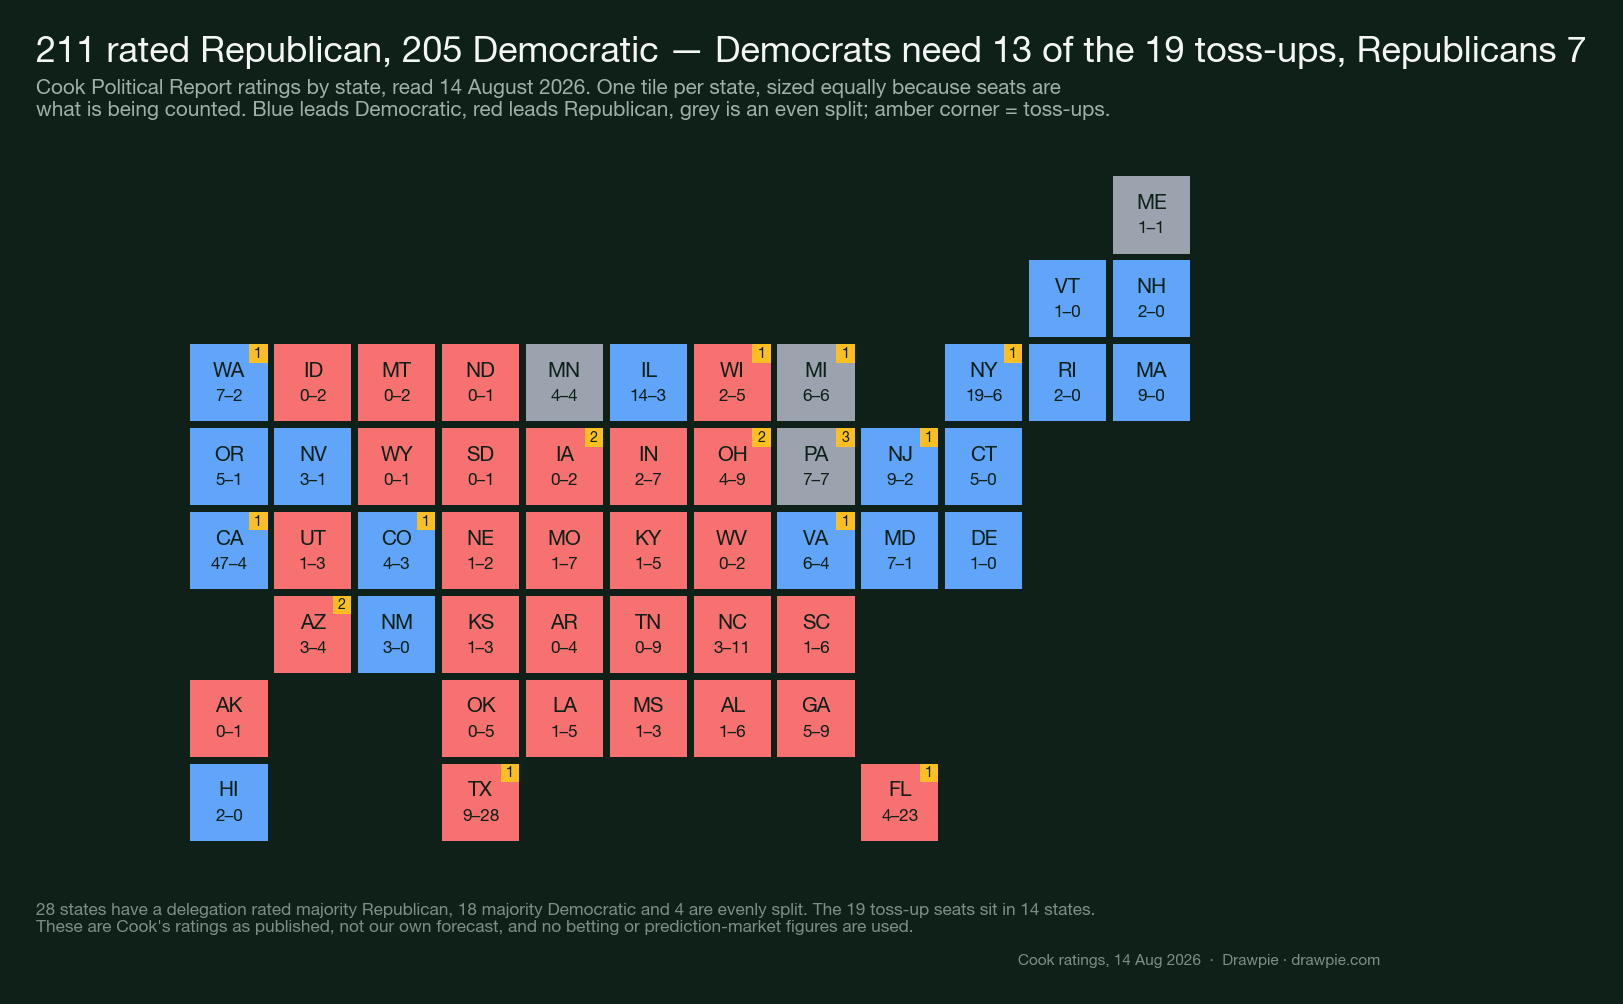
Each tile is one state, drawn the same size because what is being counted is seats, not land. Blue means the delegation is rated majority Democratic, red majority Republican, grey an even split — Maine, Michigan, Minnesota and Pennsylvania are the four even ones.
Now put those ratings next to the majority line, and the race gets much clearer:
| Side | Rated | Needs |
|---|---|---|
| Republicans | 211 | 7 of 19 |
| Democrats | 205 | 13 of 19 |
Democrats need 13 of the 19 toss-ups; Republicans need 7. That points the opposite way from the generic ballot, which is the tension in this election — but it is not the whole story either, because it assumes nothing outside the toss-ups moves. The section after next tests that assumption and finds it is the one doing the work.
The 19 toss-ups sit in 14 states, and four states carry more than one:
| State | Toss-ups |
|---|---|
| Pennsylvania | 3 |
| Arizona | 2 |
| Iowa | 2 |
| Ohio | 2 |
| 10 other states | 1 each |
Which way are the raters moving?
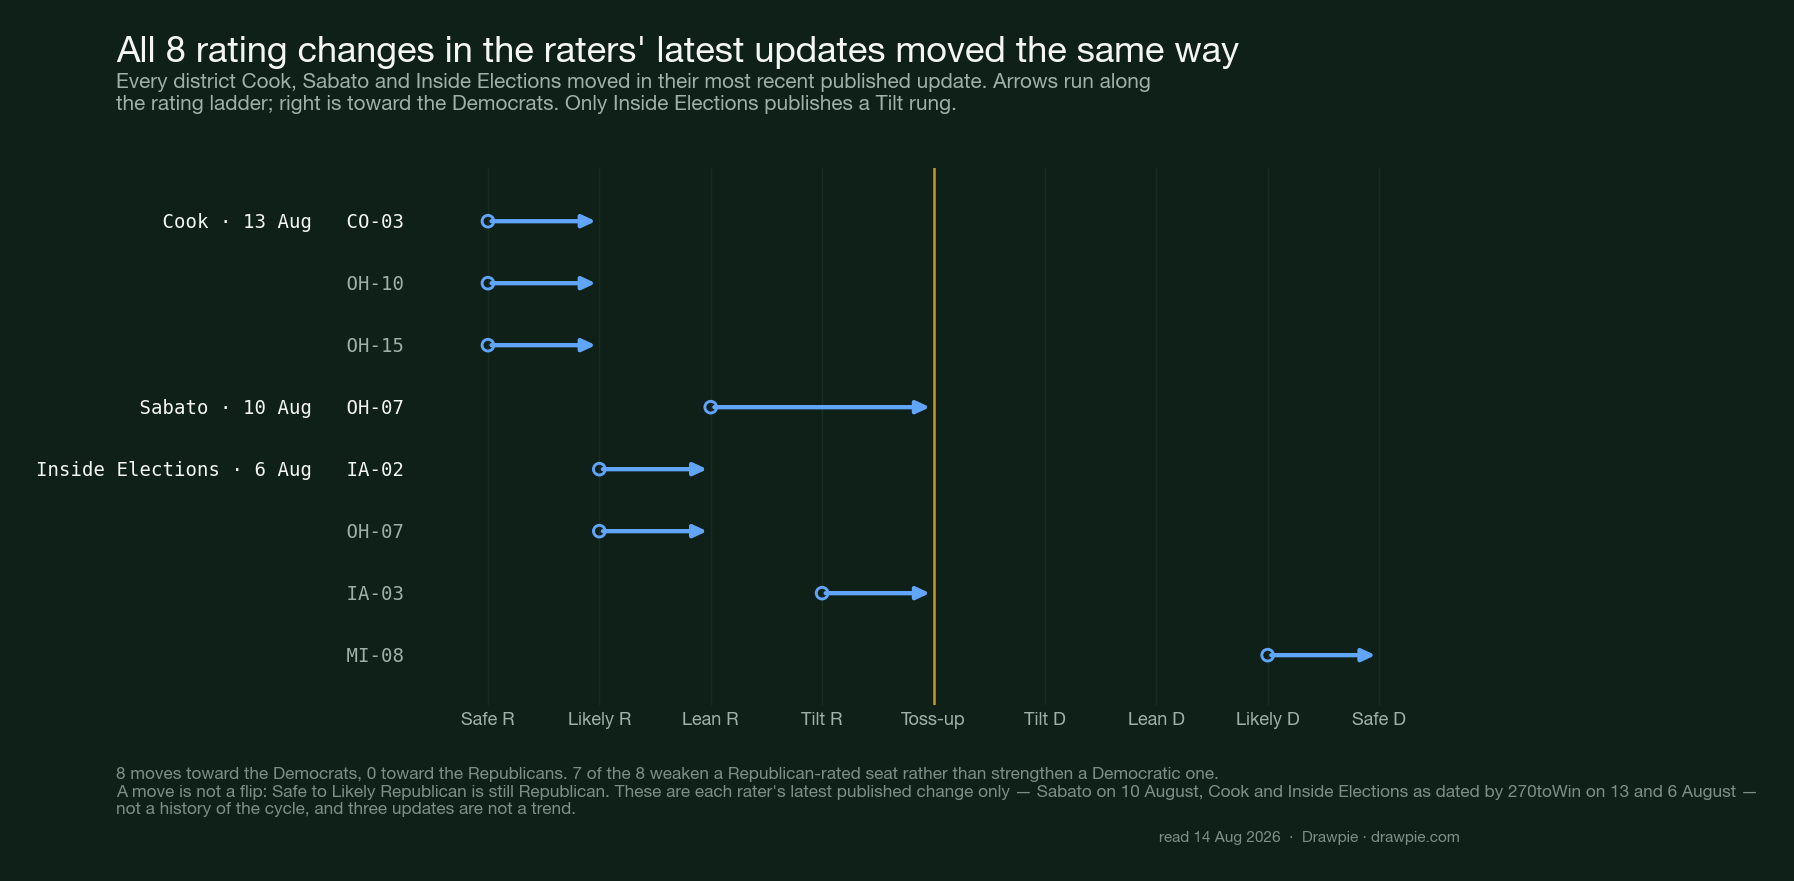
One way. Every district the three of them moved in their most recent published update went toward the Democrats — eight changes, no exceptions.
| Rater | Date | Moves | Direction |
|---|---|---|---|
| Cook | 13 Aug | 3 | All toward D |
| Sabato | 10 Aug | 1 | Toward D |
| Inside Elections | 6 Aug | 4 | All toward D |
Seven of the eight weaken a Republican-rated seat rather than strengthen a Democratic one: Cook took CO-03, OH-10 and OH-15 from Safe to Likely Republican, Sabato took OH-07 from Lean Republican to Toss-up on 10 August, and Inside Elections moved IA-02 and OH-07 from Likely to Lean Republican and IA-03 from Tilt Republican to Toss-up. The eighth, MI-08, went from Likely to Safe Democratic.
Two cautions before reading anything into it. A move is not a flip — Safe to Likely Republican is still Republican, and none of these eight seats changed hands on paper. And these are one update each; three updates are not a trend line.
One rater does publish its whole cycle. Sabato’s own change log carries 105 House rating changes since June 2025, and it also shows that dates on aggregator sites are not always the rater’s: the OH-07 move above is dated 13 August by the site we read the map from and 10 August by Sabato itself. We have used Sabato’s.
What it does establish is direction, and it matters later: the raters are still in the process of downgrading Republican seats. A ratings snapshot is a lagging measure of an environment that is still moving, and the arithmetic further down this page treats that snapshot as settled.
What is our own seat projection for the House?
Nine ways of running the same arithmetic give Democrats between 214 and 221 seats, and three of the nine reach a majority. Two choices decide which — which rater you believe, and where you draw the line around “in play” — and in eight of the nine cells the polling is not one of them. That is the finding, and it is worth more than a number would have been.
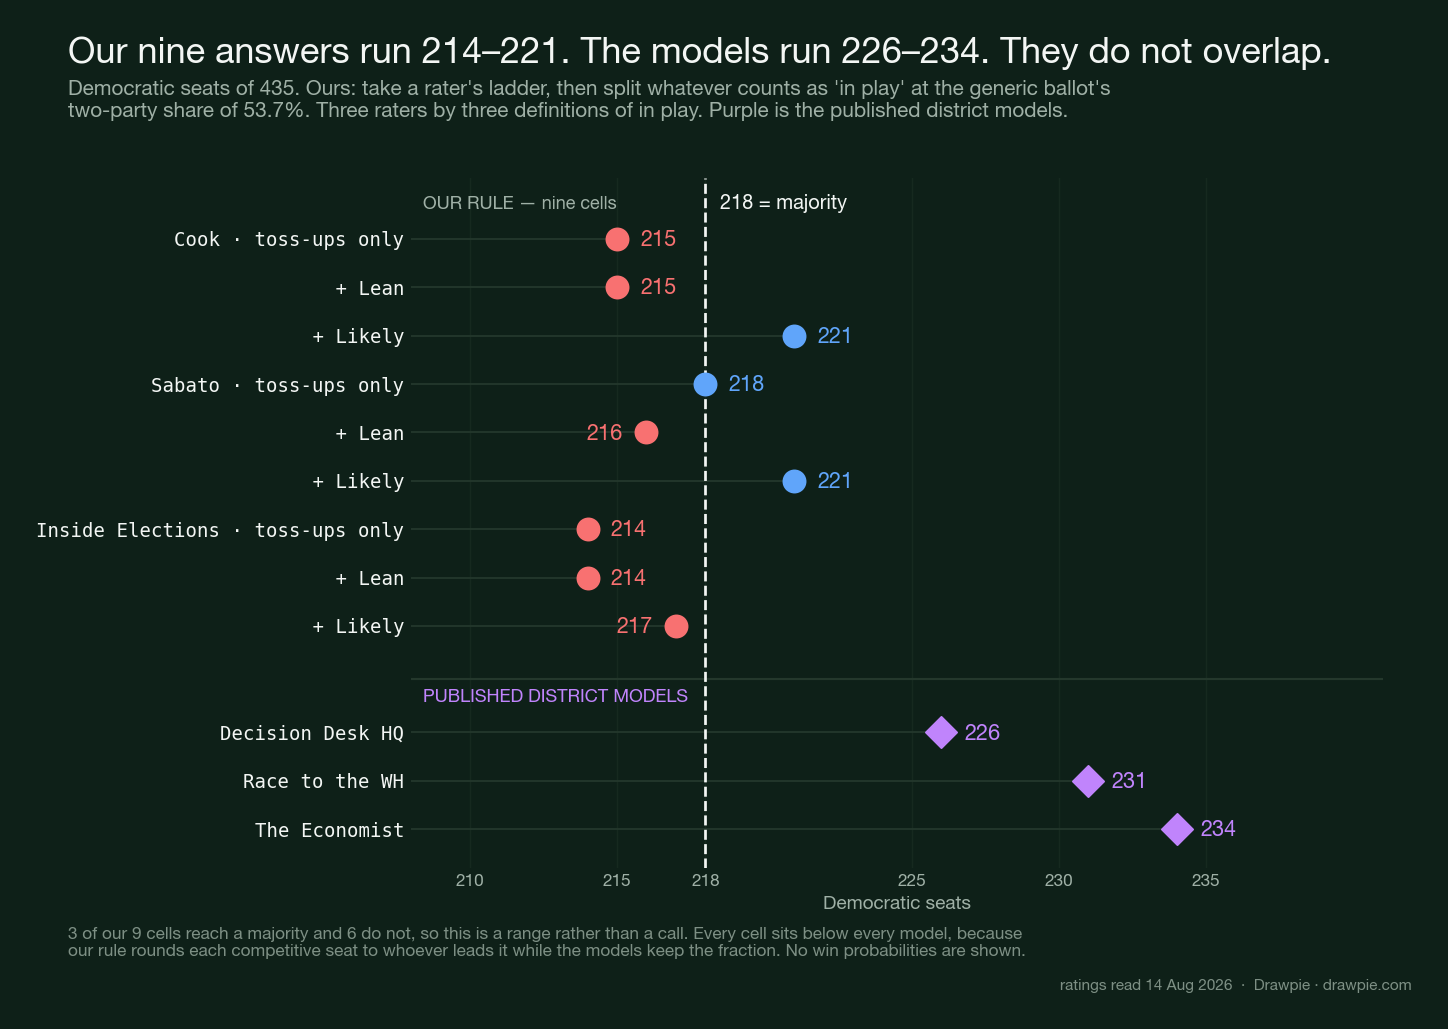
The rule has two steps. Take a rater’s ratings as given, then allocate whatever counts as “in play” in proportion to the two-party share of the generic ballot — Democrats’ 48.2 against Republicans’ 41.5, or 53.7%. Run it against all three raters who publish a House ladder, at three definitions of in play:
| In play | Cook | Sabato | Inside El. |
|---|---|---|---|
| Toss-ups | 215 | 218 | 214 |
| + Lean | 215 | 216 | 214 |
| + Likely | 221 | 221 | 217 |
Democratic seats out of 435; 218 is a majority, and bold marks the cells that reach it. Inside Elections uses a five-step ladder with a “Tilt” rung between Toss-up and Lean; folding Tilt into the Lean row so the three fit one grid is our alignment, not theirs.
The rater matters more than the data
Look along the top row. On the narrowest, most cautious reading — only genuine coin-flips are in play — Cook gives Republicans 220, Sabato gives Democrats a bare majority at 218, and Inside Elections gives Republicans 221. Same rule, same national number, three ladders read within a week of each other. The spread is only four seats, Democrats 214 to 218 — but 218 is inside it, so those four seats are the difference between the two answers a reader actually cares about.
For most of the grid the generic ballot is not doing the work either. Eight of the nine cells would need the national lead to move somewhere between 6.4 and 41 points before their winner changed, and it currently reads D+6.7. The exception is the bottom-right cell: Inside Elections at its widest sits 0.3 points from flipping, close enough that any rounding decides it. Everywhere else, the answer was settled before the polling was consulted.
The rule can be worse than the ratings it starts from
Sabato’s column does not move in one direction. Toss-ups only gives Democrats 218; widening to Lean takes them down to 216; widening again puts them back to 221.
That is not a quirk, it is the method failing in public. Sabato rates 13 Lean Democratic seats against 7 Lean Republican, so Democrats are favoured in 65% of that rung — and our rule overwrites that with the national figure of 53.7%, handing back fewer seats than the rater’s own judgement gave them. A rule that replaces a district-level assessment with one national number can take away seats that the rater says you are winning. It is the clearest illustration on this page of what a national average cannot do.
Why the models still go further than any of our nine
Because they weight every competitive seat instead of rounding it to whoever is ahead. That is the whole disagreement, and across our nine cells it is worth five to twenty seats — and still five to seventeen measured only against the widest row from each rater.
Cook’s ladder has 50 competitive seats outside the toss-ups: 29 rated Republican (20 Likely, 9 Lean) against 21 rated Democratic (11 Likely, 10 Lean). A model does not record a Lean Republican seat as Republican. It records something like a 65% Republican chance and books the other 35% to the Democrats. Add those fractions across 29 seats and you get a double-digit number our arithmetic scores as zero — and because Republicans hold eight more seats in that exposed band than Democrats, what the rounding discards falls almost entirely one way.
There is a third difference, and the arrows further up this page are the evidence for it. A ratings snapshot lags the environment, and we treat it as final. Rating agencies move a district only once they are convinced, because being early is punished more than being late — so in a shifting environment their labels trail it. Cook, Sabato and Inside Elections were all still downgrading Republican seats in their latest updates. A model reads the same underlying data and does not have to wait for a label to change; our rule cannot move a seat that a rater has not already moved.
There is a fourth thing our rule cannot see. A national margin is not distributed evenly: piling up extra votes in districts a party already wins raises the national number without moving a single seat. So a generic-ballot share is not a seat share even in principle, and any rule that converts one into the other — ours included — is making an assumption rather than a measurement.
Expressed as the share of Cook’s 69 competitive seats each forecast gives Democrats, the argument compresses to a single number:
| Source | Dem seats | Of the 69 |
|---|---|---|
| National vote | — | 53.7% |
| This page | 221 | 53.6% |
| Decision Desk HQ | 226 | 60.9% |
| Race to the WH | 231 | 68.1% |
| The Economist | 234 | 72.5% |
We say 53.7%, they say 61 to 73% — and all three raters’ widest rows land within half a point of each other, just below 53.7%: Cook 53.6, Sabato 53.3, Inside Elections 53.1, each measured on its own competitive band of 69, 75 and 64 seats. That clustering is not agreement between the raters; it is the rule reproducing the national figure it was given. Our version assumes competitive seats fall in proportion to the national vote. The models assume the party with the wind behind it takes them at a higher rate than its vote share, which is what usually happens, because those seats sit on the tipping point where a small national swing changes a disproportionate number of hands. Correcting for that would mean putting a win probability on each rung, and none of the three raters publishes one, so we have not invented any.
What does Trump’s approval rating say about the midterms?
It is the input our arithmetic ignores entirely and the models weight heavily. Presidential approval is the structural variable in midterm forecasting, and Trump’s has been falling all year.
Pew Research Center, which asks the question the same way on the same panel each time, has it at 34% in its 20–26 April survey of 5,103 adults — the lowest of his second term. That is down from 37% in January, itself down from 40% the previous autumn.
| Pew survey | Approval |
|---|---|
| Autumn 2025 | 40% |
| 20–26 Jan 2026 | 37% |
| 20–26 Apr 2026 | 34% |
Read across sources rather than within one and the same problem appears as with the generic ballot. USPollingData’s composite, read on 14 August, has approval at 38.2% against 58.8% disapproval — a net of −20.6. Decision Desk HQ’s July model cited 42% approve to 55% disapprove as one of its drivers. Pew, the composite and DDHQ are eight points apart on the same quantity, and each is internally consistent.
What matters here is not the level but that all three are far under water, and that this is exactly the sort of variable a district model uses and our rule does not. Our arithmetic sees one number — the generic-ballot share — and nothing else. A model that also weights approval, candidate quality, fundraising and past district results has four more reasons than we do to expect Lean and Likely Republican seats to fall, which is where the eleven-to-twenty-seat gap in the chart above comes from.
What about the Senate in 2026?
A separate problem, with a narrower path. Republicans hold the Senate 53-47 — a caucus figure. The official party breakdown is 53 Republicans, 45 Democrats and two independents, and both independents caucus with the Democrats. Award every seat to the party it is rated for and Democrats reach 47 before the toss-ups, so their only route to 51 is to sweep all four of them — and one of the four, Michigan, is a seat they are defending rather than chasing. Lose a seat they currently hold and sweeping the four is no longer enough: 46 plus four is 50, so they would need a fifth win from outside the toss-up list.
Cook and Sabato name the same four: Alaska, Maine, Michigan and Ohio. Inside Elections is stricter and calls only Michigan a toss-up, which is why it ends the cycle with more Republican seats than the other two.
The forecast models split here in a way they do not on the House. Decision Desk HQ’s July model had both parties averaging 50 seats and still made Republicans favourites, because a 50-50 chamber is a Republican one while the Vice President breaks ties. The Economist’s median is also 50-50 and leans Republican; Race to the WH leans the other way, and reported that new fundraising data had improved the Democrats’ position in Alaska, Georgia and New Hampshire. On the House the models agree and we are the outlier. On the Senate they do not agree with each other, which is a reason to treat it as genuinely open rather than as leaning either way. That is a harder ask than a six-seat House gain, because the Senate map is fixed by which states happen to be up. We set out the four seats, all three raters and the polling in each in our 2026 Senate control guide . Texas is not one of the four — Cook, Sabato and Inside Elections all had it Lean Republican in early August — but it has moved enough to get its own page .
What could still change before November?
The things that are not in any of these numbers. Three are worth watching specifically.
- Vacancies and special elections. These move the arithmetic in one direction, not both. California’s 14th holds its runoff on 18 August and Georgia’s 13th on 25 August, and both are Democrat-versus-Democrat contests — so within eleven days Democrats go from 212 to 214 and the gap above falls from six to four. Texas’s 23rd is Republican-held with no date set.
- Candidate filing and retirements. Open seats behave differently from incumbent-held ones, and the ratings agencies move districts when incumbents leave.
- The gap between polls and raters. In several races this cycle, the polling average and the professional ratings point different ways. When that happens, the raters are weighting things a national poll does not measure — how a district has actually voted, and who is on the ballot.
What this forecast cannot tell you
Who will control either chamber. This page reports what one composite average says, what presidential approval says, what the seat arithmetic requires, and what three raters’ ladders produce under three different definitions of which seats are in play. Those nine results run from 214 to 221 and straddle the majority line, so they are not a call. The district-level models all make Democrats favourites for the House and we have printed their seat totals beside ours rather than burying the disagreement; on the Senate those same models do not agree with each other. This page does not price any of it — no betting or prediction-market odds appear here.
It also cannot tell you that a lead in August survives to November. The generic ballot in mid-August is a measurement of now, taken before most voters are paying attention, and its value is as a baseline you can check against later — not as a result.
How we verified this
We pulled a six-row table of individual aggregator figures off this page, because it was not sourced. The first version printed a per-aggregator breakdown — RealClearPolitics 41.6/48.6, Race to the WH 40.9/47.8, Decision Desk HQ 40.1/46.9, VoteHub 41.9/48.6, Silver Bulletin 41.7/48.3, FiftyPlusOne 42.7/49.2 — and said all six were last updated on 5 August 2026. USPollingData, which is where the composite comes from, publishes only the blend and not those six rows, so the breakdown cannot have come from there. Where an aggregator could be read directly it disagreed: Silver Bulletin’s own page carries D+6.7, updated 14 August, not the +6.6 the table gave it. And the six leads in that table ran 7.0, 6.9, 6.8, 6.7, 6.6, 6.5 — a perfect one-tenth step with no ties, which is not how six independent averages behave. It is how a table built to average to a target behaves. The whole table is gone, along with the claims we had drawn from it: a half-point spread, a 2.3-point spread in the levels, and an undecided range of 8.1% to 13.0%.
The seat arithmetic is stated against the current composition, taken from the Clerk of the House rather than from a news summary. The Clerk’s own member records give Republicans 218, Democrats 212, one independent and four vacancies, summing to 435. That makes the gap to a 218-seat majority six. A figure of five circulates because it is measured against a different composition — USPollingData states the House as 222 Republicans to 213 Democrats — and other figures against a different day’s vacancy count. Against the 2024 result, Republicans 220 to Democrats 215, the gap is three.
We had that composition wrong when this page first went up, in a way worth naming. It said five vacancies, which is the number you get if you take 435, subtract the two party totals, and assume the remainder is empty seats. It is not: one of those five is Kevin Kiley of California, who sits as an independent. He caucuses with the Republicans, so the page’s claim that Republicans were exactly on the majority line and would lose control on a single net loss was wrong — they command 219 votes. The lesson is that a residual is not a fact: subtracting two numbers from a total tells you what is left over, not what it consists of.
Reading the vacancies rather than counting them changed the headline number’s meaning. Three of the four were Democratic-held and one Republican, so the six-seat gap is not six seats to be taken from Republicans — it is three, once the vacancies are filled by the parties that held them. The two runoffs with dates, California’s 14th on 18 August and Georgia’s 13th on 25 August, are both Democrat-versus-Democrat, so that part is not a forecast. We also had the current-chamber threshold wrong by implication: with four seats empty a floor majority is 216 of 431, and 218 is the November number.
What survives is the composite, and the seat arithmetic still rests on it. Democrats 48.2 to Republicans 41.5 is published by USPollingData and was read on 14 August 2026. Those are the two numbers the allocation uses, so removing the invented breakdown does not move the 53.7% two-party share or any cell of the grid built on it. What it does remove is the claim that six aggregators independently agree, which we can no longer support: we could not open four of the six, and the fifth did not match.
The first version of the state map was wrong, and we have said so rather than quietly swapping the image. Cook’s own site and Sabato’s both refused automated access, so the district ratings here come from 270toWin’s published Cook ratings map. That page encodes one rating per district as a 435-character string, and our first read matched that string position-by-position against the district geometry in FIPS order. The string is not in FIPS order — the page’s own state ordering begins with Alaska, not Alabama — so the ratings landed on the wrong districts. Twenty-one of fifty states were wrong, five of them exactly backwards: Alaska, Nevada, New Hampshire, North Dakota and Vermont each had the two parties swapped, and North Carolina read 10 Democratic to 3 Republican when Cook has it 3 to 11.
The national totals hid the error, which is why they were not enough of a check. Scrambling which district gets which rating does not change how many of each rating there are, so the broken version still summed to 205 Democratic, 211 Republican and 19 toss-ups — and still matched the page’s published totals. Checking a total can never validate a positional decode. The corrected figures are read from the page’s per-district records, which are keyed by district and carry the rating on the record itself, so no ordering is assumed at all; they are decoded with the page’s own published code table rather than by inference. Individual districts were then checked against named incumbents.
What the correction did and did not move. It changed the map image, the count of states holding toss-ups (14, not 16), which states hold more than one (Pennsylvania 3, and Arizona, Iowa and Ohio 2 each), and the list of evenly split delegations (Maine, Michigan, Minnesota, Pennsylvania — West Virginia was in that list wrongly). It did not change the national totals, the 13-of-19 arithmetic, or the grid, because none of those depends on which state a seat is in.
Each rater’s own map was used, never the site’s consensus map. That consensus map blends six forecasters and gives different numbers again; the three ladders here are Cook’s, Sabato’s and Inside Elections’ own published maps, read on 14 August 2026. An earlier version of this page said we had not used Sabato at all, which was true of that version and is not true of this one.
No betting or prediction-market odds appear here, including on the page the ratings came from. That page displays a market-implied probability for House control and its district table carries a market column; both are excluded from the map, the tables and the text. Several other sites that describe themselves as 2026 forecasts publish odds too. None is used, under a site-wide rule rather than any judgement about this election.
The projection was ours, and we have printed the forecasts that contradict it. In its first form it was a single figure — Republicans 220 to Democrats 215 — from one step: take Cook’s ratings, then split the 19 toss-ups in proportion to the two-party share of the generic ballot, 53.7% Democratic, so 10 of the 19. It is now nine cells rather than one. Every input and each cell’s tipping point are on the page, and scripts/house_2026_rater_grid.py reproduces all of them, so the arithmetic can be checked or rejected rather than taken on trust.
The single number was withdrawn, because the method does not support one. Earlier versions published Republicans 220 to Democrats 215 as our projection, then as a Republican floor. Running the identical rule at a wider definition of “in play”, and then against all three raters rather than only Cook, produces nine answers between 214 and 221. The rule never changed; the boundary and the source did, and the answer crossed the majority line in three of the nine. A method whose winner is set by unstated choices cannot honestly be reported as one figure, so the page reports the grid and names both choices.
Adding the second and third rater corrected something we had published a few hours earlier. With Cook alone we wrote that the polling contributes nothing to the outcome. Across all nine cells that is true of eight: they need the national lead to move between 6.4 and 41 points before their winner changes. The ninth — Inside Elections at its widest definition — sits 0.3 points from flipping. The claim has been narrowed to match. This is the second time on this page that widening the evidence overturned a sentence we were confident about, which is the argument for widening it.
Sabato’s column is not monotone, and we have left that visible rather than smoothing it. Toss-ups only gives Democrats 218, adding the Lean rung drops them to 216, adding Likely returns them to 221. It happens because Sabato rates 13 Lean Democratic seats to 7 Lean Republican, so the rule’s national 53.7% hands back less than the rater’s own 65%. A method that can subtract seats a rater says you are favoured to win is telling you something about itself, and it seemed more useful to show it than to pick the tiers that hid it.
The three ladders were decoded the same way and spot-checked the same way. Each rater’s own map on the same source, read from its per-district records rather than positionally, and checked against named incumbents on seats where an error would be obvious — Vermont, North Dakota, Alaska, Wyoming, both Hawaii seats and North Carolina’s delegation. Inside Elections publishes a five-step ladder; compressing its Tilt rung into our Lean row is our alignment and is stated in the text. The three maps carry different dates: Cook and Sabato 13 August, Inside Elections 6 August.
We considered giving each rating rung a win probability and did not. That is the standard fix and it would close much of the gap to the models. Cook does not publish win probabilities for its rungs, so the numbers would have had to come from us. This page has already had to remove one table of figures that looked precise and had no source; we were not going to add another.
One forecaster published two versions of its own number on the same day. Decision Desk HQ’s 15 July press release gives Democrats 227 seats; its longer model write-up, published the same day, gives an average of 226 to the Republicans’ 209. We print both rather than picking the one that suits the sentence. Neither is a live figure — that model was published on 15 July and the page you are reading was written a month later, so it is a point in time, not today’s reading.
The Economist’s figure was not machine-read. Its model sits behind a paywall and our tooling could not open it, so the median of 234 comes from a manual reading of the interactive on 14 August 2026 rather than from a fetch we can replay. It is included because leaving it out would have made the models look more like each other than they are — the spread across the three is eight seats.
We are not printing those models’ win probabilities, and that is a choice rather than an oversight. They are model outputs, not market prices, so the site’s no-odds rule is not really aimed at them — but this page states that it does not price the outcome, and we would rather that stay literally true. The seat totals are the figures that compare with ours in any case. The Economist’s model points the same way; we could not open it directly, so it is named but not quoted.
The approval figures come from one pollster’s own trend, plus two composites that disagree with it. Pew Research Center asks the question on the same panel each wave, which is why its 40% to 37% to 34% is quoted as a trend rather than assembled from different houses. The April reading was fielded 20–26 April 2026 among 5,103 adults. Set beside it, USPollingData’s composite read 38.2% on 14 August and Decision Desk HQ’s July model used 42%. Eight points separate them, so the article states the direction and the fact that all three are far under water, not a single number.
The chart in the projection section was replaced. It was a hemicycle of all 435 seats showing one of the nine cells, which read as a single projection after the page had stopped making one. It is now a dot chart of all nine against the majority line with the three models beside them.
The Senate figures are carried over from our own guide of 10 August 2026 and are summarised rather than re-derived here, with a link to the seat-by-seat version.