2026–2027 Winter Forecast: Coldest Regions, Snow and What NOAA Actually Published
Update log (10)
- — Both of this page's near clocks were re-checked directly against CPC's own pages, a lighter-touch pass than the last one. The long-lead outlook set due 17 September is confirmed issued (830 AM EDT Thu Sep 17 2026), carrying the same El Niño strength framing as before — greater than 90% very strong, 75% historic on the RONI — and the same overall shape region by region: no region favoured for below-normal temperature, wetter south and drier north still the pattern. The regional table and chart on this page are still built from the 20 August set specifically and have not been rebuilt cell by cell from the 17 September one in this pass, and this page says so rather than implying a freshness it has not earned; that rebuild, and the 15 October reissue that may carry NOAA's flagship Winter Outlook, are the next things to watch. The ENSO Diagnostic Discussion itself is unchanged — still 10 September, with 8 October confirmed as next and not yet posted. Separately, a claim reached us of a roughly +3.0°C WEEKLY Nino-3.4 reading around 16 September, well above the +1.8°C MONTHLY figure this page carries, and we ran that down against CPC's own weekly monitoring briefing rather than repeat it here — the detail, including why the two readings are not directly comparable and why +3.0°C did not reproduce for the Nino-3.4 box specifically, is on our companion snow page. NOAA's flagship Winter Outlook remains unissued as of this check; noaa.gov's news releases run through 24 September with nothing under that name.
- — Both of this page's near clocks fired, and only one of them did what the page predicted. CPC's ENSO discussion of 10 September raises the chance of a historic October-December event from 69% to 75% and holds the very-strong figure above 90%, and the August index set is now published in full - Nino-3.4 +1.8, Nino-3 +2.5, Nino-1+2 +3.4, and Nino-4 falling to +0.1, an east-loaded event. A new section works through something most coverage gets wrong: CPC states the +2.5 historic threshold in RONI, not ONI, and the two have separated. RONI for June-August is +1.36 against the ONI's +1.80, so the distance to historic is 1.14 degrees rather than 0.70. The reason CPC phrases it that way is that the ONI version of its own sentence would be false - 2015-16 already peaked at +2.59 on the ONI, while nothing since 1950 has reached +2.5 on the RONI, where the record is 1982-83 at +2.40. The September STEO also landed, and this page's warning that its heating degree days were about to be superseded was wrong: October through March are identical to two decimal places across the two issues, because EIA's own table note says everything past the current month comes from the 30-year trend rather than from a forecast. What did change is gas storage, cut from 3,985 Bcf to 3,969 and stripped of the words record and highest since 2016, with a regional breakdown added that puts the East level with its five-year average while the Mountain region sits 21% above.
- — The ONI has moved and the page's framing of it was out of date. June-August 2026 is now published at +1.80 on all three NOAA products, so 'May-July is still the last completed season' and the -99.90 explanation that went with it are both gone; the placeholder has moved to the July-September cell. Every earlier value in the season table was revised down by 0.01 to 0.03 in the same update (-0.37 to -0.39, +0.13 to +0.11, +0.98 to +0.95, +1.40 to +1.39), and the ONI chart is rebuilt on the current series. The version footnote explaining a 0.01 gap between PSL and CPC has been dropped rather than restated: both files now read +1.39 for May-July and agree on every 2026 season. A rounding artefact is also fixed — the March ten-year average is 525.47, so printing it as 526 made March look like an exact tie when it is fractionally above, and 'October is the one month running above its average' was wrong. Two of the page's three clocks had not fired: the September STEO was still unreleased at the time of the edit (sep26.pdf 404 against a working aug26.pdf control) and the current ENSO discussion is still the 13 August one, with its greater-than-90% and 69% figures intact.
- — Nothing NOAA has published moved between 30 August and 2 September: the ENSO diagnostic discussion is still the 13 August one with the greater-than-90% and 69% figures intact, the 20 August long-lead set is still the current one, both ONI tables still end at May-July, and the flagship Winter Outlook is still unissued. Two things did change. August closed, so the reason the June-August ONI is missing is no longer that the season cannot be computed but that NOAA has not posted it yet, and the page now says which. And CPC's September monthly outlook received its 31 August update, which this page had described as still to come. One stray sentence has also been removed: in the release-schedule section the page still said it had not worked through the 20 August outlook set, which stopped being true on 29 August when the regional table was rebuilt from it, and which contradicted three other places on the page.
- — The page has been extended from the regional scale to the scale people actually ask about. Seven sections are new: what the outlook and the analog winters mean for thirty named metros; first-freeze climatology; which month of winter the analogs actually moved; what disrupts daily life in a mild wet winter, which is ice rather than snow totals; Florida's winter severe-weather risk, counted out of the Storm Prediction Center's database; heating degree days and the 6 October date for EIA's Winter Fuels Outlook; and why NOAA and the two almanacs disagree. Four charts and two datasets are added with them. One correction came out of the work: the 2025-26 Winter Outlook row was one date and should have been two, because NOAA's 16 October 2025 release went out during the federal shutdown with no press conference and the public announcement followed on 21 November.
- — NOAA has published nothing new since the August set: the ENSO diagnostic discussion is still the 13 August one, its own page still names 10 September as the next, and the Oceanic Nino Index still ends at May-July because June-August cannot be computed until August closes. One thing did change underneath the numbers, though. NOAA PSL rebased the ONI series onto ERSST version 6 on 4 August 2026, and the effect is visible: the file this page quotes gives +1.40 for May-July, while the Climate Prediction Center's own v5-based table gives +1.39 for the same season. The page now names the file it is quoting and explains the gap, so a reader who checks the figure elsewhere is not left wondering which of the two is wrong. Neither is.
- — The 20 August outlook set has now been worked through, which the page previously said it had not been. The regional tilt table is rebuilt from it region by region and replaces the 16 July version, and a chart of the eleven regions is added. The finding that came out of doing it properly: NOAA does not favour below-normal temperature anywhere in the country this winter — no region, no season — which is checked in code against every cell rather than read off a map. A section answering 'which regions will be coldest' has been added to say so, and a release-schedule chart now separates the routine third-Thursday reissue from NOAA's branded October Winter Outlook, which are due the same day this year.
- — The 20 August long-lead outlook set has been released - the Climate Prediction Center's prognostic discussion carries an 8:30 AM EDT 20 August 2026 timestamp - so the next scheduled release is now 17 September 2026, and every mention of 20 August as a date still to come has been re-pointed. The flagship Winter Outlook is still not out, and 15 October remains the date to watch. The regional tilt described on this page is still the 16 July set's: the August release has not been worked through here yet, and the page says so rather than implying a freshness it has not earned. The Oceanic Nino Index still ends at +1.40 for May-July on the CPC v6 table, with no June-August value, because August is not complete.
- — NOAA's flagship Winter Outlook now has a date to watch rather than a vague season. The Climate Prediction Center's published schedule puts its next long-lead releases on 20 August, 17 September and 15 October 2026, all on the third Thursday of the month at 8:30am Eastern — and NOAA has issued the flagship Winter Outlook on that same October date four years running: 20 October 2022, 19 October 2023, 17 October 2024 and 16 October 2025. It has named the date of its next ENSO diagnostic discussion too, 10 September. The August discussion of the 13th remains the current one and is already reflected here, the regional tilt still comes from the 16 July outlook set, and the Oceanic Nino Index still ends at +1.40 for May-July because June-August cannot be computed until August is complete.
- — NOAA's Climate Prediction Center issued its August ENSO discussion on 13 August, the date this page said to watch, and the odds have moved. A very strong event is now put at greater than 90% for the coming autumn and winter, against 81% in the July discussion, and October to December carries a 69% chance of exceeding every El Nino back to 1950. Figures on this page have been updated to the August discussion, including the July index and subsurface values, and snow now has its own page.

- NOAA’s Climate Prediction Center has an El Niño Advisory in force. Its 10 September 2026 diagnostic discussion puts a very strong event above 90% for the coming autumn and winter, and gives October to December a 75% chance of exceeding every El Niño back to 1950 — up from 69% in August, and from 81% for the plain very-strong tier in July. The odds have firmed at every discussion this summer.
- The warmth is lopsided across the Pacific and that matters more than the headline number. In August the Niño-3.4 index reached +1.8 °C, Niño-3 +2.5 °C and the far-eastern Niño-1+2 +3.4 °C, while Niño-4 in the west fell to +0.1 °C. An east-loaded event is the shape the analog winters below were built on.
- 🔴 The +2.5 °C ‘historic’ threshold is a RONI figure, not the ONI everyone quotes, and the two have come apart. June-August reads +1.36 on the RONI against +1.80 on the ONI, so the distance to historic is 1.14 °C rather than the 0.70 °C most coverage implies.
- There is a reason CPC states it that way: on the ONI, 2015-16 already hit +2.59, so a +2.5 ONI event would not exceed every El Niño back to 1950. On the RONI nothing since 1950 has reached +2.5 — the record is 1982-83 at +2.40.
- The official winter tilt is wetter across the southern tier, with the highest probabilities over parts of the Southeast, and drier from the Northwest across the northern Plains and Great Lakes. Temperatures lean above normal over the west, north and east rather than the south.
- We checked what the eight strongest El Niño winters actually did. All eight were wetter than the 1950-2026 US average, but only six of the eight were warmer — 1965-66 and 1972-73 were both among the coldest fifteen winters on record.
- This is not NOAA’s headline Winter Outlook, and that is the single most-confused point about this topic. The flagship is not out. Two clocks govern it and they came apart last year: the data has gone out on 20 October 2022, 19 October 2023, 17 October 2024 and 16 October 2025, every one a third Thursday, but the 2025 announcement waited for the federal shutdown to end and arrived on 21 November. The Climate Prediction Center’s published schedule puts this year’s release on 15 October.
- What does exist is the monthly long-lead outlook set, which has carried a December-February 2026/27 forecast for months and is simply reissued at a shorter lead each time. The regional tilt set out below is still read from the 20 August set specifically; a newer set landed 17 September confirming the same shape but has not been rebuilt into this page’s table yet, the next long-lead reissue lands 15 October, and the next ENSO diagnostic discussion is 8 October.
- NOAA does not favour below-normal temperatures anywhere in the United States this winter. Searching every region and every season in the 20 August outlook returns no cell tilting cold — the firmest signals, above 50%, are all for above-normal temperature, from the Pacific Northwest across the Great Lakes to the Northeast.
- At city level the famous north-south split in El Nino winters is half an artefact. Measured against today’s normals the southern metros all look cold; measured against the trend at their own station the southern signal disappears and the northern one strengthens. Boston, Buffalo, Cleveland and Minneapolis were warmer than their own era in all eight of the strongest El Nino winters.
- December, not January, is the month these winters actually moved. Detrended across the eight analogs, December ran 2.15 degrees F above its era in six of the eight; January was a coin flip at 0.62 degrees and four of eight.
- Florida is the one state where an El Nino winter reliably means more severe weather. We counted 19 Florida tornadoes per winter in the eight strongest events against 7 in every other winter since 1950-51 — and nationally the same research finds El Nino winters produce fewer, weaker tornado outbreaks, not more.
NOAA’s flagship U.S. Winter Outlook for 2026–27 is not out. The outlook itself has landed on the third Thursday of October for four years running — though last year the announcement of it did not — and the third Thursday of October 2026 is the 15th, which is also the date on the Climate Prediction Center’s own published release calendar.
What NOAA has published is a genuine forecast for this winter, and it is unusually loaded. The agency has an El Niño Advisory in force and its forecasters put a greater than 90% chance on the event reaching the “very strong” tier between October and December. If that happens, the 2026/27 winter will be shaped by one of the largest El Niño events in the record going back to 1950.
That is a real signal, and it is worth being precise about what it does and does not tell you. It tilts the odds across whole regions over three months. It does not tell you whether it will snow at your house in January — and NOAA does not forecast snowfall totals at all.
What is the 2026/2027 US winter forecast?
Milder from the Pacific Northwest across to the Northeast, much wetter in the Southeast, drier through the northern Rockies and Great Lakes — and, the part nobody reports, nowhere at all forecast to be colder than normal.
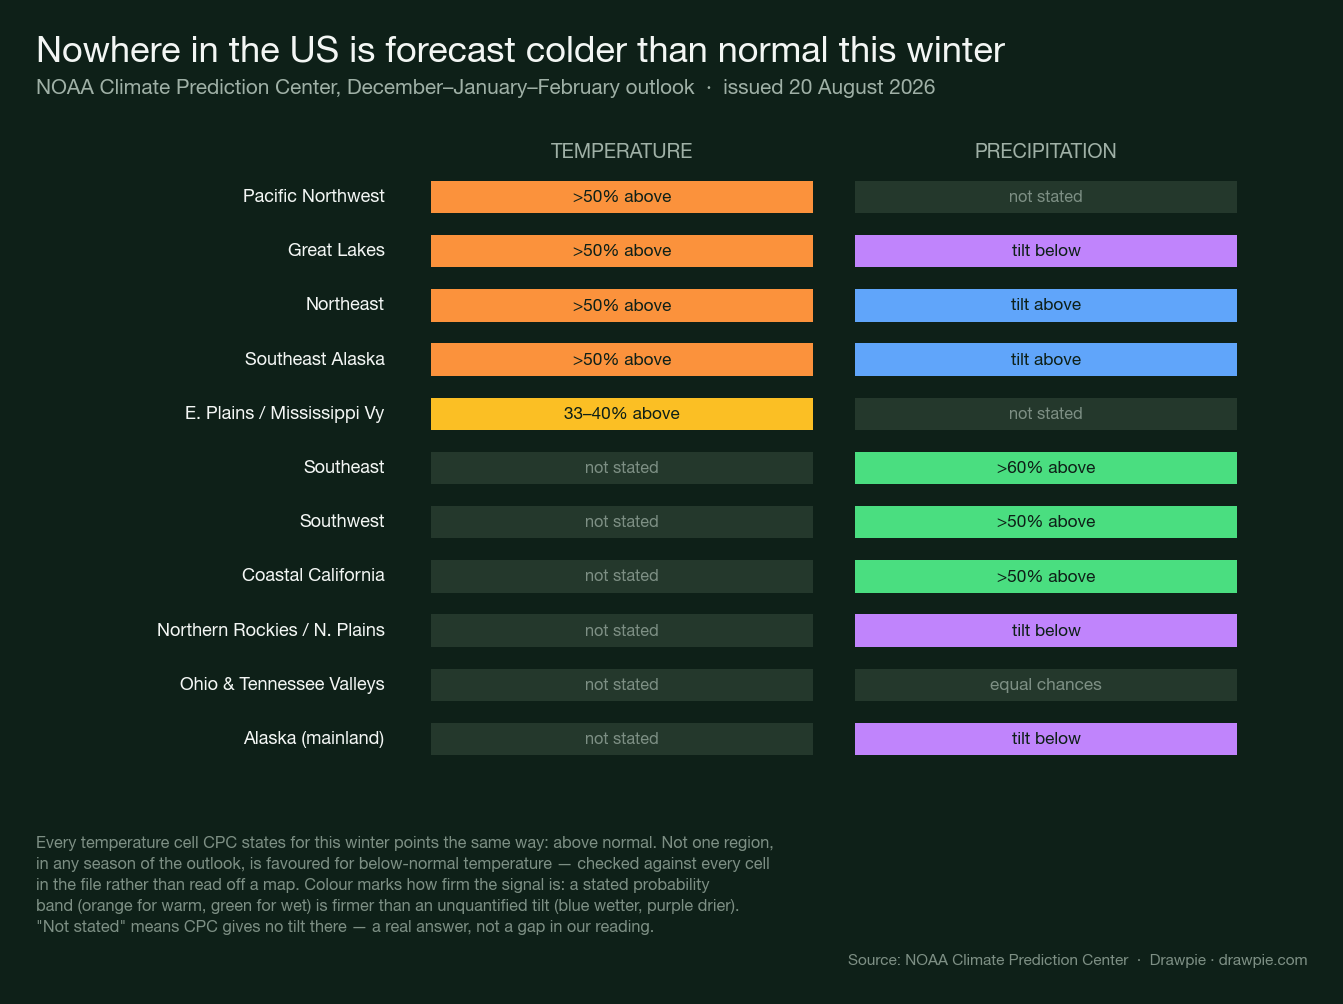
This is the 20 August 2026 outlook set, read region by region from the Climate Prediction Center’s own prognostic discussion. A newer set was issued 17 September and confirms the same shape — no region favoured for below-normal temperature, wetter south and drier north still the pattern — but the table and chart below have not been rebuilt cell by cell from it; see the update log above.
| Region | Temp | Precip |
|---|---|---|
| Pacific Northwest | >50% above | not stated |
| Great Lakes | >50% above | tilt below |
| Northeast | >50% above | tilt above |
| Southeast Alaska | >50% above | tilt above |
| E. Plains / Mississippi Vy | 33–40% above | not stated |
| Southeast | not stated | >60% above |
| Southwest | not stated | >50% above |
| Coastal California | not stated | >50% above |
| N. Rockies / N. Plains | not stated | tilt below |
| Ohio & Tennessee Valleys | not stated | equal chances |
| Alaska (mainland) | not stated | tilt below |
The forecaster’s own wording is that El Niño teleconnections “ramp up through the fall 2026 and winter 2026-2027”, with below-normal precipitation over the Northwest and north-central states “juxtaposed with above-normal precipitation over the southern tier, with highest probabilities over parts of the Southeast in winter 2026-2027 when teleconnections are strongest”.
“Not stated” is a real answer, not a gap in our reading. Where CPC gives no tilt for a region and season, that is the agency declining to lean either way — usually because the models disagree. Parts of the Gulf States sit there for exactly that reason: a strong El Niño would normally push them drier, but the dynamical models split and the recent decadal trend runs the other way.
Which regions will be coldest this winter?
NOAA does not name any. Not one region, in any season of the outlook, is favoured for below-normal temperature.
That is worth stating plainly because “coldest regions” is one of the most-searched things about a winter forecast, and the honest answer this year is that the official outlook has no candidates. Every temperature signal CPC states points the same direction — above normal — with the firmest probabilities, above 50%, running from the Pacific Northwest across the Great Lakes to the Northeast.
This was checked against every cell rather than read off a map. The chart above is built by a script that searches all eleven regions across all six seasons in the outlook for any mention of below-normal temperature, and refuses to draw if it finds one. It found none.
What that does not mean. It does not mean nowhere will be cold. A seasonal outlook is a three-month average against a 1991–2020 baseline; it says nothing about individual cold snaps, and a winter that finishes above normal can still contain a brutal fortnight. If you want the coldest places rather than the coldest anomalies, that is climatology, not a forecast — the northern Plains and interior Alaska are the coldest parts of the country most winters regardless of what the outlook says.
What does the winter outlook mean where I live?
NOAA forecasts regions; you live in a city. So this page does the join itself — and the first thing that falls out of doing it is that the most quotable version of the answer is wrong.
Measured against today’s normals, the eight strongest El Niño winters since 1950 look like a clean north–south split: every northern metro warm, every southern one cold. Tampa comes out 1.9 °F below normal, Las Vegas 1.9 °F below, Miami and Phoenix 1.7 °F below.
That split is mostly an artefact. Five of those eight winters are older than 1999 and three are older than 1975, so measuring them against a 1991–2020 baseline charges them for half a century of warming. Ask the question the other way — was each winter warm or cold for its own time? — and the southern signal collapses while the northern one gets stronger.
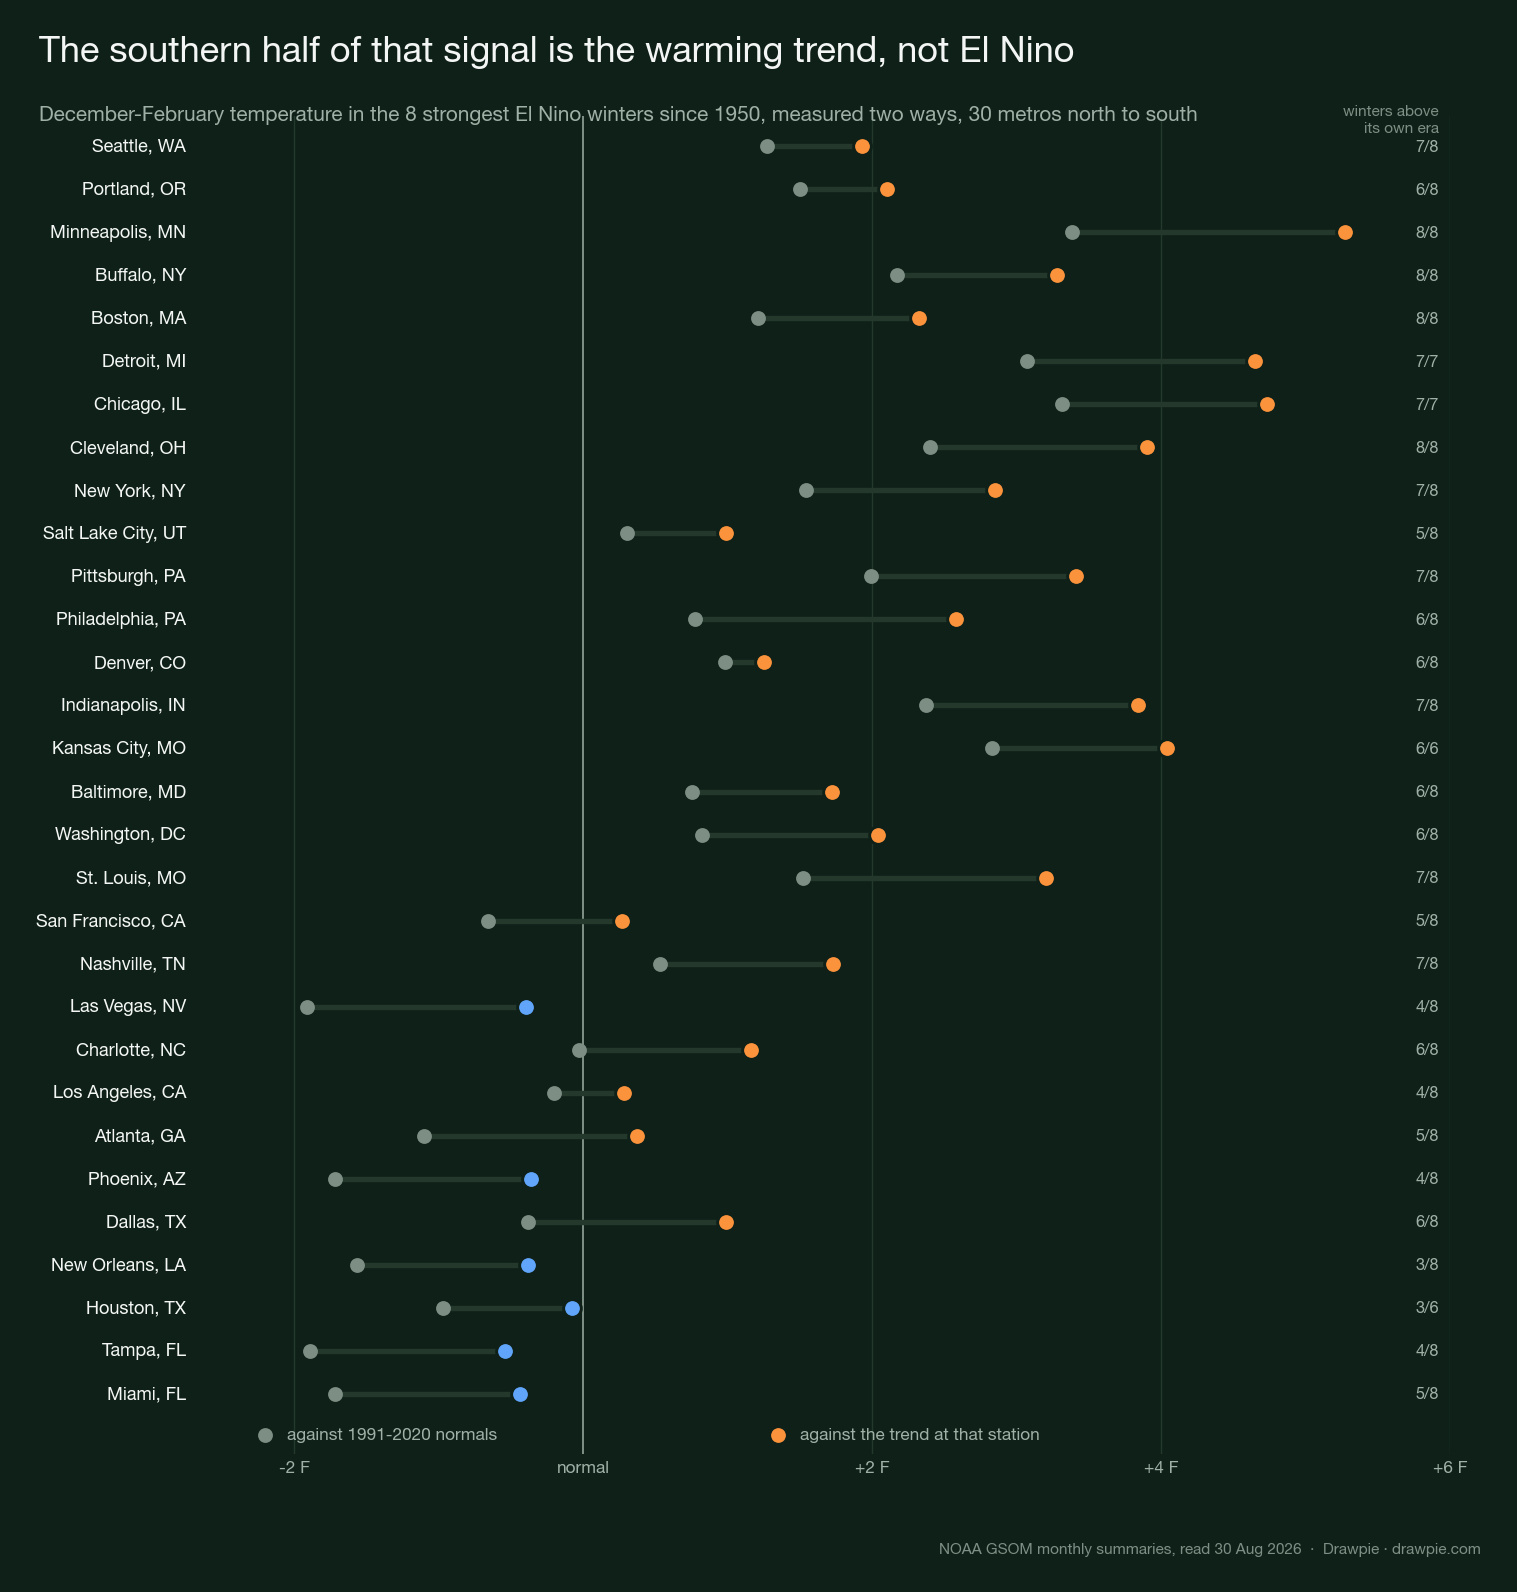
Tampa goes from −1.89 °F to −0.54 °F, Las Vegas from −1.91 °F to −0.40 °F, Atlanta from −1.10 °F to +0.37 °F. There is no southern cold signal in the record once the trend is out of it. What survives is northern and it is emphatic: Minneapolis +5.3 °F, Chicago +4.7 °F, Detroit +4.7 °F, Kansas City +4.0 °F. Boston, Buffalo, Cleveland and Minneapolis were warmer than their own era in all eight; Detroit, Chicago and Kansas City in every winter their record covers.
Both of those numbers were computed twice, once against a 31-winter window centred on each winter and once against a straight-line fit through the station’s whole record, because a centred window is lopsided at the start of a record that begins in 1948. The two methods agree on the direction for 29 of the 30 metros. Atlanta is the exception, and Atlanta is the one city sitting on zero.
| Metro | NOAA tilt | Warmer in |
|---|---|---|
| Seattle, WA | Warm | 7 of 8 |
| Portland, OR | Warm | 6 of 8 |
| Minneapolis, MN * | Dry | 8 of 8 |
| Buffalo, NY | Warm, dry | 8 of 8 |
| Boston, MA | Warm, wet | 8 of 8 |
| Detroit, MI | Warm, dry | 7 of 7 |
| Chicago, IL | Warm, dry | 7 of 7 |
| Cleveland, OH | Warm, dry | 8 of 8 |
| New York, NY | Warm, wet | 7 of 8 |
| Salt Lake City, UT * | Wet | 5 of 8 |
| Pittsburgh, PA * | Warm, wet | 7 of 8 |
| Philadelphia, PA | Warm, wet | 6 of 8 |
| Denver, CO * | Dry | 6 of 8 |
| Indianapolis, IN | Equal | 7 of 8 |
| Kansas City, MO | Warm 33–40% | 6 of 6 |
| Baltimore, MD * | Warm, wet | 6 of 8 |
| Washington, DC * | Warm, wet | 6 of 8 |
| St. Louis, MO | Warm 33–40% | 7 of 8 |
| San Francisco, CA | Wet | 5 of 8 |
| Nashville, TN | Equal | 7 of 8 |
| Las Vegas, NV | Wet | 4 of 8 |
| Charlotte, NC | Wet | 6 of 8 |
| Los Angeles, CA | Wet | 4 of 8 |
| Atlanta, GA | Wet | 5 of 8 |
| Phoenix, AZ | Wet | 4 of 8 |
| Dallas, TX | Not stated | 6 of 8 |
| New Orleans, LA | Wet | 3 of 8 |
| Houston, TX * | Not stated | 3 of 6 |
| Tampa, FL | Wet | 4 of 8 |
| Miami, FL | Wet | 5 of 8 |
The two columns are different kinds of claim and should not be blurred. “NOAA tilt” is a forecast for this winter, taken from the 20 August outlook. “Warmer in” is history: how many of the eight strongest El Niño winters ran above their own era at that station’s first-order weather station. Eight is a small sample and the counts are printed rather than averaged away so you can see how small.
The region column is our join, not NOAA’s. CPC’s discussion names regions in prose — “the Great Lakes”, “the Northeast” — and publishes no city lookup, so each metro was assigned by hand. Seven sit near a seam and are marked with an asterisk: Washington and Baltimore (Mid-Atlantic, which the discussion does not name separately), Pittsburgh (on the Ohio Valley seam), Minneapolis (between the northern Plains and the Great Lakes), Denver (between the northern Plains and the Southwest), Salt Lake City (between the Southwest and the northern Rockies) and Houston (CPC splits the southern tier by longitude, not by state). Where a metro is marked, treat its tilt as approximate.
A station is also not a metro. These are single first-order stations — Central Park for New York, O’Hare for Chicago, Reagan National for Washington, which is physically in Virginia — and snowfall in particular varies sharply across one metro area.
When does the first freeze usually arrive?
Denver’s median first freeze is 8 October, Minneapolis 18 October, Chicago 28 October, New York 20 November, Dallas 24 November, Tampa 12 January — and Los Angeles and Miami have no median first freeze at all.
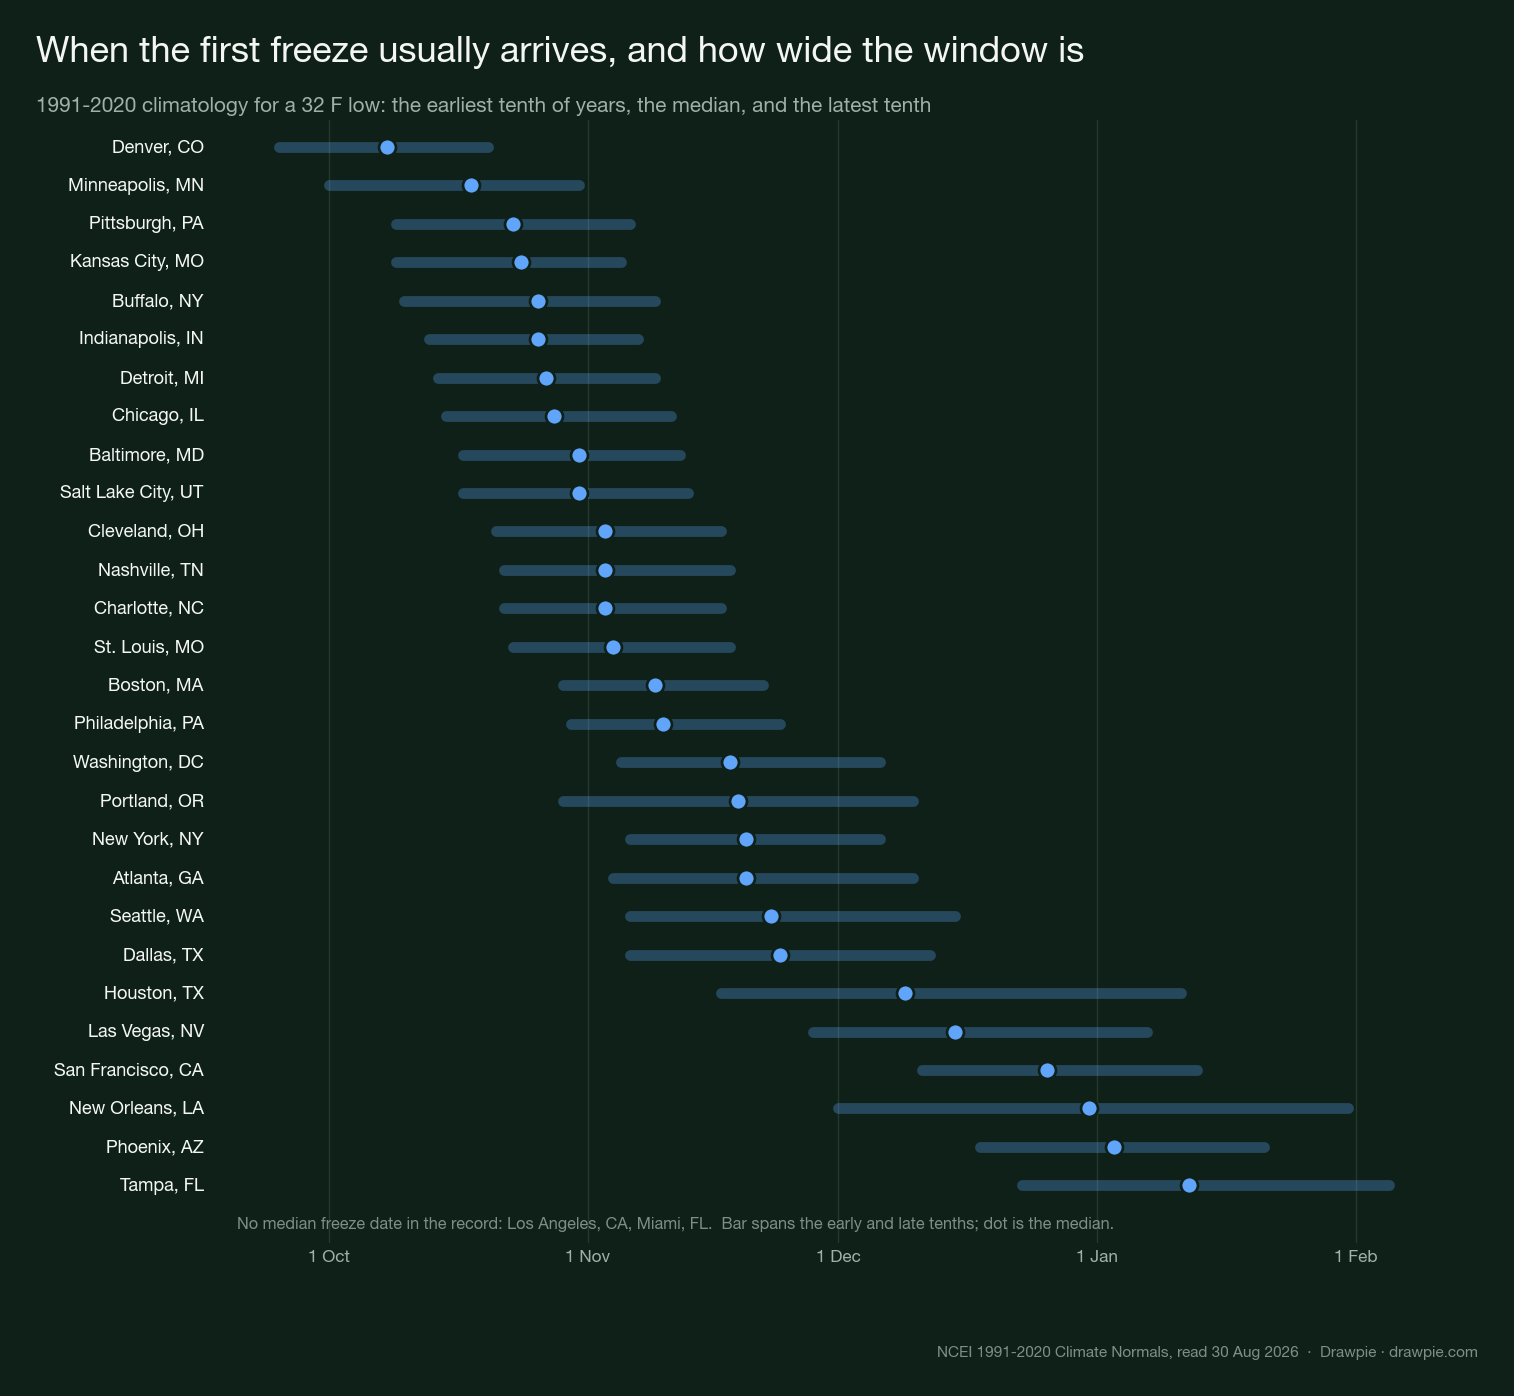
The width of each bar matters more than the dot in the middle. Minneapolis has a 30-day window between its early and late tenths; New Orleans has 61 days and Houston 55. In the north the first freeze is a date; in the south it is a season, and the practical planning question — when to drain a hose, lift tender plants, wrap a pipe — has a much softer answer there.
This is climatology, not a forecast for autumn 2026. These are NCEI’s 1991–2020 normals: the date by which a 32 °F low had occurred in 10%, 50% and 90% of those thirty years. Nothing here says anything about when the first freeze will arrive this year, and NOAA does not forecast that either.
Is it El Niño or La Niña this winter?
El Niño, and a fast-strengthening one. The Pacific flipped from a weak La Niña to a strong El Niño in about six months.
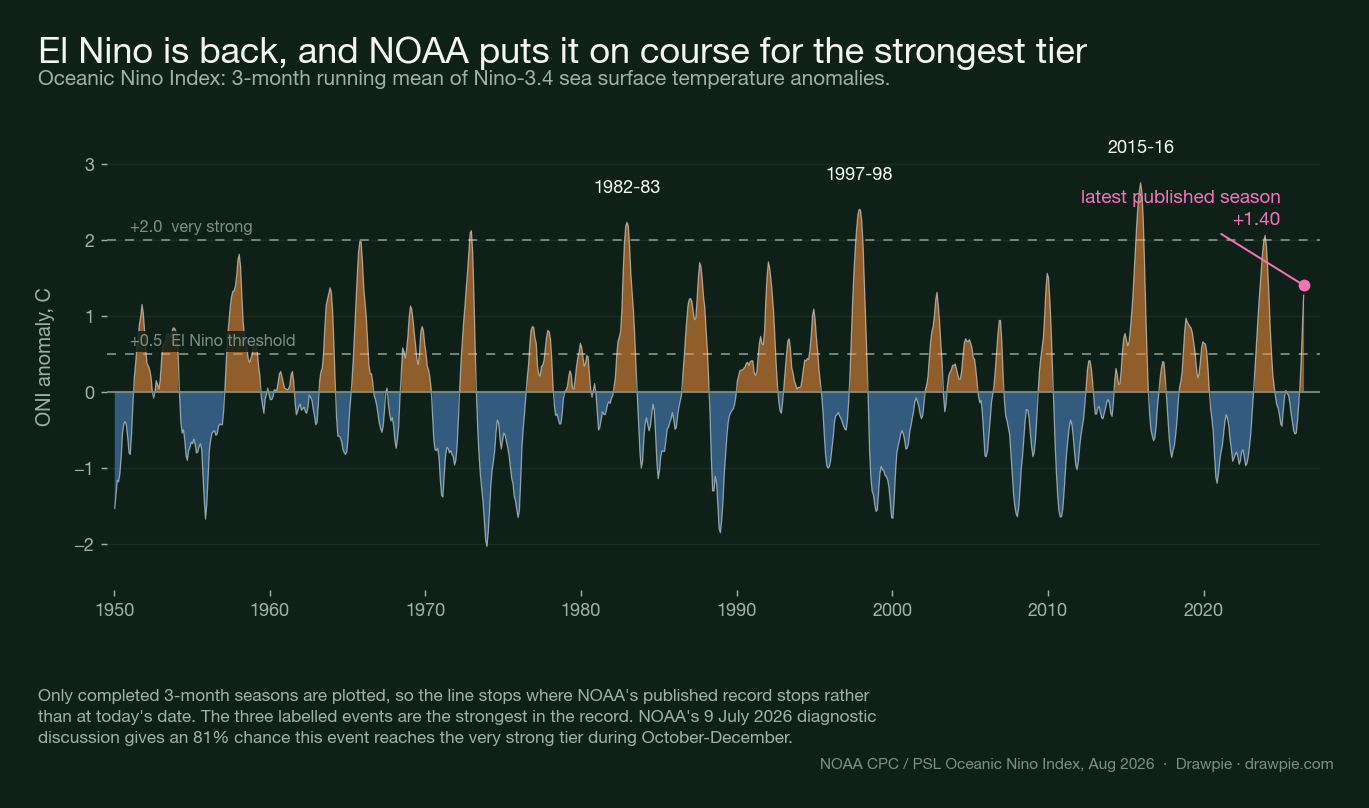
Chart: NOAA’s Oceanic Niño Index, the three-month running mean of Niño-3.4 sea surface temperature anomalies. Only completed seasons are plotted.
⚠️ That ranking is the ONI’s. On the RONI — the index CPC uses for its “historic” threshold — the same three events come out in a different order, and the current one sits lower. See below .
This matters because a lot of coverage still circulating online describes the coming winter as a La Niña winter. It is not. Here is the index, season by season through 2026:
| Season | ONI |
|---|---|
| Dec–Feb 2025-26 | −0.39 |
| Feb–Apr | +0.11 |
| Apr–Jun | +0.95 |
| May–Jul | +1.39 |
| Jun–Aug 2026 | +1.80 |
June–August has now been published, and it is +1.80 — the strongest reading of the event so far, and a jump of 0.41 on the previous season. It appears on all three NOAA products: PSL’s ONI file, CPC’s oni.ascii.txt, and CPC’s ERSSTv6 table. The −99.90 placeholder this page described has moved on to the July–September cell.
⚠️ Every earlier value in that table was revised down in the same update, by 0.01 to 0.03. This page previously printed −0.37, +0.13, +0.98 and +1.40; the current figures are −0.39, +0.11, +0.95 and +1.39. That is a routine reanalysis rather than a correction of anyone’s error, but it is why a figure you noted a week ago may not match.
✅ And the version footnote this page carried no longer applies. It explained a 0.01 gap between NOAA PSL’s ERSSTv6 file (+1.40) and CPC’s table (+1.39) for May–July. Both now read +1.39, and the two agree to two decimal places on every 2026 season. A gap does persist deep in the historical record — PSL gives −1.53 for DJF 1950 against CPC’s −1.32 — but that is not simply a version difference, so the old explanation has been dropped rather than restated.
NOAA’s 9 July diagnostic discussion put the latest weekly Niño-3.4 reading at +1.2 °C, with the far-eastern Niño-1+2 region at +2.7 °C, and described a downwelling Kelvin wave deepening the thermocline. The SST consolidation forecast reaches just under +2.5 °C by late autumn.
The probabilities NOAA attached in that July discussion: a 97% chance El Niño persists through early spring 2027, an 81% chance it is very strong during October to December, and 75% for November to January.
Those have since firmed twice. The 13 August discussion put a very strong event at greater than 90% for Northern Hemisphere autumn and winter, and added a figure the July one did not carry: a 69% chance that October to December produces a historic event exceeding every El Niño back to 1950. The 10 September discussion holds the first figure and raises the second to 75%.
| 9 July | 13 Aug | 10 Sep | |
|---|---|---|---|
| Very strong, autumn–winter | 81% | >90% | >90% |
| Historic Oct–Dec event | — | 69% | 75% |
Re-checked 28 September: the 10 September discussion is still the current one, and CPC’s own page confirms the next is 8 October and had not posted. Our companion snow page tracks CPC’s weekly monitoring update between discussions, including the latest weekly Niño-3.4 reading and a check of a secondhand claim about it — see 2026-27 US El Niño snow predictions rather than a repeat of that detail here.
The threshold is a RONI, and that changes the arithmetic
🔴 CPC states the historic-event threshold as “+2.5 °C or more for a 3-month RONI value” — not ONI. Almost every article you will read about this winter quotes the ONI, currently +1.80, next to a +2.5 threshold and leaves you to do the subtraction. That subtraction is wrong, because the two numbers are not the same index.
The Relative Oceanic Niño Index subtracts the tropical-mean sea surface temperature anomaly from the Niño-3.4 anomaly. In a tropical ocean that has warmed overall, it runs lower. Here is 2026 on both, straight from CPC’s two files:
| Season | ONI | RONI | Gap |
|---|---|---|---|
| Dec–Feb | −0.39 | −0.91 | −0.52 |
| Mar–May | +0.46 | −0.04 | −0.50 |
| May–Jul | +1.39 | +0.97 | −0.42 |
| Jun–Aug | +1.80 | +1.36 | −0.44 |
So the distance to “historic” is 1.14 °C, not 0.70 °C. Quoting the ONI makes the gap look 39% smaller than it is.
✅ And there is a reason CPC phrases it in RONI rather than ONI — the ONI version of the sentence would be false. On the ONI, 2015-16 already peaked at +2.59 and two of its seasons cleared +2.5. A “+2.5 ONI” event would not exceed every El Niño back to 1950; it would be the second one. On the RONI, nothing in the record since 1950 has ever reached +2.5 — the highest is +2.40, in 1982-83.
RONI also reorders the podium, which is the clearest illustration of what it is doing:
| Rank | By ONI | By RONI |
|---|---|---|
| 1 | 2015-16 +2.59 | 1982-83 +2.40 |
| 2 | 1997-98 +2.37 | 1997-98 +2.28 |
| 3 | 1982-83 +2.14 | 2015-16 +2.25 |
The three famous super-El Niños swap places depending on which index you use. That is not a quirk — it is the point of the relative index, and it is why the 75% figure is stated against it.
Where the warmth actually is
August’s index readings pull apart, and the spread is the useful part.
| Region | Aug 2026 | Where it is |
|---|---|---|
| Niño-1+2 | +3.4 °C | Off South America, far east |
| Niño-3 | +2.5 °C | Eastern equatorial Pacific |
| Niño-3.4 | +1.8 °C | Central-eastern — the headline index |
| Niño-4 | +0.1 °C | Western equatorial Pacific |
Every index rose over the month except Niño-4, which fell to +0.1 °C. CPC describes sea surface temperature anomalies exceeding +3.0 °C in the eastern equatorial Pacific, a subsurface index that held steady through August, and widespread subsurface anomalies in excess of +10.0 °C at depth.
This is an east-based event. That is worth holding on to when reading the analog winters below: the composite maps for El Niño are built mostly from east-based events, so the resemblance is closer than it would be for an event centred near the Date Line.
What did past strong El Niño winters actually do?
All eight of the strongest El Niño winters since 1950 were wetter than the US average. Six of the eight were warmer — and two were among the coldest fifteen winters in the record.
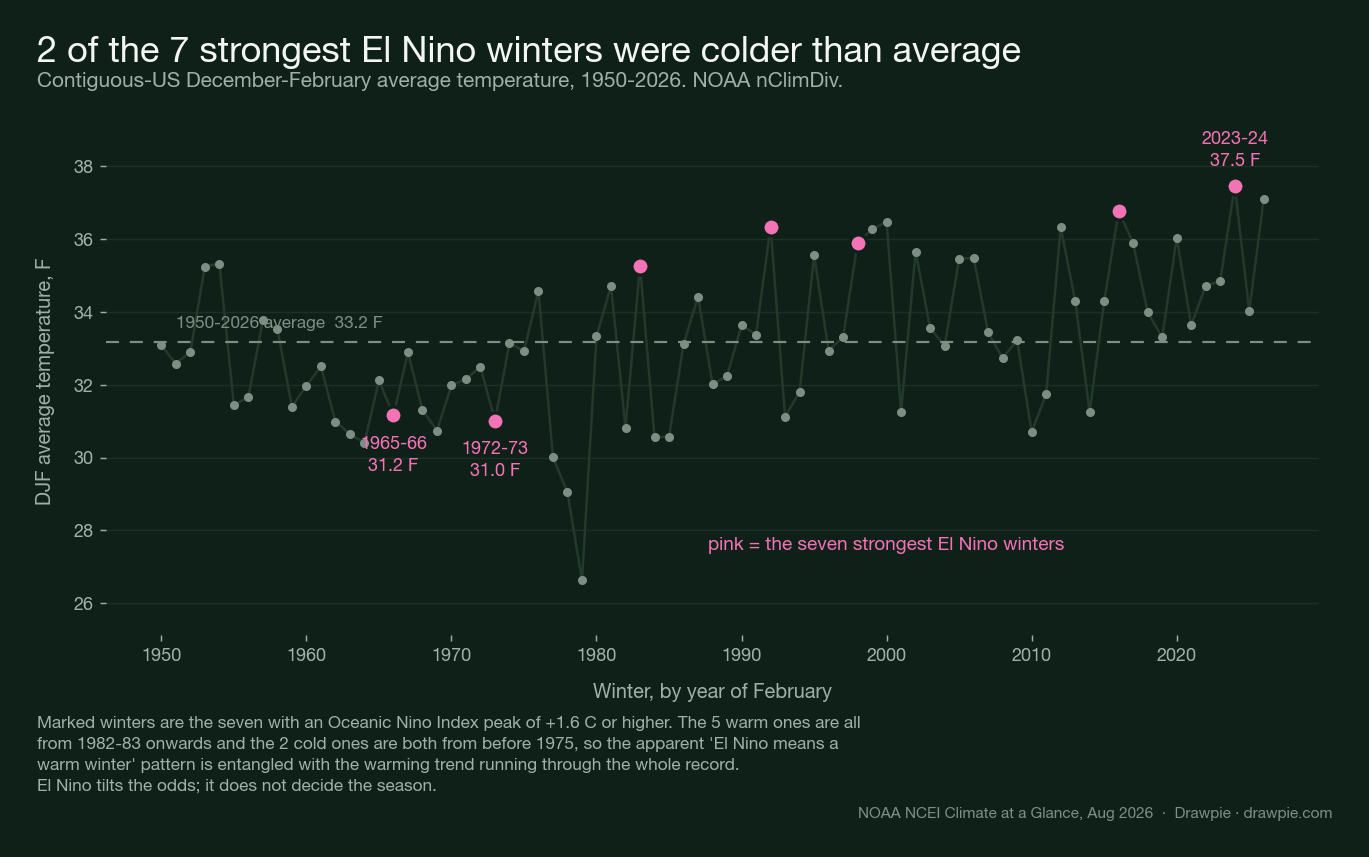
Chart: NOAA nClimDiv contiguous-US December-February average temperature. The marked winters are those whose Oceanic Niño Index peaked at +1.6 °C or higher.
We pulled NOAA’s national temperature and precipitation series for every winter since 1950 and looked at what the strong El Niño years actually delivered, rather than at what the composite maps say they should. The two right-hand columns are that winter’s rank out of 77, warmest and wettest first:
| Winter | ONI | Temp | Precip |
|---|---|---|---|
| 1957-58 | +1.81 | 31st | 30th |
| 1965-66 | +1.98 | 64th | 37th |
| 1972-73 | +2.12 | 66th | 22nd |
| 1982-83 | +2.23 | 16th | 3rd |
| 1991-92 | +1.71 | 5th | 26th |
| 1997-98 | +2.40 | 9th | 2nd |
| 2015-16 | +2.75 | 3rd | 9th |
| 2023-24 | +2.06 | 1st | 11th |
There is an interactive version of this table. Our US winter outlook explorer lets you move the ONI threshold and watch the hit rate change — at +1.6 every one of the eight was wetter than average, but drop the bar to +1.0 and it falls to 13 of 16. It also carries NOAA’s regional outlook for this winter, kept separate because that is a forecast and this table is not.
Two things fall out of that table.
The precipitation signal is the reliable one. Every single strong El Niño winter came in above the 1950-2026 average of 6.80 inches — although 1965-66 only just, by six hundredths of an inch. Two of them, 1997-98 and 1982-83, are the second and third wettest winters in the entire record.
The temperature signal is much weaker than its reputation. Five of the six warm ones are from 1982-83 onwards, the exception being 1957-58; the two cold ones are both from before 1975. That pattern is entangled with the warming trend running through the whole series, so “El Niño means a mild winter” is doing less work than it appears to. 1972-73 had a stronger El Niño than 1982-83 and was 4.3 °F colder.
For context on what you are comparing against, last winter — a weak La Niña — was the second warmest DJF on record at 37.07 °F and the fourth driest at 5.02 inches. The summer that followed it produced the July heat wave that ran across most of the eastern United States and an extreme heat watch across the Mid-South , so the ground the coming winter starts from is warm and, in much of the west, dry.
Which part of winter is most likely to turn — December, January or February?
NOAA’s own confidence rises as the winter goes on, and the history runs the other way: the eight analog winters put their biggest national anomaly in December and their smallest in January.
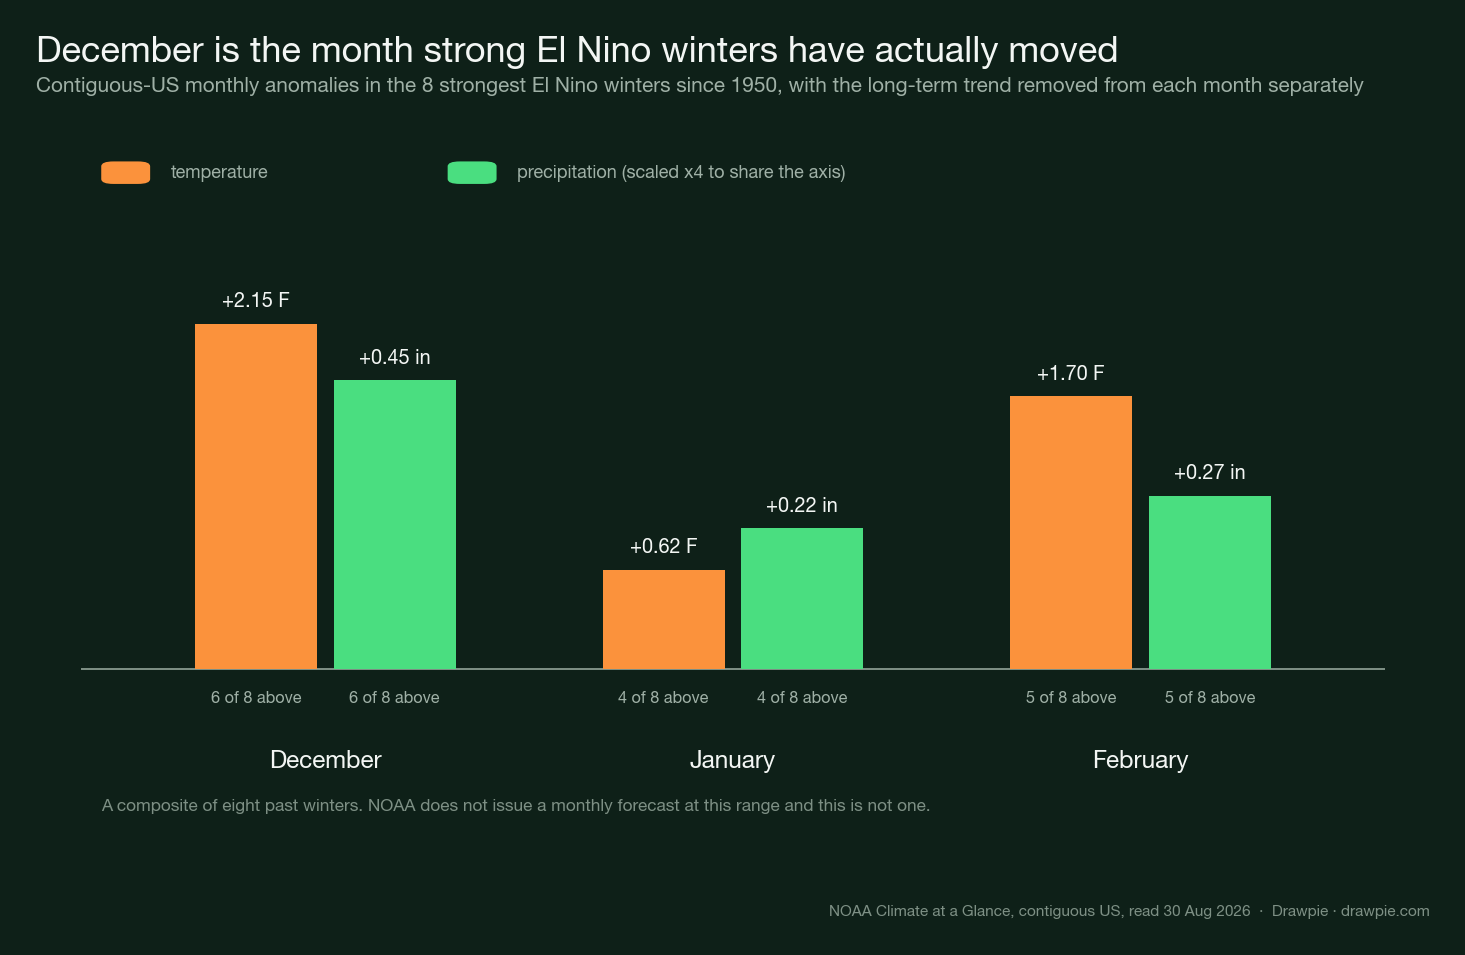
Detrended and averaged across the eight, December ran 2.15 °F above its own era and 0.45 inches wetter, and was above normal in six of the eight. February was next, at +1.70 °F in five of eight. January was a coin flip: +0.62 °F, above normal in four of the eight and below in the other four. That is the opposite of the intuition that a winter pattern needs a month or two to bed in.
The forecast side of the question moves the other way, because CPC’s overlapping three-month seasons get more confident later:
| Season | What sharpens |
|---|---|
| SON | Northeast and Great Lakes tilt dry |
| OND | Southern tier wet, but “modest”, 33–50% |
| NDJ | Southeast passes 60% wet; the East Coast flips to wet |
| DJF | Warm above 50% “from the Pacific Northwest to the Northeast” |
| JFM | Coastal California and southern Arizona wet, “peaking in coverage” |
In CPC’s own words the Southeast’s probabilities “exceed 60 percent … by NDJ and enhanced probabilities persist through JFM”, while the California signal runs “from DJF through FMA, peaking in coverage during JFM”. The Northeast is the clearest reversal on the page: modestly dry in the autumn, then “the tilt toward above normal precipitation extends along almost the entire East Coast from NDJ through FMA”.
Neither of those is a monthly forecast, and NOAA does not publish one at this range. CPC issues exactly one monthly outlook at a time: the current one covers September 2026: it went out on 20 August and was updated on 31 August. The next monthly outlook, for October, comes with the 17 September set. The long-lead set that runs into winter is thirteen overlapping three-month seasons with no individual month among them, so the first outlook naming December on its own is due in mid-November. The month-by-month numbers above are a composite of eight past winters — history, with a sample of eight.
Will it snow more or less this winter?
More in the southern mountains and the southern tier, less across a much larger northern area — and NOAA’s own phrase for El Niño is “the great snowfall suppressor over most of North America”.
The short version: above-average snow shows up in California, Nevada, Utah, Colorado, New Mexico and Arizona, on the high plains and in the Mid-Atlantic and southern Appalachians; below-average snow shows up from the Pacific Northwest through the northern Rockies and Great Lakes to interior New England and Alaska. Wetter is not the same as snowier, because the southern tier is wetter partly by being milder.
The snow half of the record is where the city-level numbers get emphatic, and unlike the temperature signal it survives the trend test without shrinking:
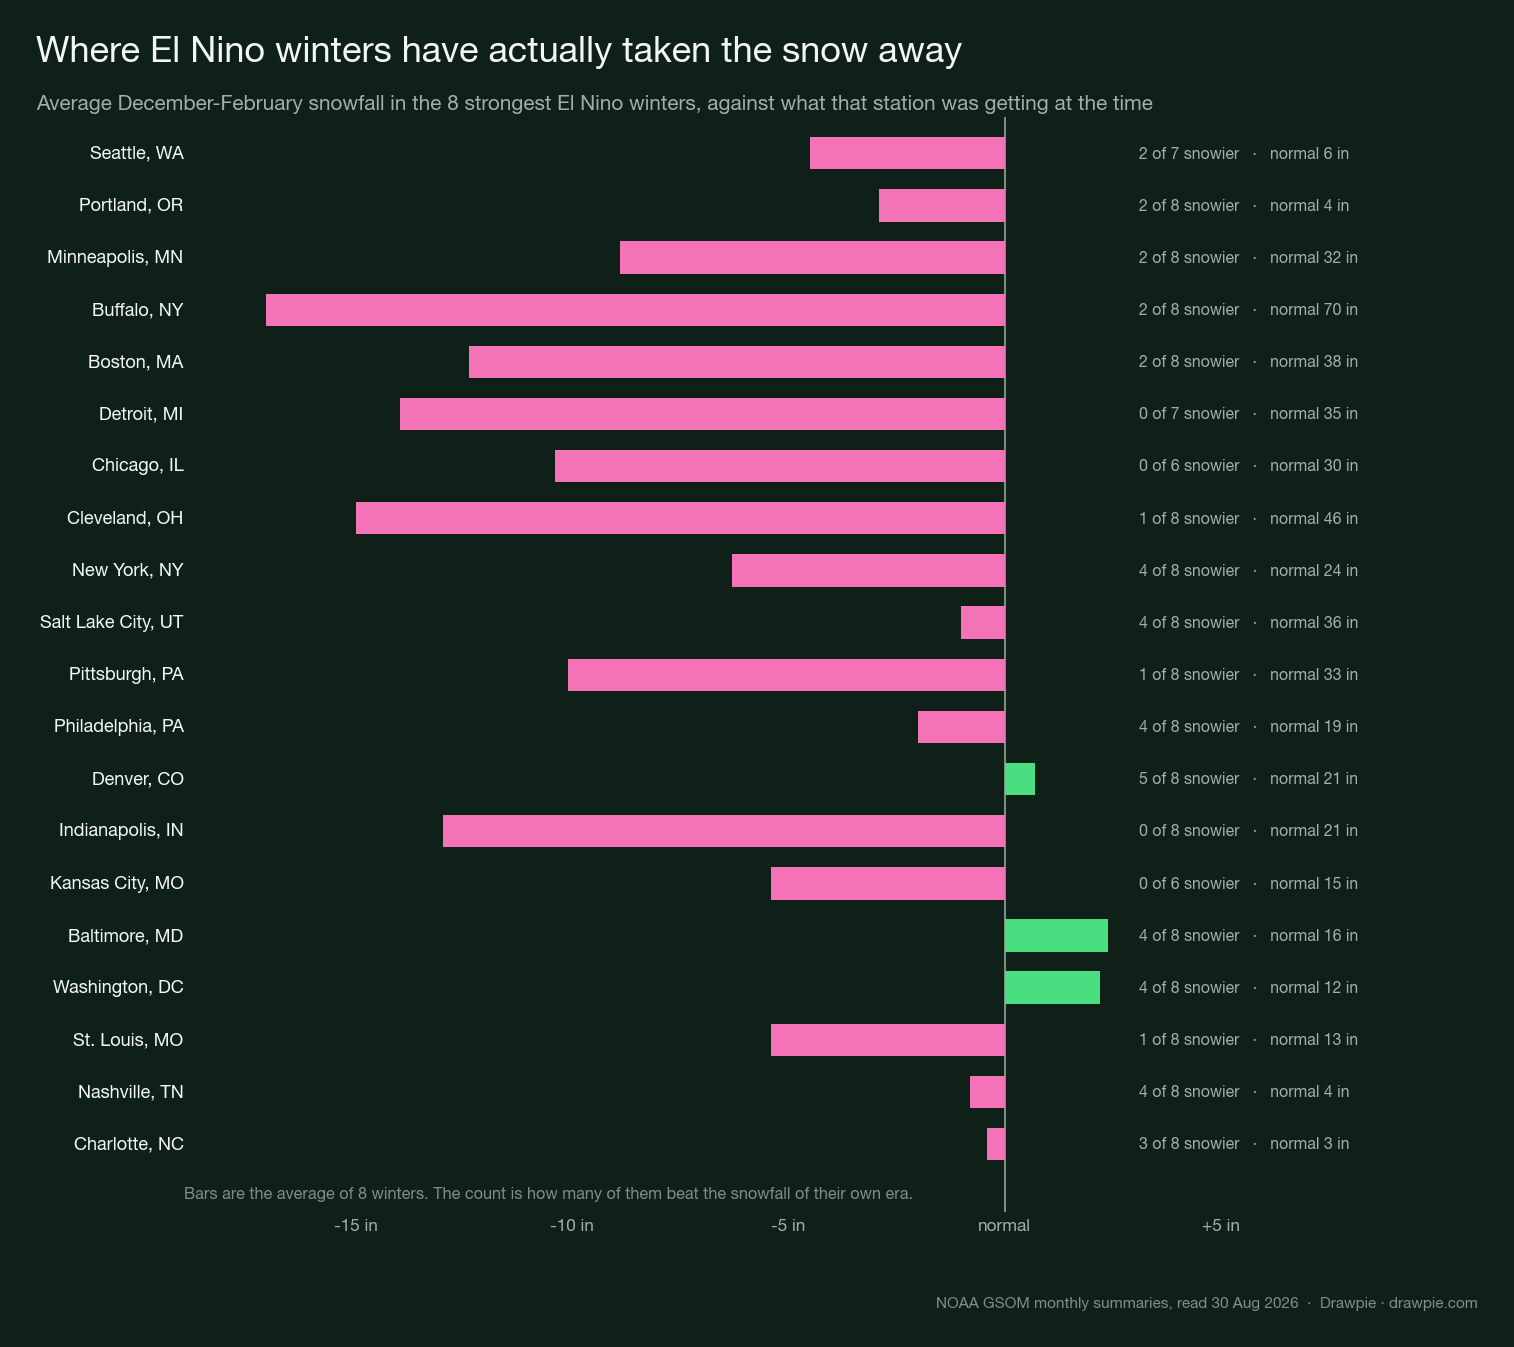
Detroit, Chicago, Indianapolis and Kansas City did not have a single above-normal December-February snowfall in any strong El Niño winter their records cover — 0 of 7, 0 of 6, 0 of 8 and 0 of 6. Cleveland and Pittsburgh managed one each out of eight. In inches the deficits are large: Buffalo averaged 17 inches below its own era, Cleveland 15, Detroit 14, Indianapolis 13, Boston 12.
Around Washington and Baltimore the sign flips — an average of about two inches more — but each was snowier in only four of eight, which is what no signal looks like. Denver is the same: +0.7 inches, five of eight.
We have given snow its own page, because the region-by-region picture and the reasons a stronger event does not mean more snow need more room than a section: 2026-27 US El Niño snow predictions .
What could actually disrupt daily life this winter?
Not snowfall totals. The things that close a road, empty a fridge or kill someone are ice, brief violent squalls and long cold snaps, and none of them show up in a seasonal outlook.
This section is background on the hazards, not a forecast of any of them. A seasonal outlook cannot tell you whether there will be an ice storm; what it can do is tell you which failure modes are worth being ready for where you live.
| Where | Hazard | Why |
|---|---|---|
| Great Lakes, interior Northeast | Snow squalls, cold snaps | Less snow does not mean fewer whiteouts |
| Mid-Atlantic, Ohio Valley, Appalachians | Ice | A milder, wetter track puts storms on the freezing line |
| Southern tier | Rain, flood, severe weather | The wettest signal in the outlook is here |
| West Coast, Southwest | Mountain snow, rain, flood | Above-50% wet from DJF, peaking in JFM |
| Anywhere | Power cuts | Winter caused 23% of major US weather outages |
Ice is the one to plan for in a mild, wet winter. The National Weather Service treats a quarter of an inch on an elevated surface as the benchmark for significant accumulation, and its own directive says why: “Significant accumulations of ice pull down trees and utility lines, resulting in loss of power and communication.” The warning threshold itself is not a national number — it is set locally, and NWS explicitly allows “both higher thresholds for regions that are accustomed to ice events and lower thresholds for areas where lesser amounts can cause major problems”. State College’s office, for instance, publishes 0.25 or 0.50 inch depending on where you are in its area.
Snow squalls are the most dangerous winter product almost nobody knows about. They are short — NWS puts them at 30 to 60 minutes against a snowstorm’s hours or days — and the accumulation is “typically an inch or less”. The danger is not the snow. It is that “the sudden white-out conditions combined with falling temperatures produce icy roads in just a few minutes”, on a road that was merely wet a moment earlier. The Snow Squall Warning is modelled on a tornado warning: valid 30 to 60 minutes, aimed at a small area, and since the 2023-24 season only those tagged “Significant” set off a phone alert. NWS’s advice is blunter than usual — “There truly is no safe place on the highway during a snow squall” — and it warns specifically against braking hard, because of the chain-reaction risk.
The cold products changed name and a lot of coverage has not caught up. From 1 October 2024 the Wind Chill Warning became the Extreme Cold Warning, the Wind Chill Watch became the Extreme Cold Watch, and the Wind Chill Advisory became the Cold Weather Advisory. NWS’s reason was that the old name taught the wrong lesson: the change was meant “to clarify that cold can be dangerous with or without wind”. The current warning triggers on air temperature or wind chill against locally set criteria — in central Pennsylvania, −20 °F south of I-80 and −25 °F north of it.
On the roads, the widely quoted figure is the wrong one. FHWA’s Snow and Ice page says 24% of weather-related crashes happen on snowy, slushy or icy pavement and that over 1,300 people are killed on it annually — and attaches no date and no source to either number. FHWA’s own dated statistics, five-year averages for 2019–2023 built from NHTSA data, say something different and smaller: snow or slushy pavement is 186,076 crashes and 496 deaths a year (16% of weather-related crashes), icy pavement 156,164 crashes and 521 deaths (13%). We use the dated pair. Winter’s real signature on traffic is delay rather than death: arterial speeds fall 30–40% on snowy or slushy pavement.
Power is the thing that turns a storm into a week. Climate Central’s analysis of two decades of utility filings puts winter weather behind 23% of major weather-related US outages between 2000 and 2023 — 398 events — behind severe weather at 58%. That is Climate Central’s own re-analysis, not a federal statistic; EIA’s reliability reporting does not break outages down by weather type. What EIA does report is that the average US customer lost 11 hours of electricity in 2024, nearly twice the previous decade’s average, with major events accounting for 80% of those hours.
For scale on the human cost, NWS’s own hazard statistics put the 10-year averages at 35 US deaths a year from cold and 27 from winter weather, against 279 from heat. Those counts swing hard: cold killed 106 in 2021 and 11 in 2023. NWS itself names the CDC, not NWS, as the official source for weather-related cause of death.
Does El Niño raise Florida’s winter tornado risk?
Yes, and it is the one part of the country where that is true. We counted it out of the Storm Prediction Center’s own database: 19 Florida tornadoes per winter in the eight strongest El Niño winters, against 7 in every other winter since 1950-51.
The same holds for the stronger ones: 10.6 rated (E)F1 or above per winter against 3.9. Because tornado reports rise through the record as detection improves, we also expressed Florida as a share of the national December-February count, which cancels a nationwide reporting trend — the gap narrows but survives, 18.1% against 11.7%, and 15.4% against 9.3% for F1 and above. Four of the eight winters land in the top decile of all 75, where chance would put 0.8 of them.
NWS says the same thing from the physics. Its Tampa Bay office finds that since 1969-70 “Strong El Niño events have more than double the number of severe weather events … than the other ENSO categories”, because “with the jet stream further south and stronger we tend to see a higher number of severe weather events”. Its Tallahassee office puts the Florida average at “20 tornado events per year” in a strong El Niño. Its Melbourne office is the one that put the causal limit best: “El Niño does not cause violent tornadoes in Florida, but it enables them.”
The spread is wide and the average hides it. 1965-66 produced no Florida winter tornadoes at all. 1997-98 produced 46, including the outbreak of 22-23 February 1998 that killed 42 people and injured more than 260 — the deadliest in Florida’s history, and one NWS’s service assessment ties to “a stronger-than-normal subtropical jet stream” at 140 knots.
This does not generalise to the rest of the country, and that is the part coverage usually gets wrong. The Storm Prediction Center’s own study of the record found that during El Niño winters US tornado outbreaks tend to be weaker and less frequent nationally, with the activity relocating rather than increasing — “mainly limited to the Gulf Coast states, including central Florida”. Of the fifty states, Florida is the only one whose winter tornadoes are “markedly stronger” with “longer tracks” in El Niño winters. Mississippi, Alabama and Louisiana all come in below their expectation.
Will heating bills be higher this winter?
The dollar figure is not published yet — EIA’s Winter Fuels Outlook accompanies the October Short-Term Energy Outlook, scheduled for 6 October 2026 — but the weather input already is, and it points slightly mild: EIA’s September outlook expects 3,392 population-weighted heating degree days this winter, about 2% fewer than the 2016-2025 average.
Heating degree days are the mechanism by which a weather forecast becomes a bill. EIA measures them against a 65 °F base, weights them by population, and assumes heating consumption “varies in proportion to heating degree days”. Its current month-by-month expectation for 2026-27, against the ten-year average:
| Month | 2026-27 | 10-yr avg |
|---|---|---|
| October | 237 | 219 |
| November | 479 | 494 |
| December | 714 | 726 |
| January | 791 | 837 |
| February | 644 | 659 |
| March | 526 | 525 |
| Winter | 3,392 | 3,461 |
October and March both run slightly above their ten-year averages; January is furthest below, by 5%. ⚠️ This page previously said October was the only month above, which was an artefact of its own rounding: the March average is 525.47, which rounds to 525 rather than the 526 printed here before, so what looked like an exact tie is in fact 525.79 against 525.47. The difference is a third of a degree day and changes nothing about the winter — but “the one month” was wrong, so it is fixed.
🔴 These numbers are not a forecast of this winter, and EIA says so in the footnote under its own table. The source note on Table 9c reads: “Current month based on forecasts by the NOAA Climate Prediction Center. Remaining months based on the 30-year trend.” September was the current month when this issue closed. Everything from October onward is trend extrapolation, not a prediction.
That is worth stating plainly because the table looks like a winter forecast and is widely reported as one. It is the answer to “what would a normal-ish winter on the current climate trend cost to heat”, which is a useful question and a different one.
✅ This also explains something we got wrong. This page previously warned that the table was “about to be superseded” by the September STEO on 9 September. The September issue came out and did not move a single one of these numbers. We pulled the monthly series from both releases’ own base-case workbooks and compared them cell by cell: every month from October 2026 through March 2027 is identical to two decimal places. The only cells that changed are May to September 2026 — the months that turned from forecast into observation. A figure built from a 30-year trend does not go stale monthly, and our warning that it would was wrong. 3,392 is now the September figure.
What lands on 6 October is the money. The Winter Fuels Outlook covers the four main US heating fuels — natural gas, electricity, propane and heating oil — and forecasts average household expenditures for November through March, for the country and, depending on the fuel, for up to four census regions. It is not a single number: EIA publishes the base case alongside two side cases in which every region is 10% colder or 10% warmer in heating degree days, and notes that nine of the previous ten winters fell inside that band. The figures are nominal, on an assumed 2% inflation, and EIA warns against reading them across fuels as a switching comparison.
Two cautions about that date. It is the scheduled date of the October STEO, which EIA’s own release schedule annotates “Winter Fuels Outlook” — not a separately announced date for the supplement. Last year the schedule said 7 October 2025 and the supplement appeared on 15 October; the year before, it came out with the STEO on the day. And no 2026-27 edition exists yet: the URL the 2026 article would live at returns 404, as do two invented siblings on the same host, so nothing has been quietly pre-staged.
The one piece of background already on the record is on the supply side, and it is EIA’s own — but it was revised down in September and the language around it was toned down with it.
| August STEO | September STEO | |
|---|---|---|
| Gas in storage, 31 Oct 2026 | 3,985 Bcf | 3,969 Bcf |
| Against the five-year average | 5% above | 5% above |
| How EIA described it | “a record”, “highest level heading into winter since 2016” | “relatively high” |
⚠️ The word “record” is gone, and so is the comparison to 2016. The September issue drops both, along with the administrator’s quote about inventories providing “a cushion” for winter heating. It says instead that inventories are “set to be relatively high heading into the winter heating season” at 5% above the previous five-year average and 1% above October 2025. The volume moved by 0.4%; the framing moved considerably more, and a page still quoting “record” would now be quoting a withdrawn description.
September also breaks it out by region, which is the part that matters for heating. Entering the withdrawal season, EIA puts the Mountain region 21% above its five-year average, the Pacific 10%, the Midwest 6% and South Central 4% — while the East is about level with it, having started the injection season 11% below after a cold winter drew stocks down. The national surplus is real, and it is not evenly distributed: the region carrying the smallest one is the populous East.
This page will not turn any of that into a number on your bill. Storage volumes and degree days are physical quantities EIA has published; what a household pays depends on retail rates, the state you are in and the weather that actually happens. The expenditure forecast is EIA’s to make, and it makes it on 6 October.
Why do NOAA and the almanacs disagree?
Less than the headlines suggest — and the sharpest disagreement is over a corridor where NOAA has declined to forecast anything at all.
Three publications are involved and two of them are constantly mistaken for each other. The Old Farmer’s Almanac (almanac.com, founded 1792) published its 2026-27 winter forecast on 27 August 2026. The Farmers’ Almanac (farmersalmanac.com, founded 1818) published its own on 6 August 2026. They are separate businesses. NOAA is the third.
| NOAA | Old Farmer’s | Farmers' | |
|---|---|---|---|
| Form | Odds | Regional | Regional |
| Base | 1991–2020 | same | none given |
| Lead | Monthly | Annual | 2 years |
| Redo | Monthly | — | Never |
| Snow | No | Regional | Regional |
| Basis | Models | Solar | Planets |
| Score | Verified | 80% | Yearly |
Rows: how the forecast is expressed; the normals it is measured against; how far ahead it is made; whether it is revised afterwards; whether it gives snowfall; the stated method; and how accuracy is claimed.
In their own words: the Old Farmer’s Almanac’s forecasts rest on “a unique formula that combines solar science, climatology, and meteorology”, descended from a method its 1792 founder built around sunspots and which it still calls “secret” and “proprietary”. The Farmers’ Almanac’s formula “incorporates … sunspot activity, tidal action of the Moon, the position of the planets, and more”, is attributed to a prognosticator whose identity is a brand secret, and is fixed a long way ahead: “the Almanac’s forecasts are calculated two years in advance. Once the new edition is printed, the editors never go back to change or update its forecasts.”
Start with what they agree on. All three describe a broadly mild winter driven by El Niño. The Old Farmer’s Almanac’s own headline is “Mostly mild, with a colder stretch from central New England through the Appalachians and Ohio Valley, plus Hawaii”, and it names the same driver NOAA does — “A strong El Niño has returned and is expected to continue through winter” — while adding one NOAA does not use: “Solar Cycle 25 is past its peak, and solar activity is waning.” The Farmers’ Almanac likewise puts El Niño behind “wetter-than-normal conditions across much of the southern United States”, and for the north forecasts temperatures that “should average near normal overall” with cold arriving in bursts rather than as a cold season.
Now the real disagreement, which is narrower than it sounds. The Almanac’s cold corridor runs central New England → Appalachians → Ohio Valley. NOAA’s 20 August outlook favours above-normal temperature at better than 50% “from the Pacific Northwest to the Northeast” — a direct conflict at the New England end. But over the Ohio and Tennessee Valleys, NOAA’s temperature cell for this winter is not stated: the agency declines to lean. So the place the Almanac is most confident about is the place NOAA has explicitly refused to forecast.
It is also worth noticing that the Almanac’s own Northeast region is split rather than uniformly cold — “Above normal in the north; below normal in the south” — so “the Almanac says New England will be cold” is not quite what the Almanac says.
They are not measured against different yardsticks. Both use 1991–2020 normals; the Almanac moved to that base with its 2023 edition, the same period CPC adopted in May 2021. The difference is not the baseline. It is the form of the claim.
NOAA publishes a probability of a three-month average landing in the warmest, middle or coldest third of the 1991–2020 distribution, and says “equal chances” when it has no lean. An almanac publishes a regional statement, in advance, and does not revise it. A probability and a statement cannot be scored against each other without first agreeing what counts as a hit — which is exactly the ground the accuracy argument is fought on. The Old Farmer’s Almanac’s own definition is narrow and it says so: 80% “means that, on average, The Old Farmer’s Almanac correctly predicts the direction of seasonal temperature and precipitation departures from normal about 80% of the time. It does not mean that every daily temperature or precipitation event is predicted correctly.” It grades itself against one representative city per region, and scored last winter at 88.9%.
The practical answer for a reader. If you want to know how likely a warm winter is where you live, the outlook is the document with a number attached to it. If you want a seasonal snowfall figure, only the almanacs will give you one, and NOAA’s reason for not giving you one is worth reading first: “The outlook does not project seasonal snowfall accumulations as snow forecasts are generally not predictable more than a week in advance.”
When does NOAA’s winter forecast actually come out?
Two different things come out on two different schedules, and 2026 is the year they collide on the same day: 15 October.
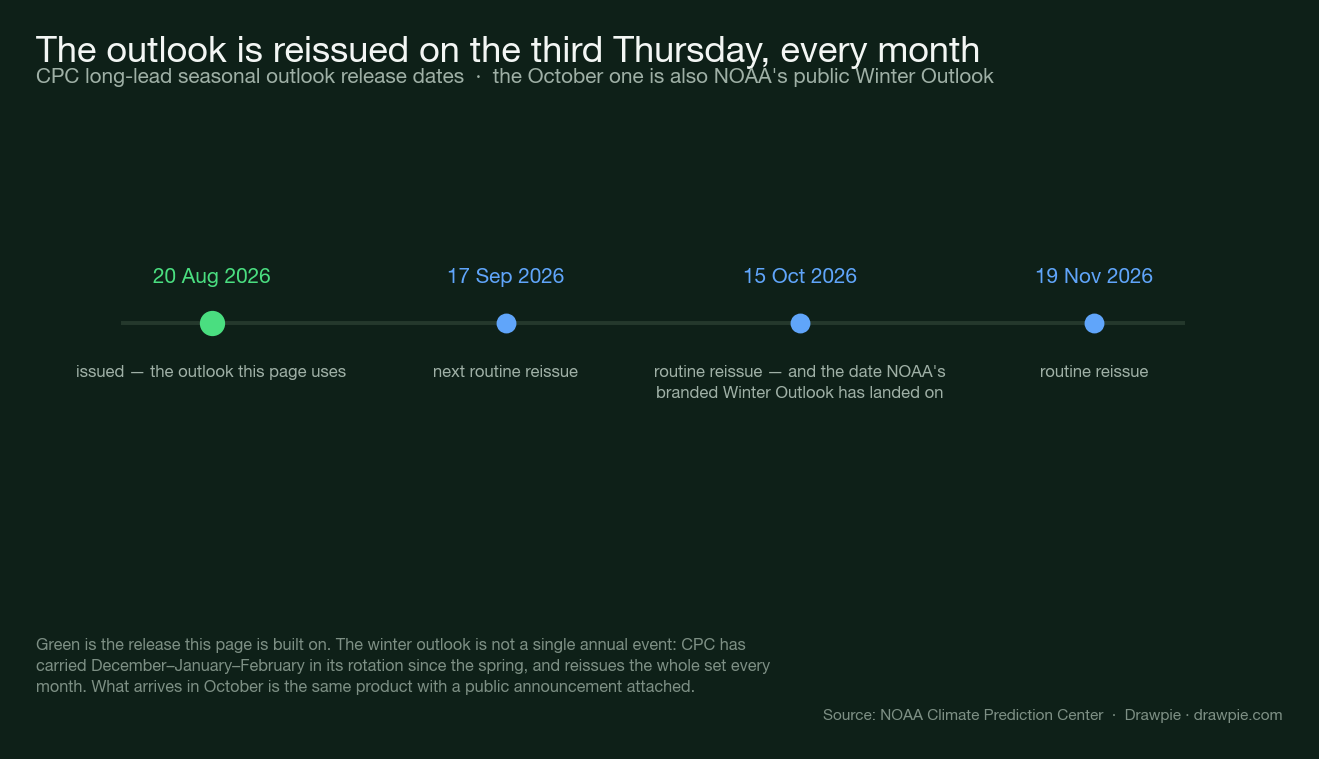
There are two clocks here and confusing them is the whole problem. The routine long-lead outlook set — the one every figure above comes from — is reissued on the third Thursday of every month, and has carried a December–January–February forecast since the spring. NOAA’s branded Winter Outlook, the one that gets a press release and a map in the news, is an annual event.
The dates line up in a way worth noticing: the routine reissue in October 2026 falls on 15 October, and that is also the third Thursday NOAA has put its Winter Outlook out on for four years running. So the flagship and the routine release are due the same day — assuming nothing gets in the way of the announcement, which is exactly what happened last year.
The one everybody means is not out yet, and the date to put in the diary is Thursday 15 October 2026.
There are two different NOAA products with a claim on the phrase “winter forecast”, and almost every argument about this topic is really two people talking about different documents.
The flagship U.S. Winter Outlook is the one with the press release and the three coloured maps of the country — temperature, precipitation and drought, for December through February. It is issued once a year, in October, and it is what a news story means when it says NOAA’s winter forecast is out.
The long-lead seasonal outlooks are the monthly workhorse. The Climate Prediction Center reissues a rolling set of them every month, each covering the next twelve overlapping three-month seasons — which means a December-February 2026/27 forecast has already been in the set for months, and simply gets reissued at a shorter lead each time. The current one was issued on 20 August. It is a real NOAA forecast for this winter. The regional tilt set out above is read from that 20 August set, region by region — it replaced the 16 July version this page previously quoted.
Why 15 October, and how firm is that?
Firm on the schedule, and a four-year pattern on the press release. Two separate things point at the same day.
The Climate Prediction Center publishes its release calendar in advance. Its own wording is that forecasts “are released on the third Thursday of the month”, generally around 8:30 AM Eastern. The four releases that carry us into winter, with the August release now past:
| Release | Date | Covers |
|---|---|---|
| Forecast 9 | Thu 20 Aug 2026 — released | SON 2026 – SON 2027 |
| Forecast 10 | Thu 17 Sep 2026 — released | OND 2026 – OND 2027 |
| Forecast 11 | Thu 15 Oct 2026 — next | NDJ 2026 – NDJ 2027 |
| Forecast 12 | Thu 19 Nov 2026 | DJF 2026 – DJF 2027 |
That is the schedule, published by NOAA, and 15 October is a fact on it rather than a guess.
What is a pattern rather than a promise is the flagship. NOAA has put its Winter Outlook out on that same October release day four years running, and last year it was the announcement, not the data, that came apart. Re-checked 28 September 2026 against noaa.gov’s own news releases, which run through 24 September with nothing under the Winter Outlook name yet:
| Winter | Outlook issued | Announced |
|---|---|---|
| 2022–23 | 20 October 2022 | same day |
| 2023–24 | 19 October 2023 | same day |
| 2024–25 | 17 October 2024 | same day |
| 2025–26 | 16 October 2025 | 21 November 2025 |
| 2026–27 | not issued | — |
The first four are third Thursdays of October, which we computed rather than eyeballed.
The 2025 split is worth understanding, because it is the clearest evidence for the two-clocks argument on this page. The 43-day federal shutdown ran from 1 October to 12 November 2025, straight through the October release. The outlook itself still went out on the third Thursday — coverage that weekend described NOAA as having “quietly released it’s outlook for the upcoming winter season on Thursday, sans press conference since the government shutdown continues”, with the press conference “rescheduled to November”. NWS’s own local write-ups then dated the flagship to the announcement: “NOAA’s U.S. Winter Outlook released on November 21”.
NOAA has not announced the 2026–27 date. The honest form of the claim is: the seasonal outlook release is scheduled for 15 October, the flagship has accompanied that release every year we checked, and in one of those four years the public announcement of it arrived five weeks later than the data did.
So what is published right now?
| Product | Cadence | Last | Next |
|---|---|---|---|
| ENSO discussion | Monthly | 10 Sep 2026 | 8 Oct 2026 |
| Seasonal outlooks | Monthly | 17 Sep 2026 | 15 Oct 2026 |
| Winter Outlook | Annual | 16 Oct 2025** | 15 Oct 2026* |
*Not announced by NOAA. 15 October is the third Thursday and matches four years of precedent, and it is on CPC’s published release calendar for the routine set. **The 2025–26 outlook went out on 16 October during the federal shutdown; NOAA’s public announcement of it followed on 21 November.
The Climate Prediction Center’s long-lead prognostic discussion for the 20 August set is timestamped 8:30 AM EDT on Thursday 20 August 2026, and the regional tilt at the top of this page is still read from it region by region. A newer set followed on 17 September (timestamped 8:30 AM EDT that day) and is confirmed to carry the same El Niño strength framing and the same overall regional shape, but this page has not yet been rebuilt cell by cell from it — the next one due, 15 October, is the point to do that rebuild properly rather than piecemeal.
The 8 October date is not our inference either. The 10 September discussion ends by naming it: “The next ENSO Diagnostics Discussion is scheduled for 8 October 2026.”
The practical consequence for a reader in late September. Anything you see today headlined “NOAA’s winter forecast” is describing the monthly seasonal outlook, not the flagship — which is fine, because the monthly outlook is a genuine NOAA product covering this winter. What it is not is necessarily the newest. The version most stories are written from went out on 20 August; a fresher set landed on 17 September, and the next lands on 15 October — the same day the flagship Winter Outlook is due if it follows its four-year pattern.
Three things could still move the picture between now and October: whether the event peaks near +2.5 °C on the RONI or falls short, how the Madden-Julian Oscillation behaves through the winter, and whether the polar vortex holds. None of the three is settled yet, and the last two are essentially unpredictable at this range. The first one has further to travel than the widely-quoted ONI makes it look — see the index section above.
The bottom line
The 2026/27 US winter will be an El Niño winter, very likely a strong one, and NOAA gives it a real chance of ranking among the biggest events since 1950. The official tilt is wetter across the south with the Southeast most strongly favoured, drier across the Northwest and the northern tier, and milder over most of the country outside the southern states.
The historical record supports the wet part more firmly than the mild part. Every strong El Niño winter since 1950 was wetter than average; two of them were among the coldest in the record. If you want one sentence to carry through to December: El Niño reliably moves the storm track, and much less reliably moves the thermometer.
At the scale of a street rather than a region, three things in the record are firmer than the national average is. The northern tier really did run warm in these winters — Boston, Buffalo, Cleveland and Minneapolis in all eight. The Great Lakes and Ohio Valley really did lose snow, and Detroit, Chicago, Indianapolis and Kansas City did not have a single above-normal winter among them. And Florida really did get more winter tornadoes, by a factor of about two and a half. Everywhere else, and especially across the southern tier, the honest reading of eight winters is that they do not tell you much.
Sources
| Source | What it supports here |
|---|---|
| CPC: ENSO diagnostic discussion | The El Niño Advisory, the greater-than-90% very strong figure, the 75% chance for October–December and its statement in RONI terms, August’s four Niño index values, the subsurface anomalies, and the 8 October date for the next discussion |
| CPC: Relative Oceanic Niño Index | Every RONI value in the comparison table, the +2.40 record peak in 1982–83, and that no season since 1950 has reached +2.5 |
| CPC: Oceanic Niño Index, ERSSTv5 | Every ONI value beside it, including the +2.59 peak in 2015–16 that the RONI framing exists to avoid |
| CPC: long-lead forecast release schedule | Every release date in the schedule table — 20 August, 17 September, 15 October and 19 November 2026 — the third-Thursday rule and the 8:30 AM Eastern release time |
| CPC: seasonal outlooks | That the current set already carries a December–February 2026/27 outlook, and that official 90-day outlooks are issued monthly near mid-month |
| CPC: long-lead prognostic discussion, 17 September 2026 | Confirmation that the 17 September set is issued, its timestamp, and that its El Niño strength framing and overall regional shape match the 20 August set |
| NOAA: news releases | That no U.S. Winter Outlook release exists yet as of 24 September 2026, the most recent release listed at the time of this check |
| NOAA: U.S. Winter Outlook, 2022–23 | The 20 October 2022 issue date, read from the release’s own timestamp, and what the flagship product contains |
| NOAA: U.S. Winter Outlook, 2023–24 | The 19 October 2023 issue date |
| NOAA: U.S. Winter Outlook, 2024–25 | The 17 October 2024 issue date |
| NOAA PSL: Oceanic Niño Index | Every ONI value in the season table and on the chart, including that May–July 2026 is still the last completed season, and the ERSST v6 rebasing of 4 August 2026 |
| CPC: ONI, version 5 | The +1.39 May–July figure that the older version of the same index gives |
| NOAA nClimDiv, via Climate at a Glance | Contiguous-US December–February temperature and precipitation for every winter since 1950, the rankings of the eight strongest El Niño winters, and the December, January and February series behind the month-by-month chart |
| NCEI: Global Summary of the Month | Every metro’s monthly temperature, snowfall and heating degree days, from which the El Niño columns and both metro charts are computed |
| NCEI: 1991–2020 Climate Normals | Each metro’s normal December–February temperature and snowfall, and the first-freeze dates at the 10%, 50% and 90% probability levels |
| SPC: severe weather database, 1950–2025 | Every Florida and national winter tornado count on this page, including the 1997–98 total and its fatalities |
| SPC: Cook and Schaefer on ENSO and tornado outbreaks | That El Niño winters relocate rather than amplify US tornado outbreaks, and that Florida is the only state with markedly stronger winter tornadoes |
| NWS Tampa Bay, Tallahassee and Melbourne on ENSO | The physical mechanism behind Florida’s El Niño severe-weather signal, and the offices’ own counts |
| NWS Instruction 10-513, winter weather products | The ice-accumulation benchmark, the local-criteria rule, and the snow squall warning definition and valid times |
| NWS Instruction 10-515, non-precipitation products | The current Extreme Cold Warning and Cold Weather Advisory definitions |
| FHWA: road weather management | The 2019–2023 crash, injury and fatality averages by pavement condition, and the speed reductions |
| Climate Central: weather-related power outages | The 23% winter share of major weather-related outages, 2000–2023 |
| EIA: STEO release schedule | The 6 October 2026 date and the “Winter Fuels Outlook” annotation on it |
| EIA: Short-Term Energy Outlook, September 2026 | The 3,969 Bcf storage figure, the regional storage breakdown, the “relatively high” description, and Table 9c’s note that months beyond the current one come from the 30-year trend |
| EIA: STEO September base case workbook | Every monthly heating degree day figure, series ZWHDPUS and ZWHD_US_10YR in sheet 9ctab, and the cell-by-cell comparison against the August workbook |
| EIA: Winter Fuels Outlook 2025–26 | What the product contains, the November–March expenditure period, and the ±10% weather side cases |
| The Old Farmer’s Almanac: 2026–27 winter forecast | Its cold corridor, its snow regions, its stated drivers and its method |
| The Farmers’ Almanac: 2026–27 winter forecast | Its regional statements, and the separate methodology page for its formula |
| NWS La Crosse: winter 2025–26 outlook | That NOAA’s 2025–26 Winter Outlook was announced on 21 November 2025 |
Checked 21 August 2026; re-checked 2 September 2026. Re-checked again 13 September 2026, when the September ENSO discussion and the September STEO were both read in full: the ENSO figures moved, the STEO’s winter degree days did not, and its storage figure and framing did. Re-checked again 28 September 2026, a lighter-touch pass: the 17 September long-lead set and the continued absence of a flagship Winter Outlook release were both confirmed directly against CPC’s and NOAA’s own pages, and a secondhand weekly Nino-3.4 claim was run down and written up on the companion snow page rather than here. Both ONI tables still end at June–August and are unchanged. Every source added on 30 August 2026 was opened and read on that date. No affiliate links, and no payment was received for any link on this page.
Seasonal outlooks are probabilistic statements about three-month averages over large regions. They are not forecasts of individual storms, snowfall totals or conditions on any given date. For decisions that depend on actual weather, use your local National Weather Service forecast office.
How we verified this
✅ Re-checked 28 September 2026 directly against CPC’s own pages, lighter-touch than the 13 September pass. The 17 September long-lead outlook set is confirmed issued (830 AM EDT Thu Sep 17 2026) and carries the same El Niño strength framing as the 10 September ENSO discussion — greater than 90% very strong, 75% historic on the RONI — with the same overall regional shape: still no region favoured for below-normal temperature, still wetter south and drier north. The regional table and chart on this page are still specifically built from the 20 August set; they have not been rebuilt cell by cell from the 17 September one in this pass, and that is stated rather than papered over. The ENSO Diagnostic Discussion itself is unchanged — still 10 September, with 8 October confirmed by CPC’s own page as next and not yet posted. NOAA’s flagship Winter Outlook remains unissued: noaa.gov’s news releases run through 24 September with nothing under that name.
✅ A secondhand claim of a roughly +3.0°C WEEKLY Nino-3.4 reading around 16 September was run down against a primary source rather than repeated here. That check, including why a weekly reading and this page’s +1.8°C monthly reading are not the same measurement and cannot be diffed against each other, is written up in full on our companion snow page, 2026-27 US El Niño snow predictions
, which is the more specific home for Nino-index detail. In short: CPC’s own weekly monitoring briefing (28 September) puts the current weekly Nino-3.4 reading at +2.2°C on a relative convention that is not directly comparable to +1.8°C, and the +3.0°C figure did not reproduce for the Nino-3.4 box specifically in that briefing — the nearest matches there belong to Nino-3 and Nino-1+2, different regions.
🔴 CPC’s +2.5 historic threshold is a RONI figure and we checked what that does to the arithmetic. The Relative Oceanic Nino Index subtracts the tropical-mean anomaly from Nino-3.4, and CPC publishes it as its own file. For June-August 2026 it reads +1.36 against the ONI’s +1.80, so the gap to +2.5 is 1.14 degrees, not the 0.70 you get by reading the ONI against a RONI threshold. Both series were pulled from CPC directly and compared season by season; scripts/build_enso_indices.py reproduces the table and fails if a revision ever breaks the claim below.
✅ We can show why CPC phrases the threshold in RONI rather than ONI, rather than just asserting that it does. On the ONI, 2015-16 peaked at +2.59 and two of its seasons cleared +2.5, so “a historic event exceeding every El Nino back to 1950” would be false at a +2.5 ONI. On the RONI, no season since 1950 reaches +2.5 — the record is +2.40 in 1982-83 — so the sentence is true as written only on the index CPC names. The script asserts that no RONI season has crossed the threshold, so if a future reanalysis changes it, the build fails rather than the page keeping a claim that has stopped holding.
⚠️ This page predicted the September STEO would supersede its heating degree day table, and it did not. We compared the August and September base-case workbooks cell by cell: October 2026 through March 2027 are identical to two decimal places, and only May to September 2026 moved. EIA’s own note under Table 9c explains it — “Current month based on forecasts by the NOAA Climate Prediction Center. Remaining months based on the 30-year trend.” The wrong prediction is corrected in the text rather than quietly deleted.
⚠️ The gas storage figure moved less than the language around it did. EIA cut end-of-October inventories from 3,985 Bcf to 3,969 — 0.4% — while dropping the word “record”, the comparison to 2016 and the administrator’s “cushion” quote. Both issues were read in full. A page still quoting the August framing would be quoting a description EIA has withdrawn.
🔴 The most quotable version of the city-level finding is the one we threw away. Measured against 1991-2020 normals, the eight strongest El Nino winters produce a clean north-south split and every southern metro looks cold. Five of those eight winters predate 1999, so a modern baseline charges them for the warming trend. Removing it twice — once against a 31-winter window centred on each winter, once against a straight-line fit through the station’s whole record — leaves the northern signal intact and collapses the southern one. The two methods agree on the sign for 29 of 30 metros; Atlanta is the exception and Atlanta is the one sitting on zero. Both numbers are printed on the chart rather than only the survivor.
🔴 Every station was checked against two different NOAA products before its numbers were used. The monthly-summary file and the normals file name the same station differently — NEW YORK CNTRL PK TWR against NY CITY CENTRAL PARK, and Las Vegas is MCCARRAN in one and HARRY REID in the other because the airport was renamed — so the identity check requires the state to match in both and a name fragment to appear in either. A transposed id returns a real station in another state, which is the failure that would be hardest to see in a finished table.
⚠️ Denver’s figures are not from Denver International, deliberately. DIA’s record starts in August 1994, which leaves five of the eight El Nino winters empty, and NCEI publishes no 1991-2020 snowfall normal for it at all. The Stapleton site record runs from 1948 to the present, has normals, and covers all eight.
⚠️ Salt Lake City disagrees with its own published normal by 1.15 °F and is the only one that does. Our December-February mean from monthly observations runs a few tenths below NCEI’s published normal at every station, which is expected; at Salt Lake City the gap is 1.15 °F, against 0.94 °F for the next largest. Its coordinates and elevation are unchanged across the whole record, so this is not a station move — it is NCEI’s own quality control, and it is named here rather than smoothed over.
⚠️ Four metros do not have all eight winters and the counts say so. Chicago and Detroit have seven, Kansas City and Houston six, because those stations’ records start after the winter of 1957-58. Every count on this page is printed as “of 7” or “of 6” where that applies rather than being scaled up to eight.
⚠️ The metro-to-region column is our join, not NOAA’s. CPC names regions in prose and publishes no city lookup. Seven metros sit near a seam and are marked in the table; where a metro is marked, its tilt is approximate.
🔴 The Florida tornado finding was built to survive the objection that would kill it. A raw count comparison between 1958 and 2016 partly measures the radar network rather than the atmosphere, so the analysis carries two defences against that and reports both in the body: a normalisation to Florida’s share of the national count for the same three months, and a headline restricted to (E)F1 and stronger, because weak tornadoes are the ones the early record misses. Segment records are excluded so a multi-state track is not counted twice. The script refuses to run if the eight analog winters stop reproducing from the ONI series.
⚠️ The road-safety figure most often quoted is the undated one, and this page does not use it. FHWA’s Snow and Ice page gives 24% of weather-related crashes and over 1,300 deaths a year with no date and no source attached; FHWA’s own dated statistics, five-year averages for 2019-2023 from NHTSA data, give 16% and 496 deaths for snow or slush and 13% and 521 for ice. We use the dated pair. Note also that this host soft-404s: an invented page returns HTTP 200 with a “page was not found” body, so status codes prove nothing there and the pages were checked by content.
⚠️ The 23% winter share of major power outages is Climate Central’s re-analysis of utility filings, not a federal statistic. EIA’s reliability reporting does not break interruptions down by weather type, so the figure is attributed to Climate Central and not to a government agency.
⚠️ The October date is EIA’s for the outlook it accompanies, not for the supplement itself, and the difference was tested against last year’s archive. A Wayback capture of the release schedule taken on 31 August 2025 carries the same annotation against 7 October 2025 — and the supplement did not appear until eight days later. That is why the body describes the date the way it does. Absence was checked too, with a control: the real 2025 article returns 200 at 139,444 bytes while the 2026 URL and two invented siblings all return 404 at an identical 46,186 bytes, so nothing has been quietly pre-staged.
🔴 No price appears in the heating section, by rule. Everything quoted from EIA is a physical quantity or a method: population-weighted heating degree days, storage volumes in billion cubic feet, and how the expenditure forecast is constructed. This site does not forecast the price of anything traded, and it does not convert a storage number into a bill.
⚠️ Both almanacs were read off the raw pages, and their dates are not where a reader would look. The Old Farmer’s Almanac forecast carries a JSON-LD publication date of 27 August 2026 while the byline printed on the page reads 29 August, which is the modified date. The Farmers’ Almanac forecast was published 6 August 2026 and its visible byline shows only “Updated: August 21, 2026”. Both dates are taken from the page metadata rather than the byline.
⚠️ Two almanac claims were dropped at the verification stage rather than published. A line that the Almanac’s underlying data is public is not on the page it was attributed to — the word does not occur in its prose at all. A stated 12-month forecast horizon “in the printed edition” is also not on that page: it never gives a horizon in months. Both were cut rather than softened.
🔴 The claim that nowhere is forecast colder was tested in code, not read off a map. scripts/make_winter_djf_outlook_charts.py searches every region and every season in the committed CPC outlook file for any cell mentioning below-normal temperature, and refuses to render if it finds one. It found none across eleven regions and six seasons. If a later CPC release adds a cold tilt, the chart build fails rather than quietly publishing a stale headline.
⚠️ “Not stated” in the regional table is CPC declining to lean, not a hole in our reading. Where the prognostic discussion gives no tilt for a region and season, the table says so. Treating those as “normal” would be putting words in the agency’s mouth; treating them as missing data would be wrong the other way.
⚠️ A seasonal outlook is not a forecast of cold snaps, and this page does not present it as one. The probabilities are for three-month averages against a 1991-2020 baseline. A winter that finishes above normal can still contain a severe fortnight, and the coldest places in an average winter — the northern Plains, interior Alaska — are a matter of climatology rather than of this outlook.
🔴 Corrected 23 August 2026: this table had seven winters and should have eight — 1957-58 was missing. Recomputing the ONI peak for every winter since 1950 over a SON-to-JFM window reproduces all seven peaks previously printed here, and turns up 1957-58 at +1.81, which clears the +1.6 threshold this page uses. Adding it does not weaken the finding: all eight were wetter than the 6.80-inch average, so the precipitation claim gets stronger, not weaker. The temperature count moves from five of seven to six of eight. 1987-88 is deliberately still excluded — it peaks at +1.70 in late summer 1987 and is down to +0.81 by DJF, so it is not a strong El Niño winter. Last winter’s own figures were refreshed at the same time: NOAA has revised them from 37.11 °F to 37.07 °F and from 5.01 to 5.02 inches since this page was first published, which leaves it second warmest and fourth driest either way.
⚠️ Corrected 23 August 2026: the 1991-92 ONI peak was printed as +1.66 and is +1.71. Recomputing every peak in the table from the same CPC series reproduced the other six exactly; 1.66 does not occur anywhere in the 1991 or 1992 ONI record. The winter still clears the +1.6 threshold and its temperature and precipitation ranks are unchanged, so nothing else on this page moves. The recomputation is now committed as scripts/build_winter_analogs.py, which fails if any published peak stops reproducing.
The 15 October date is two different kinds of claim and they are labelled separately. The Climate Prediction Center publishes its long-lead release calendar in advance; 15 October 2026 is on it, along with 20 August, 17 September and 19 November, and the page states the rule behind them — third Thursday of the month, around 8:30 AM Eastern. That part is a published schedule, not an inference. What NOAA has not announced is when the flagship Winter Outlook lands, so that is presented as a four-year pattern instead.
Those four dates were read from NOAA’s own timestamps, not from coverage of them. Each U.S. Winter Outlook news release on noaa.gov carries a machine-readable publication date, and they give 20 October 2022, 19 October 2023 and 17 October 2024. Every one is the third Thursday of October, which we computed rather than eyeballed. Invented URLs on the same host return 404, so a 200 there means the page is real.
🔴 Corrected 30 August 2026: the 2025–26 row was one date and is two. This page previously gave 16 October 2025 as the issue date and flagged it as the table’s weakest link, since no noaa.gov release could be opened for it. Both halves now have a source, and they disagree with each other for a reason. The outlook went out on Thursday 16 October 2025, during the 43-day federal shutdown, with no press conference — coverage dated 21 October 2025 describes NOAA as having “quietly released it’s outlook … sans press conference since the government shutdown continues” and the press conference as “rescheduled to November”. NWS’s own local write-up, released 20 November 2025, then dates the flagship to “NOAA’s U.S. Winter Outlook released on November 21”. So the four-year pattern holds for the product and breaks for the announcement, and the table now carries both columns instead of implying they are the same thing.
“Not issued” is a claim about absence, so it was checked against the product’s own home. The Climate Prediction Center’s seasonal outlook page lists what is currently published: a rolling set of monthly outlooks running out twelve seasons, including one for December–February 2026/27 at a 4.5-month lead. There is no 2026–27 Winter Outlook among them, and no NOAA release announcing one.
This page still forecasts nothing itself. The regional tilt is NOAA’s, the historical rankings are computed from NOAA’s own series, and no snowfall total appears anywhere — NOAA does not publish a national seasonal snowfall forecast, which is why snow has its own page here rather than a number in this one.
Written on 19 August 2026 UTC, which is deliberate. Local time at the desk was already the 20th, but the 20 August outlook is released at 8:30 AM Eastern on the 20th and had not happened. Every date in this article is the UTC one.